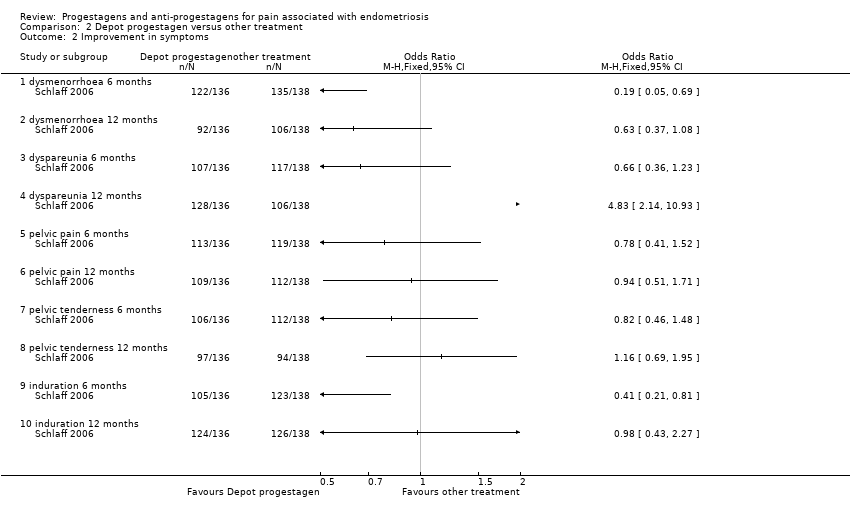
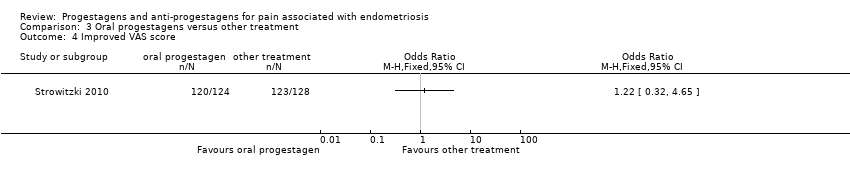
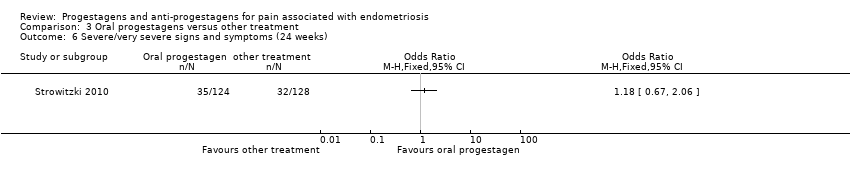
| 1 Patient assessed efficacy at end of treatment (6 months) Show forest plot | 2 | | Odds Ratio (M‐H, Fixed, 95% CI) | Subtotals only |
|
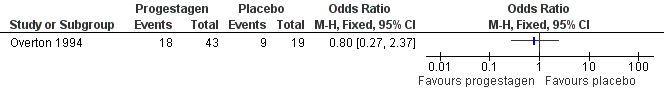
| 1.1 none or mild pelvic pain | 2 | 230 | Odds Ratio (M‐H, Fixed, 95% CI) | 0.71 [0.33, 1.56] |
| 1.2 none or mild painful periods (dysmenorrhoea) | 2 | 214 | Odds Ratio (M‐H, Fixed, 95% CI) | 0.72 [0.39, 1.33] |
| 1.3 none or mild pain on intercourse (dyspareunia) | 2 | 222 | Odds Ratio (M‐H, Fixed, 95% CI) | 0.83 [0.37, 1.86] |
| 2 Patient assessed efficacy 6 months after the end of treatment Show forest plot | 2 | | Peto Odds Ratio (Peto, Fixed, 95% CI) | Subtotals only |
|
| 2.1 none or mild pelvic pain | 2 | 202 | Peto Odds Ratio (Peto, Fixed, 95% CI) | 1.20 [0.58, 2.48] |
| 2.2 none or mild painful periods (dysmenorrhoea) | 2 | 176 | Peto Odds Ratio (Peto, Fixed, 95% CI) | 1.03 [0.55, 1.93] |
| 2.3 none or mild pain on intercourse (dyspareunia) | 2 | 192 | Peto Odds Ratio (Peto, Fixed, 95% CI) | 0.94 [0.42, 2.09] |
| 3 Objective assessment of efficacy at end of treatment (6 months) Show forest plot | 1 | | Mean Difference (IV, Fixed, 95% CI) | Totals not selected |
|
| 3.1 rAFS scores | 1 | | Mean Difference (IV, Fixed, 95% CI) | 0.0 [0.0, 0.0] |
| 3.2 implant score | 1 | | Mean Difference (IV, Fixed, 95% CI) | 0.0 [0.0, 0.0] |
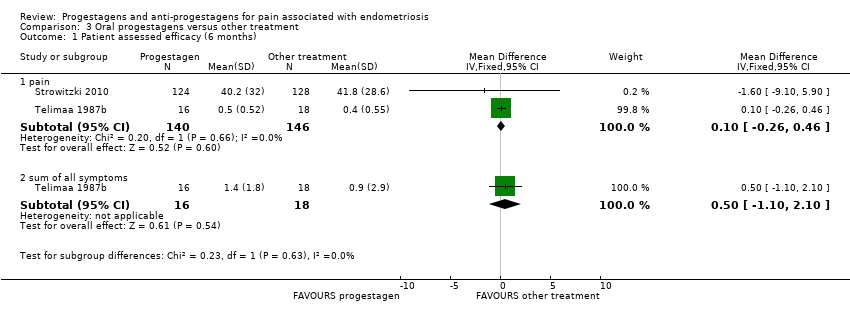
| 4 Patient assessed efficacy at end of treatment (6 months) Show forest plot | 1 | | Mean Difference (IV, Fixed, 95% CI) | Totals not selected |
|
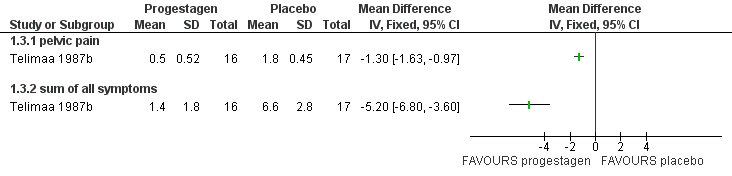
| 4.1 painful periods, visual analogue scale | 1 | | Mean Difference (IV, Fixed, 95% CI) | 0.0 [0.0, 0.0] |
| 4.2 painful periods, verbal rating scale | 1 | | Mean Difference (IV, Fixed, 95% CI) | 0.0 [0.0, 0.0] |
| 4.3 pain on intercourse, visual analogue scale | 1 | | Mean Difference (IV, Fixed, 95% CI) | 0.0 [0.0, 0.0] |
| 4.4 pain on intercourse, verbal rating scale | 1 | | Mean Difference (IV, Fixed, 95% CI) | 0.0 [0.0, 0.0] |
| 4.5 non‐menstrual pain, visual analogue scale | 1 | | Mean Difference (IV, Fixed, 95% CI) | 0.0 [0.0, 0.0] |
| 4.6 non‐menstrual pain, verbal rating scale | 1 | | Mean Difference (IV, Fixed, 95% CI) | 0.0 [0.0, 0.0] |
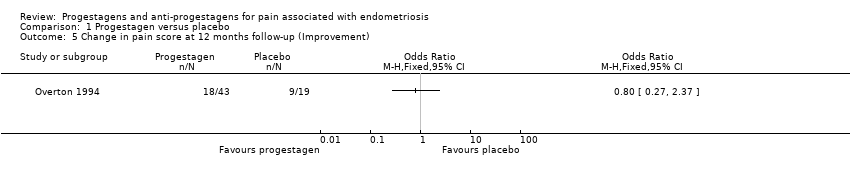
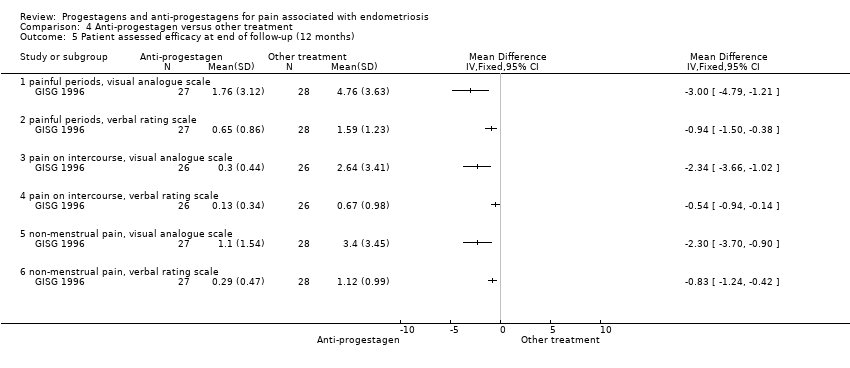
| 5 Patient assessed efficacy at end of follow‐up (12 months) Show forest plot | 1 | | Mean Difference (IV, Fixed, 95% CI) | Totals not selected |
|
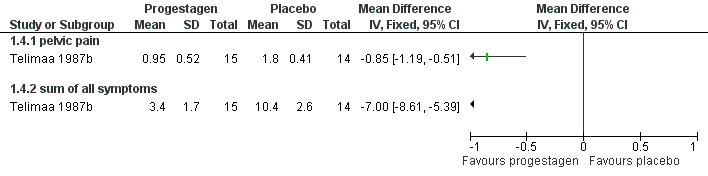
| 5.1 painful periods, visual analogue scale | 1 | | Mean Difference (IV, Fixed, 95% CI) | 0.0 [0.0, 0.0] |
| 5.2 painful periods, verbal rating scale | 1 | | Mean Difference (IV, Fixed, 95% CI) | 0.0 [0.0, 0.0] |
| 5.3 pain on intercourse, visual analogue scale | 1 | | Mean Difference (IV, Fixed, 95% CI) | 0.0 [0.0, 0.0] |
| 5.4 pain on intercourse, verbal rating scale | 1 | | Mean Difference (IV, Fixed, 95% CI) | 0.0 [0.0, 0.0] |
| 5.5 non‐menstrual pain, visual analogue scale | 1 | | Mean Difference (IV, Fixed, 95% CI) | 0.0 [0.0, 0.0] |
| 5.6 non‐menstrual pain, verbal rating scale | 1 | | Mean Difference (IV, Fixed, 95% CI) | 0.0 [0.0, 0.0] |
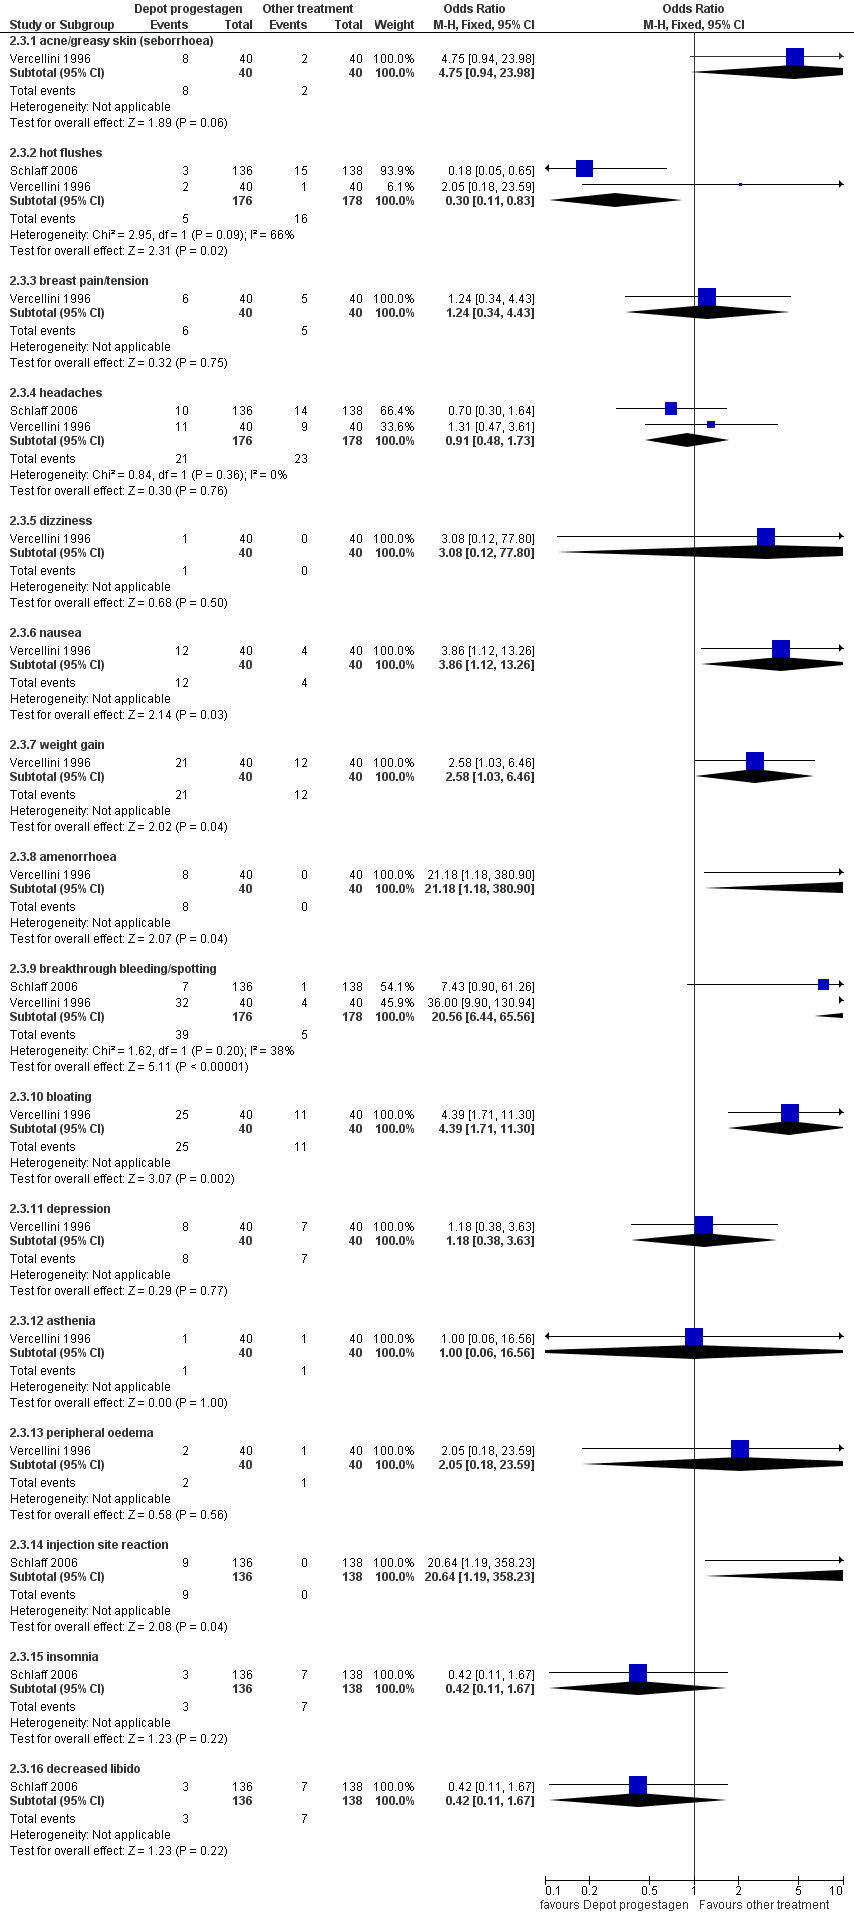
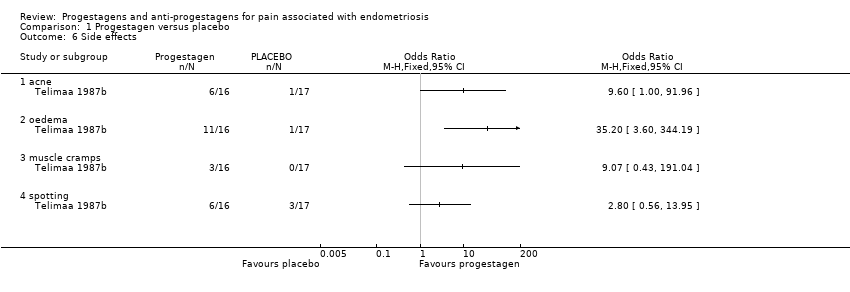
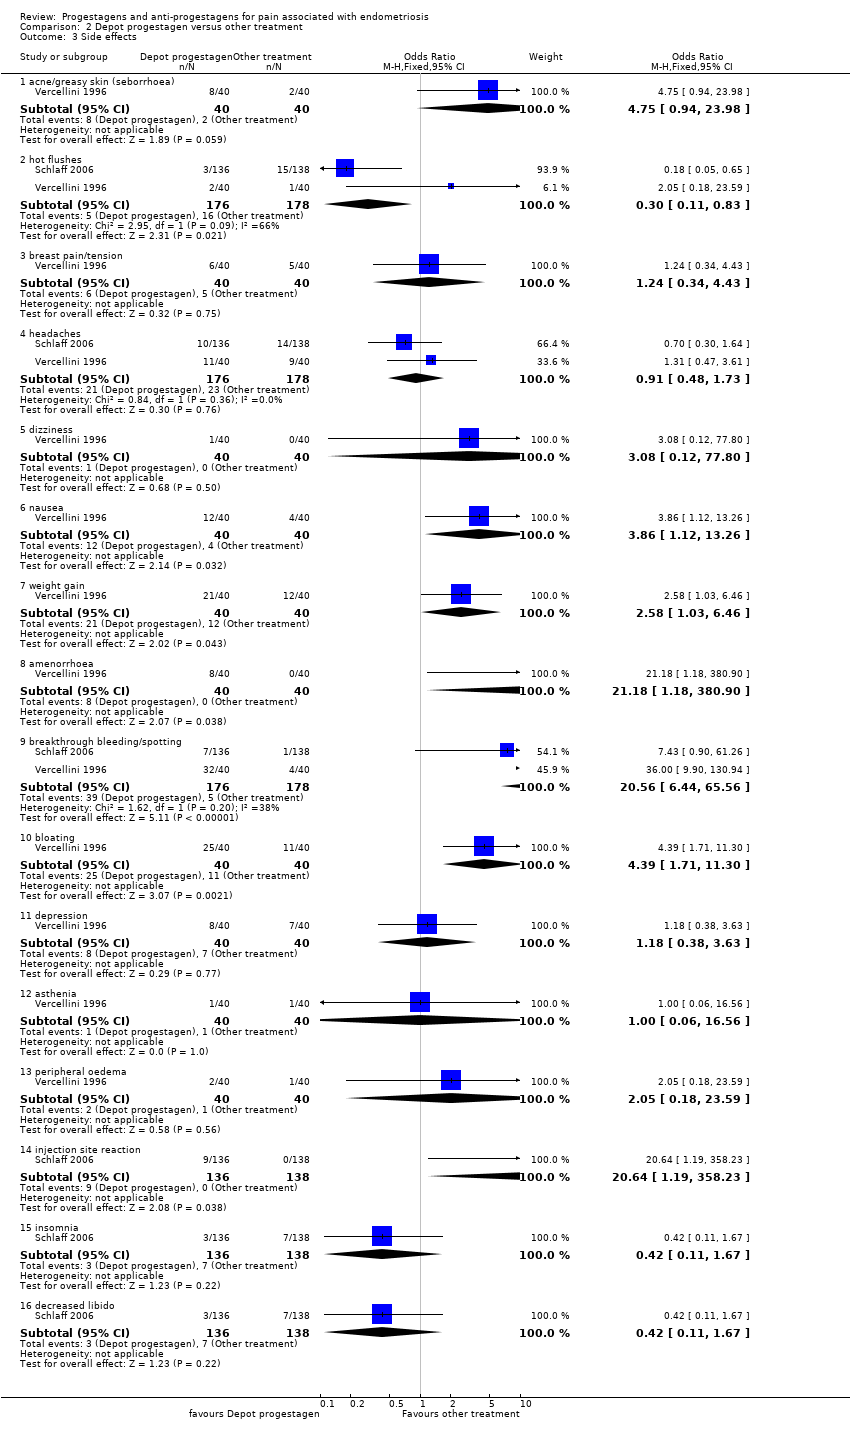
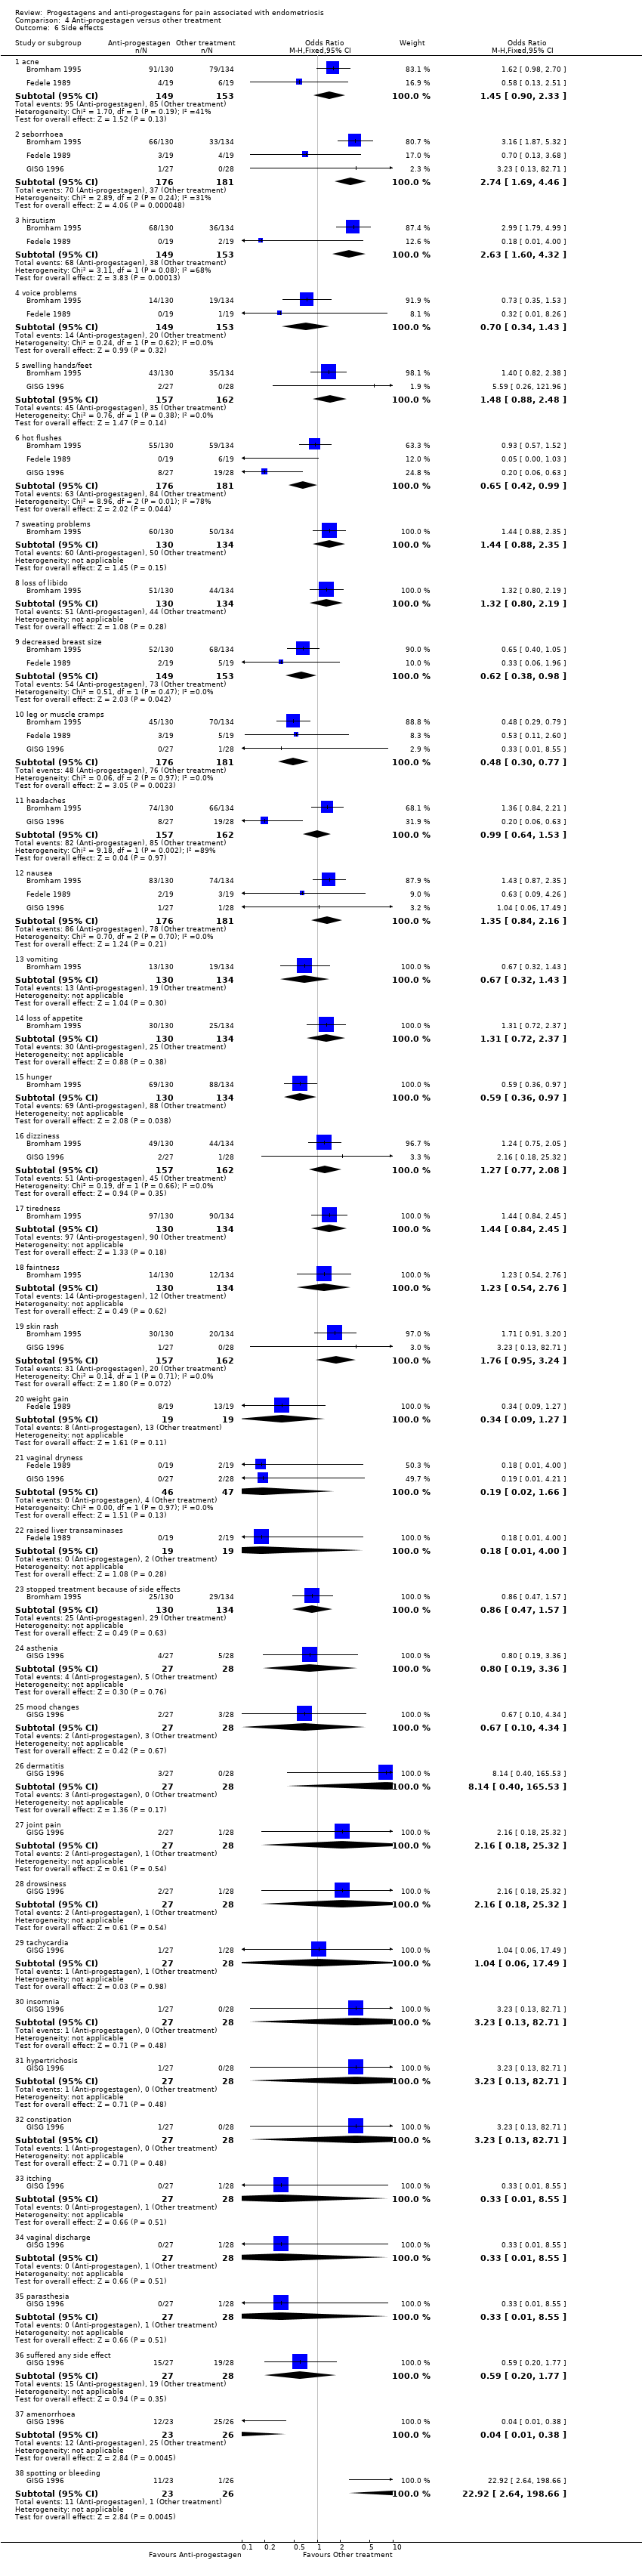
| 6 Side effects Show forest plot | 3 | | Odds Ratio (M‐H, Fixed, 95% CI) | Subtotals only |
|
| 6.1 acne | 2 | 302 | Odds Ratio (M‐H, Fixed, 95% CI) | 1.45 [0.90, 2.33] |
| 6.2 seborrhoea | 3 | 357 | Odds Ratio (M‐H, Fixed, 95% CI) | 2.74 [1.69, 4.46] |
| 6.3 hirsutism | 2 | 302 | Odds Ratio (M‐H, Fixed, 95% CI) | 2.63 [1.60, 4.32] |
| 6.4 voice problems | 2 | 302 | Odds Ratio (M‐H, Fixed, 95% CI) | 0.70 [0.34, 1.43] |
| 6.5 swelling hands/feet | 2 | 319 | Odds Ratio (M‐H, Fixed, 95% CI) | 1.48 [0.88, 2.48] |
| 6.6 hot flushes | 3 | 357 | Odds Ratio (M‐H, Fixed, 95% CI) | 0.65 [0.42, 0.99] |
| 6.7 sweating problems | 1 | 264 | Odds Ratio (M‐H, Fixed, 95% CI) | 1.44 [0.88, 2.35] |
| 6.8 loss of libido | 1 | 264 | Odds Ratio (M‐H, Fixed, 95% CI) | 1.32 [0.80, 2.19] |
| 6.9 decreased breast size | 2 | 302 | Odds Ratio (M‐H, Fixed, 95% CI) | 0.62 [0.38, 0.98] |
| 6.10 leg or muscle cramps | 3 | 357 | Odds Ratio (M‐H, Fixed, 95% CI) | 0.48 [0.30, 0.77] |
| 6.11 headaches | 2 | 319 | Odds Ratio (M‐H, Fixed, 95% CI) | 0.99 [0.64, 1.53] |
| 6.12 nausea | 3 | 357 | Odds Ratio (M‐H, Fixed, 95% CI) | 1.35 [0.84, 2.16] |
| 6.13 vomiting | 1 | 264 | Odds Ratio (M‐H, Fixed, 95% CI) | 0.67 [0.32, 1.43] |
| 6.14 loss of appetite | 1 | 264 | Odds Ratio (M‐H, Fixed, 95% CI) | 1.31 [0.72, 2.37] |
| 6.15 hunger | 1 | 264 | Odds Ratio (M‐H, Fixed, 95% CI) | 0.59 [0.36, 0.97] |
| 6.16 dizziness | 2 | 319 | Odds Ratio (M‐H, Fixed, 95% CI) | 1.27 [0.77, 2.08] |
| 6.17 tiredness | 1 | 264 | Odds Ratio (M‐H, Fixed, 95% CI) | 1.44 [0.84, 2.45] |
| 6.18 faintness | 1 | 264 | Odds Ratio (M‐H, Fixed, 95% CI) | 1.23 [0.54, 2.76] |
| 6.19 skin rash | 2 | 319 | Odds Ratio (M‐H, Fixed, 95% CI) | 1.76 [0.95, 3.24] |
| 6.20 weight gain | 1 | 38 | Odds Ratio (M‐H, Fixed, 95% CI) | 0.34 [0.09, 1.27] |
| 6.21 vaginal dryness | 2 | 93 | Odds Ratio (M‐H, Fixed, 95% CI) | 0.19 [0.02, 1.66] |
| 6.22 raised liver transaminases | 1 | 38 | Odds Ratio (M‐H, Fixed, 95% CI) | 0.18 [0.01, 4.00] |
| 6.23 stopped treatment because of side effects | 1 | 264 | Odds Ratio (M‐H, Fixed, 95% CI) | 0.86 [0.47, 1.57] |
| 6.24 asthenia | 1 | 55 | Odds Ratio (M‐H, Fixed, 95% CI) | 0.8 [0.19, 3.36] |
| 6.25 mood changes | 1 | 55 | Odds Ratio (M‐H, Fixed, 95% CI) | 0.67 [0.10, 4.34] |
| 6.26 dermatitis | 1 | 55 | Odds Ratio (M‐H, Fixed, 95% CI) | 8.14 [0.40, 165.53] |
| 6.27 joint pain | 1 | 55 | Odds Ratio (M‐H, Fixed, 95% CI) | 2.16 [0.18, 25.32] |
| 6.28 drowsiness | 1 | 55 | Odds Ratio (M‐H, Fixed, 95% CI) | 2.16 [0.18, 25.32] |
| 6.29 tachycardia | 1 | 55 | Odds Ratio (M‐H, Fixed, 95% CI) | 1.04 [0.06, 17.49] |
| 6.30 insomnia | 1 | 55 | Odds Ratio (M‐H, Fixed, 95% CI) | 3.23 [0.13, 82.71] |
| 6.31 hypertrichosis | 1 | 55 | Odds Ratio (M‐H, Fixed, 95% CI) | 3.23 [0.13, 82.71] |
| 6.32 constipation | 1 | 55 | Odds Ratio (M‐H, Fixed, 95% CI) | 3.23 [0.13, 82.71] |
| 6.33 itching | 1 | 55 | Odds Ratio (M‐H, Fixed, 95% CI) | 0.33 [0.01, 8.55] |
| 6.34 vaginal discharge | 1 | 55 | Odds Ratio (M‐H, Fixed, 95% CI) | 0.33 [0.01, 8.55] |
| 6.35 parasthesia | 1 | 55 | Odds Ratio (M‐H, Fixed, 95% CI) | 0.33 [0.01, 8.55] |
| 6.36 suffered any side effect | 1 | 55 | Odds Ratio (M‐H, Fixed, 95% CI) | 0.59 [0.20, 1.77] |
| 6.37 amenorrhoea | 1 | 49 | Odds Ratio (M‐H, Fixed, 95% CI) | 0.04 [0.01, 0.38] |
| 6.38 spotting or bleeding | 1 | 49 | Odds Ratio (M‐H, Fixed, 95% CI) | 22.92 [2.64, 198.66] |