| 1 Pain improvement Show forest plot | 7 | 497 | Odds Ratio (M‐H, Fixed, 95% CI) | 2.01 [1.32, 3.08] |
|
| 1.1 low dose oestrogen and 1st/2nd generation progestagen | 1 | 76 | Odds Ratio (M‐H, Fixed, 95% CI) | 1.83 [0.69, 4.83] |
| 1.2 low dose oestrogen and 3rd generation progestagen | 1 | 73 | Odds Ratio (M‐H, Fixed, 95% CI) | 0.0 [0.0, 0.0] |
| 1.3 medium dose oestrogen and 1st/2nd generation progestagen | 5 | 348 | Odds Ratio (M‐H, Fixed, 95% CI) | 2.06 [1.28, 3.30] |
| 2 Pain score (mean change) Show forest plot | 2 | 150 | Mean Difference (IV, Fixed, 95% CI) | ‐0.29 [‐0.46, ‐0.12] |
|
| 2.1 Low dose oestrogen and 1st/2nd generation progesterone | 1 | 74 | Mean Difference (IV, Fixed, 95% CI) | 1.50 [‐0.78, 3.78] |
| 2.2 Low dose oestrogen and 3rd generation progestagen | 1 | 76 | Mean Difference (IV, Fixed, 95% CI) | ‐0.3 [‐0.47, ‐0.13] |
| 2.3 Medium dose oestrogen and 1st/2nd generation progestagen | 0 | 0 | Mean Difference (IV, Fixed, 95% CI) | 0.0 [0.0, 0.0] |
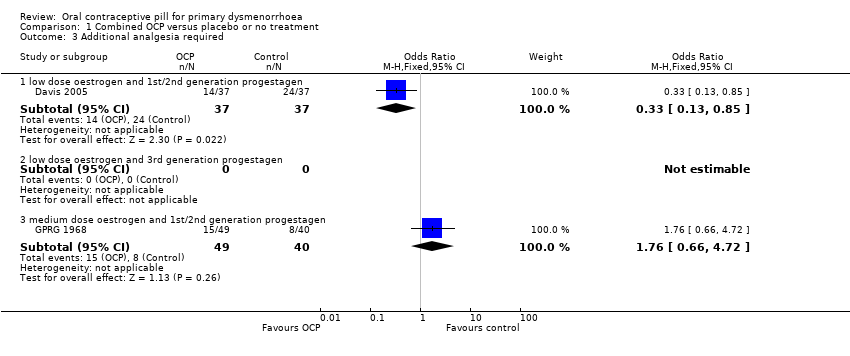
| 3 Additional analgesia required Show forest plot | 2 | | Odds Ratio (M‐H, Fixed, 95% CI) | Subtotals only |
|
| 3.1 low dose oestrogen and 1st/2nd generation progestagen | 1 | 74 | Odds Ratio (M‐H, Fixed, 95% CI) | 0.33 [0.13, 0.85] |
| 3.2 low dose oestrogen and 3rd generation progestagen | 0 | 0 | Odds Ratio (M‐H, Fixed, 95% CI) | 0.0 [0.0, 0.0] |
| 3.3 medium dose oestrogen and 1st/2nd generation progestagen | 1 | 89 | Odds Ratio (M‐H, Fixed, 95% CI) | 1.76 [0.66, 4.72] |
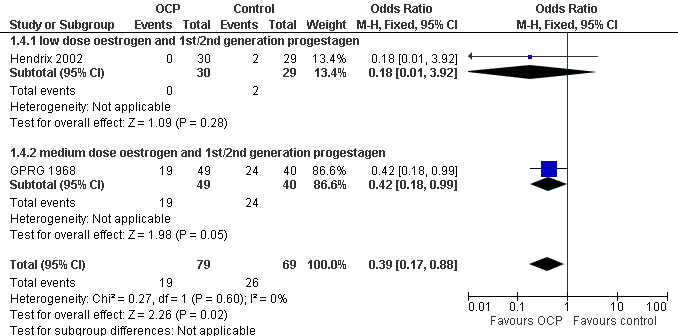
| 4 Absence from school or work Show forest plot | 2 | 148 | Odds Ratio (M‐H, Fixed, 95% CI) | 0.39 [0.17, 0.88] |
|
| 4.1 low dose oestrogen and 1st/2nd generation progestagen | 1 | 59 | Odds Ratio (M‐H, Fixed, 95% CI) | 0.18 [0.01, 3.92] |
| 4.2 medium dose oestrogen and 1st/2nd generation progestagen | 1 | 89 | Odds Ratio (M‐H, Fixed, 95% CI) | 0.42 [0.18, 0.99] |
| 5 Withdrawals from treatment Show forest plot | 2 | 134 | Odds Ratio (M‐H, Fixed, 95% CI) | 2.06 [0.18, 23.72] |
|
| 5.1 low dose oestrogen and 1st/2nd generation progestagen | 1 | 74 | Odds Ratio (M‐H, Fixed, 95% CI) | 2.06 [0.18, 23.72] |
| 5.2 low dose estrogen and 3rd generation progestagen | 1 | 60 | Odds Ratio (M‐H, Fixed, 95% CI) | 0.0 [0.0, 0.0] |
| 5.3 medium dose oestrogen and 1st/2nd generation progestagen | 0 | 0 | Odds Ratio (M‐H, Fixed, 95% CI) | 0.0 [0.0, 0.0] |
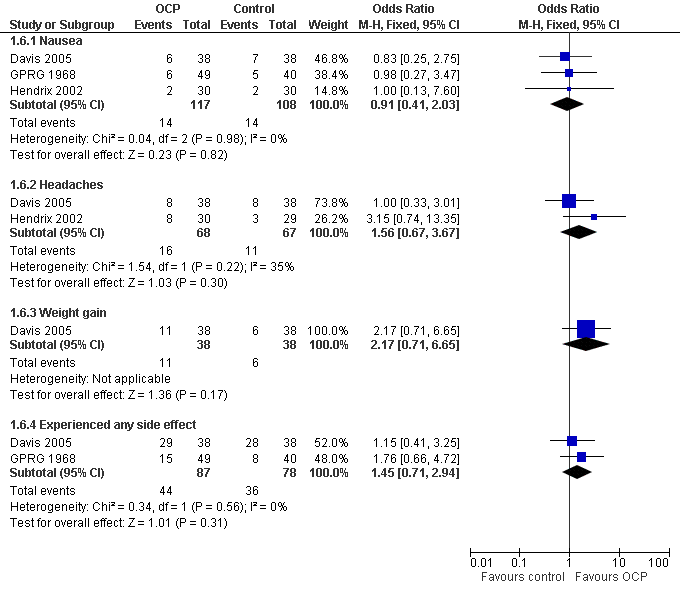
| 6 Adverse events Show forest plot | 3 | | Odds Ratio (M‐H, Fixed, 95% CI) | Subtotals only |
|
| 6.1 Nausea | 3 | 225 | Odds Ratio (M‐H, Fixed, 95% CI) | 0.91 [0.41, 2.03] |
| 6.2 Headaches | 2 | 135 | Odds Ratio (M‐H, Fixed, 95% CI) | 1.56 [0.67, 3.67] |
| 6.3 Weight gain | 1 | 76 | Odds Ratio (M‐H, Fixed, 95% CI) | 2.17 [0.71, 6.65] |
| 6.4 Experienced any side effect | 2 | 165 | Odds Ratio (M‐H, Fixed, 95% CI) | 1.45 [0.71, 2.94] |