Píldora anticonceptiva oral para la dismenorrea primaria
Referencias
References to studies included in this review
References to studies excluded from this review
Additional references
References to other published versions of this review
Characteristics of studies
Characteristics of included studies [ordered by study ID]
Ir a:
| Methods | Randomisation list was prepared with random number tables. | |
| Participants | Inclusion: aged 18 to 35 years old, require contraception for at least 12 months, sexually active, healthy. | |
| Interventions | 1. Ethinyl estradiol 0.03mg, 0.075mg gestodene | |
| Outcomes | Dysmenorrhoea (slight, moderate, severe) Adverse events. | |
| Notes | ||
| Risk of bias | ||
| Bias | Authors' judgement | Support for judgement |
| Adequate sequence generation? | Low risk | Random list of 20 blocks of 20 and 5 blocks of 10. |
| Allocation concealment? | Low risk | Women received a package of pills they agreed to use in accordance with a progressive random number of the list. |
| Blinding? | High risk | Open |
| Incomplete outcome data addressed? | Unclear risk | Although there were 98 dropouts it is unclear if they were included in the final analysis |
| Free of selective reporting? | Low risk | |
| Power calculations | Low risk | |
| Dropouts reported | Low risk | 98 dropouts (44 from the 30 mcg/gestodene group and 54 in the 20 mcg/150 mcg group). |
| Baseline comparability | Low risk | |
| Methods | Random ‐ unstated | |
| Participants | Inclusion: severe primary dysmenorrhoea (incapacitating pain for 2 or more days per cycle), pelvic exam to confirm no pathology. | |
| Interventions | 1. Norinyl 2 ‐ norethindrone 2mg with mestranol 0.1mg from day 5 to 25 (equivalent to 70mcg of ethinyl oestradiol) | |
| Outcomes | Duration and severity of dysmenorrhoea ‐ measured pre, during and post. No adverse events were collected. | |
| Notes | ||
| Risk of bias | ||
| Bias | Authors' judgement | Support for judgement |
| Adequate sequence generation? | Unclear risk | No method stated |
| Allocation concealment? | Unclear risk | B ‐ Unclear, stated randomised |
| Blinding? | Low risk | Double blind |
| Incomplete outcome data addressed? | High risk | |
| Free of selective reporting? | Low risk | |
| Power calculations | High risk | |
| Dropouts reported | High risk | |
| Baseline comparability | Low risk | |
| Methods | Random ‐ unstated | |
| Participants | Inclusion: severe primary dysmenorrhoea (incapacitating pain for 2 or more days per cycle), pelvic exam to confirm no pathology. | |
| Interventions | 1. Norinyl 2 ‐ norethindrone 2mg with mestranol 0.1mg from day 5 to 25 (equivalent to 70mcg of ethinyl oestradiol) | |
| Outcomes | Duration and severity of dysmenorrhoea ‐ measured pre, during and post. No adverse events were collected. | |
| Notes | ||
| Risk of bias | ||
| Bias | Authors' judgement | Support for judgement |
| Adequate sequence generation? | Unclear risk | No method stated |
| Allocation concealment? | Unclear risk | B ‐ Unclear, stated randomised |
| Blinding? | Low risk | Double blind |
| Incomplete outcome data addressed? | Unclear risk | No data provided |
| Free of selective reporting? | Unclear risk | No data provided |
| Power calculations | Unclear risk | No data provided |
| Dropouts reported | Unclear risk | No data provided |
| Baseline comparability | Unclear risk | No data provided |
| Methods | Randomisation was done statistically by the pharmaceutical company, allocation concealment was via a secure code not broken until after all data was collected. | |
| Participants | Inclusion: women aged between 18 to 45, absence of actual known disease, normal menstrual cycle, no actual or planned pregnancy. | |
| Interventions | 1. norgestrel 1mg, ethinyl oestradiol 0.05mg | |
| Outcomes | Dysmenorrhoea (improved, worse, unchanged, none prior to treatment) | |
| Notes | ||
| Risk of bias | ||
| Bias | Authors' judgement | Support for judgement |
| Adequate sequence generation? | Unclear risk | Pharmaceutical company provided the sequence |
| Allocation concealment? | Low risk | A ‐ Adequate, via a secure code not broken until after all data was collected. |
| Blinding? | Low risk | Double |
| Incomplete outcome data addressed? | High risk | |
| Free of selective reporting? | Unclear risk | No data provided |
| Power calculations | High risk | |
| Dropouts reported | High risk | |
| Baseline comparability | Low risk | |
| Methods | Randomisation list was prepared with random number tables. | |
| Participants | Inclusion: aged 19 years or younger with moderate or severe dysmenorrhoea, regular menstrual cycles for at least 1 year, 21 to 35 days of menstrual cycle length, condom users. 300 adolescents were screened for eligibility. | |
| Interventions | 1. Ethinyl estradiol 0.02mg, 0.1mg levonorgestrel | |
| Outcomes | Pain severity (5 point scale) Adverse events Discontinuation rate | |
| Notes | 3 publications from one study | |
| Risk of bias | ||
| Bias | Authors' judgement | Support for judgement |
| Adequate sequence generation? | Low risk | Random numbers table |
| Allocation concealment? | Low risk | A ‐ Adequate |
| Blinding? | Low risk | Double |
| Incomplete outcome data addressed? | Low risk | 76 randomised and 74 analysed |
| Free of selective reporting? | Low risk | |
| Power calculations | Low risk | Sample size was calculated for power to detect differences in main outcome of dysmenorrhoea between the OC group and the placebo group |
| Dropouts reported | Low risk | 7/ 150 (4 from OCP and 3 from placebo group) |
| Baseline comparability | Low risk | |
| Methods | Randomisation method not stated. | |
| Participants | Inclusion: aged 18 to 35 years old, desire for contraception for at least 12 months | |
| Interventions | 1. Ethinyl estradiol 0.02mg, 0.15mg desogestrel | |
| Outcomes | Dysmenorrhoea (did or did not experience pain relief) | |
| Notes | ||
| Risk of bias | ||
| Bias | Authors' judgement | Support for judgement |
| Adequate sequence generation? | Unclear risk | No information provided |
| Allocation concealment? | Unclear risk | B ‐ Unclear |
| Blinding? | High risk | Open |
| Incomplete outcome data addressed? | High risk | 87 women were excluded from the analysis because of protocol violations |
| Free of selective reporting? | Unclear risk | Did not report adverse events |
| Power calculations | Low risk | |
| Dropouts reported | Low risk | 449/1563 (228 from gestodene group and 221 from desogestrel group) |
| Baseline comparability | Low risk | |
| Methods | Administration of medicine was random however due to error each treatment had different numbers so were not identical | |
| Participants | Inclusion: all cases of dysmenorrhoea except mild pain | |
| Interventions | 1. Norinyl 1 ‐ norethisterone 1mg, mestranol 0.05mg | |
| Outcomes | Relief of pain | |
| Notes | ||
| Risk of bias | ||
| Bias | Authors' judgement | Support for judgement |
| Adequate sequence generation? | Unclear risk | Unequal numbers because of errors |
| Allocation concealment? | Unclear risk | B |
| Blinding? | Low risk | Double blinding but the placebo group had packaging that was different different from treatment group although the patients were unaware which group they were assigned to |
| Incomplete outcome data addressed? | High risk | |
| Free of selective reporting? | Low risk | |
| Power calculations | High risk | |
| Dropouts reported | High risk | |
| Baseline comparability | Low risk | |
| Methods | Randomisation list was generated by computer. | |
| Participants | Inclusion: history of Grade 2 or Grade 3 dysmenorrhoea for at least 4 cycles, regular menstrual cycles, pelvic exam to confirm no pathology, no older than 32 years old. | |
| Interventions | 1. 21 days of desogestrel 0.15mg, ethinyl estradiol 0.02mg followed by 2 days of placebo and 5 days of ethinyl estradiol 0.01mg | |
| Outcomes | Pain severity (5 point scale) | |
| Notes | ||
| Risk of bias | ||
| Bias | Authors' judgement | Support for judgement |
| Adequate sequence generation? | Low risk | Computer generated list |
| Allocation concealment? | Low risk | A ‐ Adequate |
| Blinding? | Low risk | Double |
| Incomplete outcome data addressed? | Low risk | |
| Free of selective reporting? | Unclear risk | No adverse events |
| Power calculations | High risk | |
| Dropouts reported | Low risk | 25/77 (14 from the desogestrel group and 11 from the placebo group) |
| Baseline comparability | Low risk | |
| Methods | Randomisation by 'envelope method' | |
| Participants | Inclusion: severe primary dysmenorrhoea that required absence from duty | |
| Interventions | 1. SH‐850 ‐ 0.5mg norgestrel, 0.05mg ethinyl estradiol from day 5‐25 | |
| Outcomes | Degree of symptomatic relief ‐ 3 point scale for each women and cycle | |
| Notes | ||
| Risk of bias | ||
| Bias | Authors' judgement | Support for judgement |
| Adequate sequence generation? | Unclear risk | No data provided |
| Allocation concealment? | Low risk | A "envelope method" |
| Blinding? | Low risk | Double |
| Incomplete outcome data addressed? | High risk | |
| Free of selective reporting? | Unclear risk | No adverse events |
| Power calculations | High risk | |
| Dropouts reported | Low risk | 4/22 |
| Baseline comparability | Low risk | |
| Methods | Randomisation method not stated. | |
| Participants | Inclusion: regular menstrual cycles (24‐35 days cycles), aged 18‐45 years old, BMI of 18‐29 kg/m2 | |
| Interventions | 1. Ethinyl estradiol 0.02mg, 0.15mg desogestrel | |
| Outcomes | Dysmenorrhoea (mild, moderate, severe) | |
| Notes | ||
| Risk of bias | ||
| Bias | Authors' judgement | Support for judgement |
| Adequate sequence generation? | Unclear risk | No data provided |
| Allocation concealment? | Unclear risk | B ‐ Unclear |
| Blinding? | High risk | |
| Incomplete outcome data addressed? | Unclear risk | No data provided |
| Free of selective reporting? | Unclear risk | No adverse events |
| Power calculations | Low risk | |
| Dropouts reported | Low risk | 182/1016 (85 from desogestrel and 97 from gestodene group) |
| Baseline comparability | Low risk | |
| Methods | Randomisation list was generated by computer. | |
| Participants | Inclusion: aged 18 to 45 years old, BMI of 18 to 29 kg/m2 | |
| Interventions | 1. Ethinyl estradiol 0.02mg and 0.15mg desogestrel | |
| Outcomes | Dysmenorrhoea (improved/ not improved) | |
| Notes | ||
| Risk of bias | ||
| Bias | Authors' judgement | Support for judgement |
| Adequate sequence generation? | Low risk | Computer generated |
| Allocation concealment? | Unclear risk | B ‐ |
| Blinding? | High risk | Open |
| Incomplete outcome data addressed? | Low risk | |
| Free of selective reporting? | Unclear risk | No adverse events reported |
| Power calculations | High risk | |
| Dropouts reported | Low risk | 239/1027 |
| Baseline comparability | Low risk | |
Characteristics of excluded studies [ordered by study ID]
Ir a:
| Study | Reason for exclusion |
| Study participants did not have dysmenorrhoea | |
| Only small number of women with dysmenorrhoea included in the study. | |
| Not a randomised or controlled clinical trial. No information on the oestrogen/progestagen compound used. | |
| Trial compared norethindrone/mestranol combination with placebo, however combination of OCP studied is no longer available. 2mg norethindrone, 0.1mg mestranol. | |
| Only small number of women with dysmenorrhoea included in the study. | |
| Trial compared Norinyl ‐ norethisterone 2mg and mestranol 0.1mg combination with placebo, this combination of OCP is no longer available. | |
| Not a randomised or controlled clinical trial. | |
| Only small number of women with dysmenorrhoea included in the study. | |
| The objective of the study was to compare the efficacy and safety of 5 different OCPs and only reported dysmenorrhoea as an adverse event in approximately 25% of patients. (Table 3) | |
| Not a randomised controlled trial | |
| Only small number of women with dysmenorrhoea included in the study. | |
| No women clearly with dysmenorrhea in the study | |
| Not an RCT. Allocation to treatment groups was retrospective. |
Data and analyses
| Outcome or subgroup title | No. of studies | No. of participants | Statistical method | Effect size |
| 1 Pain improvement Show forest plot | 7 | 497 | Odds Ratio (M‐H, Fixed, 95% CI) | 2.01 [1.32, 3.08] |
| Analysis 1.1  Comparison 1 Combined OCP versus placebo or no treatment, Outcome 1 Pain improvement. | ||||
| 1.1 low dose oestrogen and 1st/2nd generation progestagen | 1 | 76 | Odds Ratio (M‐H, Fixed, 95% CI) | 1.83 [0.69, 4.83] |
| 1.2 low dose oestrogen and 3rd generation progestagen | 1 | 73 | Odds Ratio (M‐H, Fixed, 95% CI) | 0.0 [0.0, 0.0] |
| 1.3 medium dose oestrogen and 1st/2nd generation progestagen | 5 | 348 | Odds Ratio (M‐H, Fixed, 95% CI) | 2.06 [1.28, 3.30] |
| 2 Pain score (mean change) Show forest plot | 2 | 150 | Mean Difference (IV, Fixed, 95% CI) | ‐0.29 [‐0.46, ‐0.12] |
| Analysis 1.2  Comparison 1 Combined OCP versus placebo or no treatment, Outcome 2 Pain score (mean change). | ||||
| 2.1 Low dose oestrogen and 1st/2nd generation progesterone | 1 | 74 | Mean Difference (IV, Fixed, 95% CI) | 1.50 [‐0.78, 3.78] |
| 2.2 Low dose oestrogen and 3rd generation progestagen | 1 | 76 | Mean Difference (IV, Fixed, 95% CI) | ‐0.3 [‐0.47, ‐0.13] |
| 2.3 Medium dose oestrogen and 1st/2nd generation progestagen | 0 | 0 | Mean Difference (IV, Fixed, 95% CI) | 0.0 [0.0, 0.0] |
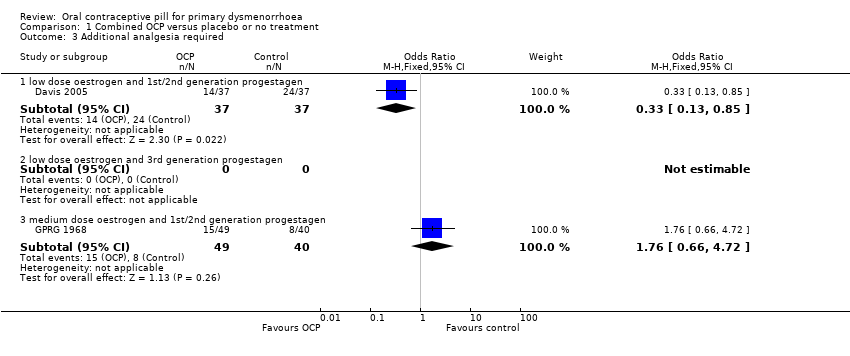
| 3 Additional analgesia required Show forest plot | 2 | Odds Ratio (M‐H, Fixed, 95% CI) | Subtotals only | |
| Analysis 1.3  Comparison 1 Combined OCP versus placebo or no treatment, Outcome 3 Additional analgesia required. | ||||
| 3.1 low dose oestrogen and 1st/2nd generation progestagen | 1 | 74 | Odds Ratio (M‐H, Fixed, 95% CI) | 0.33 [0.13, 0.85] |
| 3.2 low dose oestrogen and 3rd generation progestagen | 0 | 0 | Odds Ratio (M‐H, Fixed, 95% CI) | 0.0 [0.0, 0.0] |
| 3.3 medium dose oestrogen and 1st/2nd generation progestagen | 1 | 89 | Odds Ratio (M‐H, Fixed, 95% CI) | 1.76 [0.66, 4.72] |
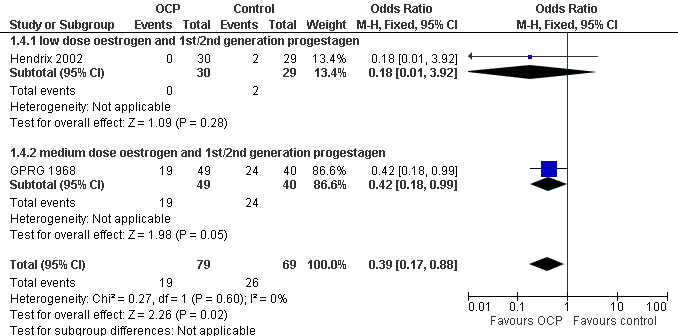
| 4 Absence from school or work Show forest plot | 2 | 148 | Odds Ratio (M‐H, Fixed, 95% CI) | 0.39 [0.17, 0.88] |
| Analysis 1.4  Comparison 1 Combined OCP versus placebo or no treatment, Outcome 4 Absence from school or work. | ||||
| 4.1 low dose oestrogen and 1st/2nd generation progestagen | 1 | 59 | Odds Ratio (M‐H, Fixed, 95% CI) | 0.18 [0.01, 3.92] |
| 4.2 medium dose oestrogen and 1st/2nd generation progestagen | 1 | 89 | Odds Ratio (M‐H, Fixed, 95% CI) | 0.42 [0.18, 0.99] |
| 5 Withdrawals from treatment Show forest plot | 2 | 134 | Odds Ratio (M‐H, Fixed, 95% CI) | 2.06 [0.18, 23.72] |
| Analysis 1.5  Comparison 1 Combined OCP versus placebo or no treatment, Outcome 5 Withdrawals from treatment. | ||||
| 5.1 low dose oestrogen and 1st/2nd generation progestagen | 1 | 74 | Odds Ratio (M‐H, Fixed, 95% CI) | 2.06 [0.18, 23.72] |
| 5.2 low dose estrogen and 3rd generation progestagen | 1 | 60 | Odds Ratio (M‐H, Fixed, 95% CI) | 0.0 [0.0, 0.0] |
| 5.3 medium dose oestrogen and 1st/2nd generation progestagen | 0 | 0 | Odds Ratio (M‐H, Fixed, 95% CI) | 0.0 [0.0, 0.0] |
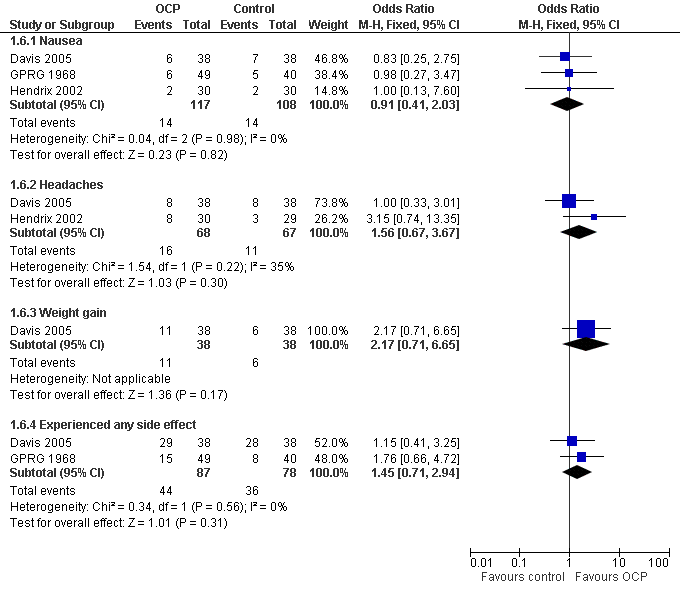
| 6 Adverse events Show forest plot | 3 | Odds Ratio (M‐H, Fixed, 95% CI) | Subtotals only | |
| Analysis 1.6  Comparison 1 Combined OCP versus placebo or no treatment, Outcome 6 Adverse events. | ||||
| 6.1 Nausea | 3 | 225 | Odds Ratio (M‐H, Fixed, 95% CI) | 0.91 [0.41, 2.03] |
| 6.2 Headaches | 2 | 135 | Odds Ratio (M‐H, Fixed, 95% CI) | 1.56 [0.67, 3.67] |
| 6.3 Weight gain | 1 | 76 | Odds Ratio (M‐H, Fixed, 95% CI) | 2.17 [0.71, 6.65] |
| 6.4 Experienced any side effect | 2 | 165 | Odds Ratio (M‐H, Fixed, 95% CI) | 1.45 [0.71, 2.94] |
| Outcome or subgroup title | No. of studies | No. of participants | Statistical method | Effect size |
| 1 Pain improvement Show forest plot | 3 | Peto Odds Ratio (Peto, Fixed, 95% CI) | Subtotals only | |
| Analysis 2.1  Comparison 2 Combined low dose OCP versus Combined low doseOCP, Outcome 1 Pain improvement. | ||||
| 1.1 3rd generation progestagens: 75mcg gestodene vs150mcg desogestrel | 2 | 626 | Peto Odds Ratio (Peto, Fixed, 95% CI) | 1.11 [0.79, 1.57] |
| 1.2 2nd generation versus 3rd generation progestagens100mcg levonorgestrel vs 150mcg desogestrel | 1 | 349 | Peto Odds Ratio (Peto, Fixed, 95% CI) | 0.44 [0.23, 0.84] |
| 2 Withdrawals from treatment Show forest plot | 3 | Odds Ratio (M‐H, Fixed, 95% CI) | Subtotals only | |
| Analysis 2.2  Comparison 2 Combined low dose OCP versus Combined low doseOCP, Outcome 2 Withdrawals from treatment. | ||||
| 2.1 3rd generation progestagens: 75mcg gestodene vs150mcg desogestrel | 2 | 626 | Odds Ratio (M‐H, Fixed, 95% CI) | 1.15 [0.72, 1.83] |
| 2.2 2nd generation versus 3rd generation progestagens: 100mcg levonorgestrel vs 150mcg desogestrel | 1 | 349 | Odds Ratio (M‐H, Fixed, 95% CI) | 4.41 [1.23, 15.77] |

Methodological quality graph: review authors' judgements about each methodological quality item presented as percentages across all included studies.
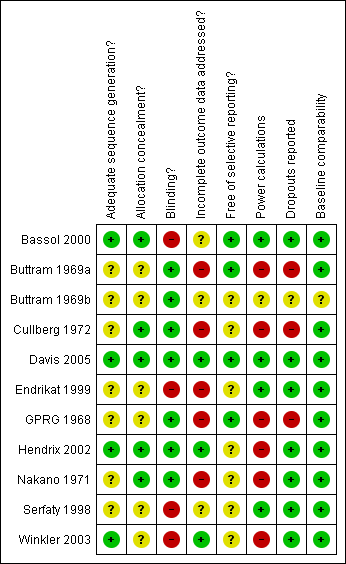
Methodological quality summary: review authors' judgements about each methodological quality item for each included study.

Forest plot of comparison: 1 Combined OCP versus placebo or no treatment, outcome: 1.1 Pain improvement.

Forest plot of comparison: 1 Combined OCP versus placebo or no treatment, outcome: 1.2 Pain score (mean change).

Forest plot of comparison: 1 Combined OCP versus placebo or no treatment, outcome: 1.3 Additional analgesia required.
Forest plot of comparison: 1 Combined OCP versus placebo or no treatment, outcome: 1.4 Absence from school or work.

Forest plot of comparison: 1 Combined OCP versus placebo or no treatment, outcome: 1.5 Withdrawals from treatment.
Forest plot of comparison: 1 Combined OCP versus placebo or no treatment, outcome: 1.6 Adverse events.

Forest plot of comparison: 2 Combined low dose OCP versus Combined low doseOCP, outcome: 2.1 Pain improvement.

Forest plot of comparison: 2 Combined low dose OCP versus Combined low doseOCP, outcome: 2.2 Withdrawals from treatment.

Comparison 1 Combined OCP versus placebo or no treatment, Outcome 1 Pain improvement.

Comparison 1 Combined OCP versus placebo or no treatment, Outcome 2 Pain score (mean change).
Comparison 1 Combined OCP versus placebo or no treatment, Outcome 3 Additional analgesia required.

Comparison 1 Combined OCP versus placebo or no treatment, Outcome 4 Absence from school or work.

Comparison 1 Combined OCP versus placebo or no treatment, Outcome 5 Withdrawals from treatment.

Comparison 1 Combined OCP versus placebo or no treatment, Outcome 6 Adverse events.
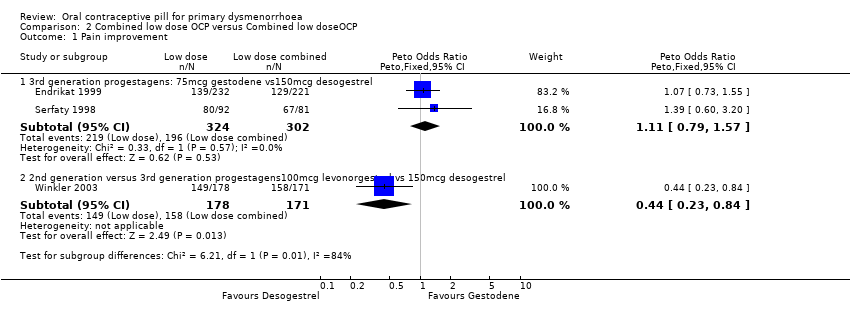
Comparison 2 Combined low dose OCP versus Combined low doseOCP, Outcome 1 Pain improvement.
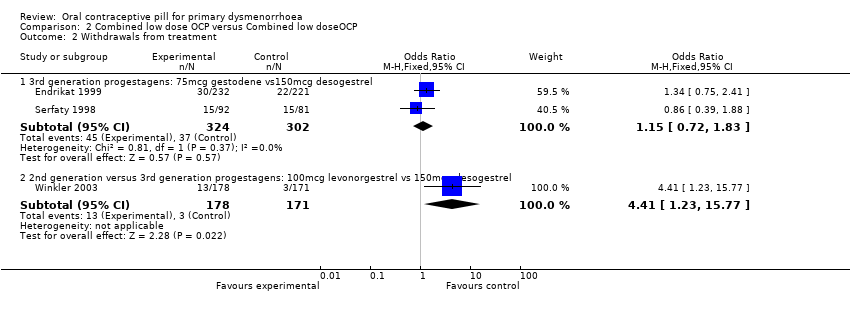
Comparison 2 Combined low dose OCP versus Combined low doseOCP, Outcome 2 Withdrawals from treatment.
| Outcome or subgroup title | No. of studies | No. of participants | Statistical method | Effect size |
| 1 Pain improvement Show forest plot | 7 | 497 | Odds Ratio (M‐H, Fixed, 95% CI) | 2.01 [1.32, 3.08] |
| 1.1 low dose oestrogen and 1st/2nd generation progestagen | 1 | 76 | Odds Ratio (M‐H, Fixed, 95% CI) | 1.83 [0.69, 4.83] |
| 1.2 low dose oestrogen and 3rd generation progestagen | 1 | 73 | Odds Ratio (M‐H, Fixed, 95% CI) | 0.0 [0.0, 0.0] |
| 1.3 medium dose oestrogen and 1st/2nd generation progestagen | 5 | 348 | Odds Ratio (M‐H, Fixed, 95% CI) | 2.06 [1.28, 3.30] |
| 2 Pain score (mean change) Show forest plot | 2 | 150 | Mean Difference (IV, Fixed, 95% CI) | ‐0.29 [‐0.46, ‐0.12] |
| 2.1 Low dose oestrogen and 1st/2nd generation progesterone | 1 | 74 | Mean Difference (IV, Fixed, 95% CI) | 1.50 [‐0.78, 3.78] |
| 2.2 Low dose oestrogen and 3rd generation progestagen | 1 | 76 | Mean Difference (IV, Fixed, 95% CI) | ‐0.3 [‐0.47, ‐0.13] |
| 2.3 Medium dose oestrogen and 1st/2nd generation progestagen | 0 | 0 | Mean Difference (IV, Fixed, 95% CI) | 0.0 [0.0, 0.0] |
| 3 Additional analgesia required Show forest plot | 2 | Odds Ratio (M‐H, Fixed, 95% CI) | Subtotals only | |
| 3.1 low dose oestrogen and 1st/2nd generation progestagen | 1 | 74 | Odds Ratio (M‐H, Fixed, 95% CI) | 0.33 [0.13, 0.85] |
| 3.2 low dose oestrogen and 3rd generation progestagen | 0 | 0 | Odds Ratio (M‐H, Fixed, 95% CI) | 0.0 [0.0, 0.0] |
| 3.3 medium dose oestrogen and 1st/2nd generation progestagen | 1 | 89 | Odds Ratio (M‐H, Fixed, 95% CI) | 1.76 [0.66, 4.72] |
| 4 Absence from school or work Show forest plot | 2 | 148 | Odds Ratio (M‐H, Fixed, 95% CI) | 0.39 [0.17, 0.88] |
| 4.1 low dose oestrogen and 1st/2nd generation progestagen | 1 | 59 | Odds Ratio (M‐H, Fixed, 95% CI) | 0.18 [0.01, 3.92] |
| 4.2 medium dose oestrogen and 1st/2nd generation progestagen | 1 | 89 | Odds Ratio (M‐H, Fixed, 95% CI) | 0.42 [0.18, 0.99] |
| 5 Withdrawals from treatment Show forest plot | 2 | 134 | Odds Ratio (M‐H, Fixed, 95% CI) | 2.06 [0.18, 23.72] |
| 5.1 low dose oestrogen and 1st/2nd generation progestagen | 1 | 74 | Odds Ratio (M‐H, Fixed, 95% CI) | 2.06 [0.18, 23.72] |
| 5.2 low dose estrogen and 3rd generation progestagen | 1 | 60 | Odds Ratio (M‐H, Fixed, 95% CI) | 0.0 [0.0, 0.0] |
| 5.3 medium dose oestrogen and 1st/2nd generation progestagen | 0 | 0 | Odds Ratio (M‐H, Fixed, 95% CI) | 0.0 [0.0, 0.0] |
| 6 Adverse events Show forest plot | 3 | Odds Ratio (M‐H, Fixed, 95% CI) | Subtotals only | |
| 6.1 Nausea | 3 | 225 | Odds Ratio (M‐H, Fixed, 95% CI) | 0.91 [0.41, 2.03] |
| 6.2 Headaches | 2 | 135 | Odds Ratio (M‐H, Fixed, 95% CI) | 1.56 [0.67, 3.67] |
| 6.3 Weight gain | 1 | 76 | Odds Ratio (M‐H, Fixed, 95% CI) | 2.17 [0.71, 6.65] |
| 6.4 Experienced any side effect | 2 | 165 | Odds Ratio (M‐H, Fixed, 95% CI) | 1.45 [0.71, 2.94] |
| Outcome or subgroup title | No. of studies | No. of participants | Statistical method | Effect size |
| 1 Pain improvement Show forest plot | 3 | Peto Odds Ratio (Peto, Fixed, 95% CI) | Subtotals only | |
| 1.1 3rd generation progestagens: 75mcg gestodene vs150mcg desogestrel | 2 | 626 | Peto Odds Ratio (Peto, Fixed, 95% CI) | 1.11 [0.79, 1.57] |
| 1.2 2nd generation versus 3rd generation progestagens100mcg levonorgestrel vs 150mcg desogestrel | 1 | 349 | Peto Odds Ratio (Peto, Fixed, 95% CI) | 0.44 [0.23, 0.84] |
| 2 Withdrawals from treatment Show forest plot | 3 | Odds Ratio (M‐H, Fixed, 95% CI) | Subtotals only | |
| 2.1 3rd generation progestagens: 75mcg gestodene vs150mcg desogestrel | 2 | 626 | Odds Ratio (M‐H, Fixed, 95% CI) | 1.15 [0.72, 1.83] |
| 2.2 2nd generation versus 3rd generation progestagens: 100mcg levonorgestrel vs 150mcg desogestrel | 1 | 349 | Odds Ratio (M‐H, Fixed, 95% CI) | 4.41 [1.23, 15.77] |