Tratamiento de la incontinencia fecal y la constipación en adultos con enfermedades neurológicas centrales
Información
- DOI:
- https://doi.org/10.1002/14651858.CD002115.pub5Copiar DOI

- Base de datos:
-
- Cochrane Database of Systematic Reviews
- Versión publicada:
-
- 13 enero 2014see what's new
- Tipo:
-
- Intervention
- Etapa:
-
- Review
- Grupo Editorial Cochrane:
-
Grupo Cochrane de Incontinencia
- Copyright:
-
- Copyright © 2014 The Cochrane Collaboration. Published by John Wiley & Sons, Ltd.
Cifras del artículo
Altmetric:
Citado por:
Autores
Contributions of authors
For this update (2013) all three review authors assessed the eligibility of the studies which resulted in the inclusion of a further 15 trials in the review. Five trials dealing with drugs that have been withdrawn from the market were excluded. The Protocol was also updated. All reviewers interpreted the results and contributed to the writing of the review.
Sources of support
Internal sources
-
Chief Scientist Office, Scottish Executive Health Department, UK.
External sources
-
The National Institute for Health Research, UK.
The National Institute for Health Research (NIHR) is the largest single funder of the Cochrane Incontinence Group
-
Department of Internal Medicine, University Hospital (CHUV), Lausanne, Switzerland.
-
NHS National R&D Programme for People with Physical and Complex Disabilities, UK.
-
Swiss Paraplegics Foundation, Basel, Switzerland.
-
Action Reserach, UK.
Declarations of interest
CN has consulted for Coloplast and Shire
MC has consulted for Coloplast
Acknowledgements
We thank Sheila Wallace for support in the undertaking and completion of this review. The review authors would like to acknowledge Paul Wiesel for his contribution to the previous versions of the review.
Version history
| Published | Title | Stage | Authors | Version |
| 2014 Jan 13 | Management of faecal incontinence and constipation in adults with central neurological diseases | Review | Maureen Coggrave, Christine Norton, June D Cody | |
| 2013 Dec 18 | Management of faecal incontinence and constipation in adults with central neurological diseases | Review | Maureen Coggrave, Christine Norton | |
| 2006 Apr 19 | Management of faecal incontinence and constipation in adults with central neurological diseases | Review | Maureen Coggrave, Paul Wiesel, Christine C Norton | |
| 2005 Apr 20 | Management of faecal incontinence and constipation in adults with central neurological diseases | Protocol | Paul H Wiesel, Christine S Norton, Miriam Brazzelli | |
Differences between protocol and review
Five studies related to the use of the prokinetic medications included in previous reviews have been removed. Cisapride has been withdrawn from sale worldwide since the conduct of these studies. Since the drug was licensed in 1988 there have been 386 reports of serious ventricular arrhythmias (125 fatal) associated with its use and 50 reports of sudden unexplained death (Ferriman 2002). Tegaserod was also withdrawn in 2007 due to concerns regarding adverse cardiovascular effects.
Keywords
MeSH
Medical Subject Headings (MeSH) Keywords
- Central Nervous System Diseases [*complications];
- Cisapride [therapeutic use];
- Constipation [etiology, *therapy];
- Fecal Incontinence [etiology, *therapy];
- Gastrointestinal Agents [therapeutic use];
- Parkinson Disease [complications];
- Psyllium [therapeutic use];
- Randomized Controlled Trials as Topic;
- Spinal Cord Injuries [complications];
Medical Subject Headings Check Words
Humans;
PICO

PRISMA study flow diagram.

Risk of bias graph: review authors' judgements about each risk of bias item presented as percentages across all included studies.

Risk of bias summary: review authors' judgements about each risk of bias item for each included study.
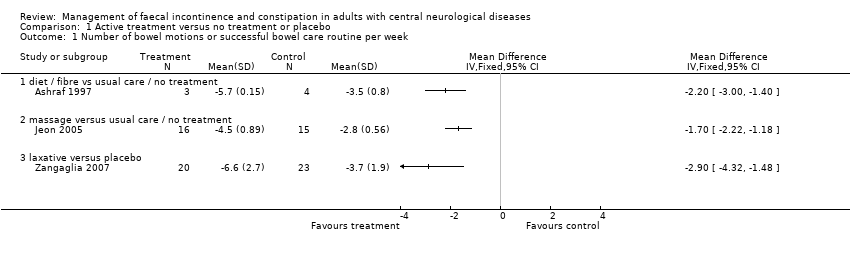
Comparison 1 Active treatment versus no treatment or placebo, Outcome 1 Number of bowel motions or successful bowel care routine per week.
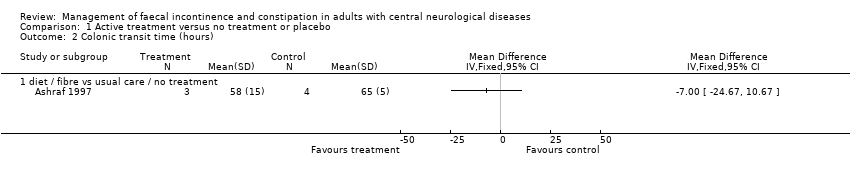
Comparison 1 Active treatment versus no treatment or placebo, Outcome 2 Colonic transit time (hours).
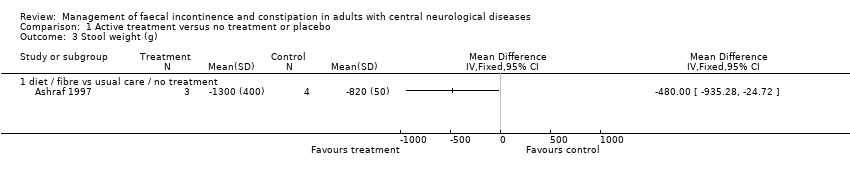
Comparison 1 Active treatment versus no treatment or placebo, Outcome 3 Stool weight (g).

Comparison 1 Active treatment versus no treatment or placebo, Outcome 4 Numbers NOT responding to treatment.
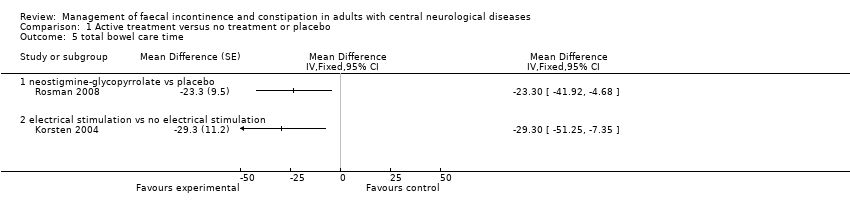
Comparison 1 Active treatment versus no treatment or placebo, Outcome 5 total bowel care time.
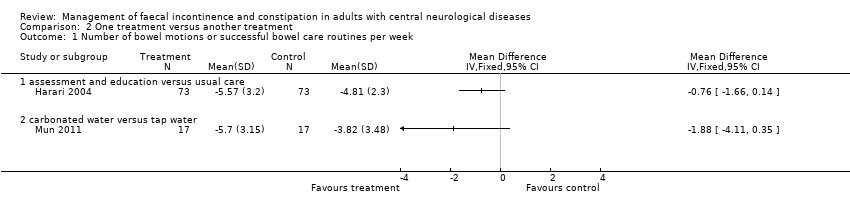
Comparison 2 One treatment versus another treatment, Outcome 1 Number of bowel motions or successful bowel care routines per week.

Comparison 2 One treatment versus another treatment, Outcome 2 Number of people with no evacuation after stimulation (poor response).
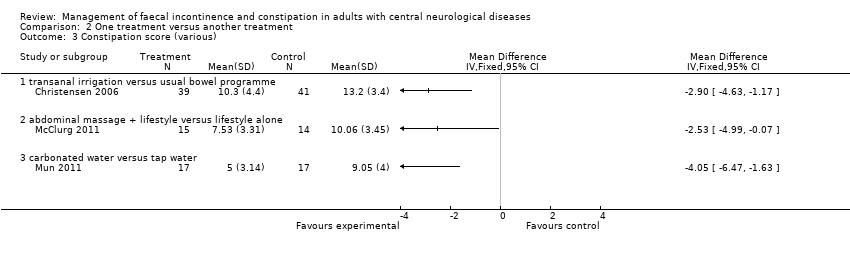
Comparison 2 One treatment versus another treatment, Outcome 3 Constipation score (various).

Comparison 2 One treatment versus another treatment, Outcome 4 Neurogenic bowel dysfunction score.

Comparison 2 One treatment versus another treatment, Outcome 5 Satisfaction with bowel care.
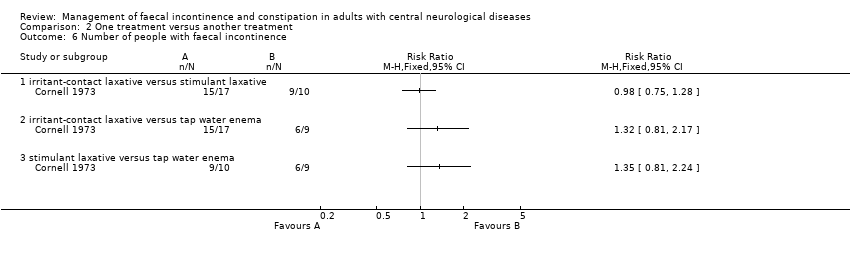
Comparison 2 One treatment versus another treatment, Outcome 6 Number of people with faecal incontinence.

Comparison 2 One treatment versus another treatment, Outcome 7 Faecal incontinence score.

Comparison 2 One treatment versus another treatment, Outcome 8 Total time for bowel care.
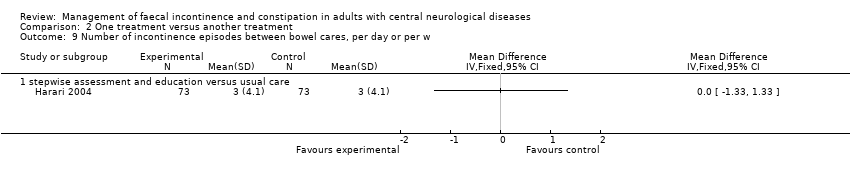
Comparison 2 One treatment versus another treatment, Outcome 9 Number of incontinence episodes between bowel cares, per day or per w.
| Outcome or subgroup title | No. of studies | No. of participants | Statistical method | Effect size |
| 1 Number of bowel motions or successful bowel care routine per week Show forest plot | 3 | Mean Difference (IV, Fixed, 95% CI) | Totals not selected | |
| 1.1 diet / fibre vs usual care / no treatment | 1 | Mean Difference (IV, Fixed, 95% CI) | 0.0 [0.0, 0.0] | |
| 1.2 massage versus usual care / no treatment | 1 | Mean Difference (IV, Fixed, 95% CI) | 0.0 [0.0, 0.0] | |
| 1.3 laxative versus placebo | 1 | Mean Difference (IV, Fixed, 95% CI) | 0.0 [0.0, 0.0] | |
| 2 Colonic transit time (hours) Show forest plot | 1 | Mean Difference (IV, Fixed, 95% CI) | Totals not selected | |
| 2.1 diet / fibre vs usual care / no treatment | 1 | Mean Difference (IV, Fixed, 95% CI) | 0.0 [0.0, 0.0] | |
| 3 Stool weight (g) Show forest plot | 1 | Mean Difference (IV, Fixed, 95% CI) | Totals not selected | |
| 3.1 diet / fibre vs usual care / no treatment | 1 | Mean Difference (IV, Fixed, 95% CI) | 0.0 [0.0, 0.0] | |
| 4 Numbers NOT responding to treatment Show forest plot | 1 | Risk Ratio (M‐H, Fixed, 95% CI) | Totals not selected | |
| 4.1 laxative versus placebo | 1 | Risk Ratio (M‐H, Fixed, 95% CI) | 0.0 [0.0, 0.0] | |
| 5 total bowel care time Show forest plot | 2 | Mean Difference (Fixed, 95% CI) | Totals not selected | |
| 5.1 neostigmine‐glycopyrrolate vs placebo | 1 | Mean Difference (Fixed, 95% CI) | 0.0 [0.0, 0.0] | |
| 5.2 electrical stimulation vs no electrical stimulation | 1 | Mean Difference (Fixed, 95% CI) | 0.0 [0.0, 0.0] | |
| Outcome or subgroup title | No. of studies | No. of participants | Statistical method | Effect size |
| 1 Number of bowel motions or successful bowel care routines per week Show forest plot | 2 | Mean Difference (IV, Fixed, 95% CI) | Totals not selected | |
| 1.1 assessment and education versus usual care | 1 | Mean Difference (IV, Fixed, 95% CI) | 0.0 [0.0, 0.0] | |
| 1.2 carbonated water versus tap water | 1 | Mean Difference (IV, Fixed, 95% CI) | 0.0 [0.0, 0.0] | |
| 2 Number of people with no evacuation after stimulation (poor response) Show forest plot | 1 | Risk Ratio (M‐H, Fixed, 95% CI) | Totals not selected | |
| 2.1 irritant‐contact laxative versus stimulant laxative | 1 | Risk Ratio (M‐H, Fixed, 95% CI) | 0.0 [0.0, 0.0] | |
| 2.2 irritant‐contact laxative versus tap water enema | 1 | Risk Ratio (M‐H, Fixed, 95% CI) | 0.0 [0.0, 0.0] | |
| 2.3 stimulant laxative versus tap water enema | 1 | Risk Ratio (M‐H, Fixed, 95% CI) | 0.0 [0.0, 0.0] | |
| 3 Constipation score (various) Show forest plot | 3 | Mean Difference (IV, Fixed, 95% CI) | Totals not selected | |
| 3.1 transanal irrigation versus usual bowel programme | 1 | Mean Difference (IV, Fixed, 95% CI) | 0.0 [0.0, 0.0] | |
| 3.2 abdominal massage + lifestyle versus lifestyle alone | 1 | Mean Difference (IV, Fixed, 95% CI) | 0.0 [0.0, 0.0] | |
| 3.3 carbonated water versus tap water | 1 | Mean Difference (IV, Fixed, 95% CI) | 0.0 [0.0, 0.0] | |
| 4 Neurogenic bowel dysfunction score Show forest plot | 2 | Mean Difference (IV, Fixed, 95% CI) | Totals not selected | |
| 4.1 transanal irrigation versus usual bowel programme | 1 | Mean Difference (IV, Fixed, 95% CI) | 0.0 [0.0, 0.0] | |
| 4.2 abdominal massage + lifestyle versus lifestyle alone | 1 | Mean Difference (IV, Fixed, 95% CI) | 0.0 [0.0, 0.0] | |
| 5 Satisfaction with bowel care Show forest plot | 1 | Mean Difference (IV, Fixed, 95% CI) | Totals not selected | |
| 5.1 transanal irrigation versus usual bowel programme | 1 | Mean Difference (IV, Fixed, 95% CI) | 0.0 [0.0, 0.0] | |
| 6 Number of people with faecal incontinence Show forest plot | 1 | Risk Ratio (M‐H, Fixed, 95% CI) | Totals not selected | |
| 6.1 irritant‐contact laxative versus stimulant laxative | 1 | Risk Ratio (M‐H, Fixed, 95% CI) | 0.0 [0.0, 0.0] | |
| 6.2 irritant‐contact laxative versus tap water enema | 1 | Risk Ratio (M‐H, Fixed, 95% CI) | 0.0 [0.0, 0.0] | |
| 6.3 stimulant laxative versus tap water enema | 1 | Risk Ratio (M‐H, Fixed, 95% CI) | 0.0 [0.0, 0.0] | |
| 7 Faecal incontinence score Show forest plot | 1 | Mean Difference (IV, Fixed, 95% CI) | Totals not selected | |
| 7.1 transanal irrigation versus usual bowel programme | 1 | Mean Difference (IV, Fixed, 95% CI) | 0.0 [0.0, 0.0] | |
| 8 Total time for bowel care Show forest plot | 1 | Mean Difference (IV, Fixed, 95% CI) | Totals not selected | |
| 8.1 transanal irrigation versus usual bowel programme | 1 | Mean Difference (IV, Fixed, 95% CI) | 0.0 [0.0, 0.0] | |
| 9 Number of incontinence episodes between bowel cares, per day or per w Show forest plot | 1 | Mean Difference (IV, Fixed, 95% CI) | Totals not selected | |
| 9.1 stepwise assessment and education versus usual care | 1 | Mean Difference (IV, Fixed, 95% CI) | 0.0 [0.0, 0.0] | |