Scolaris Content Display Scolaris Content Display

Figure1: Antibiotic comparisons in new studies included in this review. The red arrow indicates antibiotic comparisons studied in Udupa 2011.
Figuras y tablas -
Figure 1

Figure1: Antibiotic comparisons in new studies included in this review. The red arrow indicates antibiotic comparisons studied in Udupa 2011.

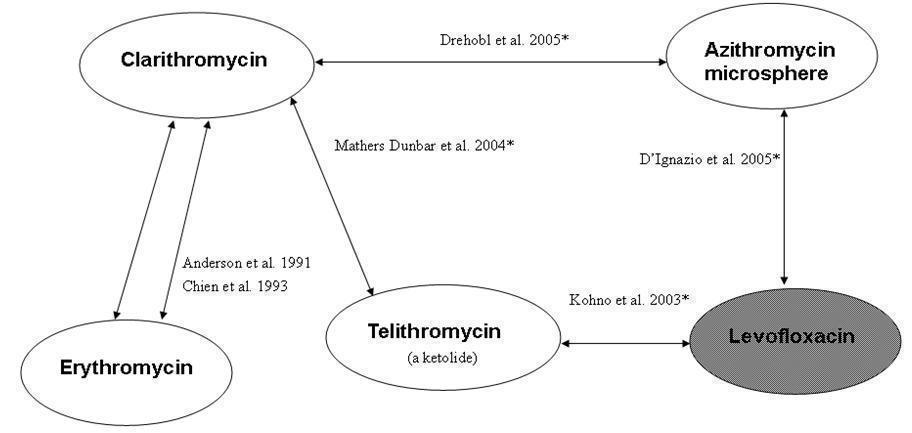
Figure 2. Overview of included studies and antibiotic pairs studied in 2009 review. *Indicates studies new to this review; shaded ovals indicate quinolones (gyrase inhibitors), white ovals indicate macrolides
Figuras y tablas -
Figure 2

Figure 2. Overview of included studies and antibiotic pairs studied in 2009 review. *Indicates studies new to this review; shaded ovals indicate quinolones (gyrase inhibitors), white ovals indicate macrolides

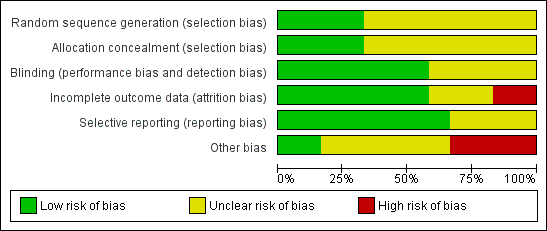
'Risk of bias' graph: review authors' judgements about each methodological quality item presented as percentages across all included studies.
Figuras y tablas -
Figure 3

'Risk of bias' graph: review authors' judgements about each methodological quality item presented as percentages across all included studies.

'Risk of bias' summary: review authors' judgements about each methodological quality item for each included study.
Figuras y tablas -
Figure 4

'Risk of bias' summary: review authors' judgements about each methodological quality item for each included study.

Comparison 1 Solithromycin versus levofloxacin, Outcome 1 Test‐of‐clinical‐cure.
Figuras y tablas -
Analysis 1.1

Comparison 1 Solithromycin versus levofloxacin, Outcome 1 Test‐of‐clinical‐cure.

Comparison 1 Solithromycin versus levofloxacin, Outcome 2 Bacteriological cure.
Figuras y tablas -
Analysis 1.2

Comparison 1 Solithromycin versus levofloxacin, Outcome 2 Bacteriological cure.

Comparison 1 Solithromycin versus levofloxacin, Outcome 3 Adverse events.
Figuras y tablas -
Analysis 1.3

Comparison 1 Solithromycin versus levofloxacin, Outcome 3 Adverse events.

Comparison 2 Nemonoxacin versus levofloxacin, Outcome 1 Test‐of‐clinical‐cure.
Figuras y tablas -
Analysis 2.1

Comparison 2 Nemonoxacin versus levofloxacin, Outcome 1 Test‐of‐clinical‐cure.

Comparison 2 Nemonoxacin versus levofloxacin, Outcome 2 Bacteriological cure.
Figuras y tablas -
Analysis 2.2

Comparison 2 Nemonoxacin versus levofloxacin, Outcome 2 Bacteriological cure.

Comparison 2 Nemonoxacin versus levofloxacin, Outcome 3 Adverse events.
Figuras y tablas -
Analysis 2.3

Comparison 2 Nemonoxacin versus levofloxacin, Outcome 3 Adverse events.

Comparison 3 Nemonoxacin versus levofloxacin, Outcome 1 Test‐of‐clinical‐cure.
Figuras y tablas -
Analysis 3.1

Comparison 3 Nemonoxacin versus levofloxacin, Outcome 1 Test‐of‐clinical‐cure.

Comparison 3 Nemonoxacin versus levofloxacin, Outcome 2 Bacteriological cure.
Figuras y tablas -
Analysis 3.2

Comparison 3 Nemonoxacin versus levofloxacin, Outcome 2 Bacteriological cure.

Comparison 3 Nemonoxacin versus levofloxacin, Outcome 3 Adverse events.
Figuras y tablas -
Analysis 3.3

Comparison 3 Nemonoxacin versus levofloxacin, Outcome 3 Adverse events.

Comparison 4 Clarithromycin versus amoxicillin, Outcome 1 Test‐of‐clinical‐cure.
Figuras y tablas -
Analysis 4.1

Comparison 4 Clarithromycin versus amoxicillin, Outcome 1 Test‐of‐clinical‐cure.

Study

Antibiotics

Events

Total

Udupa 2011

Clarithromycin

8

Udupa 2011

Azithromycin

7

Udupa 2011

Levofloxacin

7

Udupa 2011

High‐dose amoxicillin

9

Figuras y tablas -
Analysis 5.1

Comparison 5 Clarithromycin versus azithromycin versus levofloxacin versus amoxicillin, Outcome 1 Test‐of‐clinical‐cure.

Study

Antibiotic

Events

Total

Udupa 2011

Clarithromycin

4

8

Udupa 2011

Azithromycin

5

7

Udupa 2011

Levofloxacin

5

7

Udupa 2011

Amoxicillin

7

9

Figuras y tablas -
Analysis 5.2

Comparison 5 Clarithromycin versus azithromycin versus levofloxacin versus amoxicillin, Outcome 2 Adverse events.

Comparison 6 Cethromycin versus clarithromycin, Outcome 1 Test‐of‐clinical‐cure.
Figuras y tablas -
Analysis 6.1

Comparison 6 Cethromycin versus clarithromycin, Outcome 1 Test‐of‐clinical‐cure.

Comparison 6 Cethromycin versus clarithromycin, Outcome 2 Bacteriological cure.
Figuras y tablas -
Analysis 6.2

Comparison 6 Cethromycin versus clarithromycin, Outcome 2 Bacteriological cure.

Comparison 6 Cethromycin versus clarithromycin, Outcome 3 Adverse events.
Figuras y tablas -
Analysis 6.3

Comparison 6 Cethromycin versus clarithromycin, Outcome 3 Adverse events.

Comparison 7 Clarithromycin versus erythromycin, Outcome 1 Test‐of‐clinical‐cure.
Figuras y tablas -
Analysis 7.1

Comparison 7 Clarithromycin versus erythromycin, Outcome 1 Test‐of‐clinical‐cure.

Comparison 7 Clarithromycin versus erythromycin, Outcome 2 Bacteriological cure.
Figuras y tablas -
Analysis 7.2

Comparison 7 Clarithromycin versus erythromycin, Outcome 2 Bacteriological cure.

Comparison 7 Clarithromycin versus erythromycin, Outcome 3 Radiological cure.
Figuras y tablas -
Analysis 7.3

Comparison 7 Clarithromycin versus erythromycin, Outcome 3 Radiological cure.

Comparison 7 Clarithromycin versus erythromycin, Outcome 4 Adverse events.
Figuras y tablas -
Analysis 7.4

Comparison 7 Clarithromycin versus erythromycin, Outcome 4 Adverse events.

Comparison 8 Azithromycin microspheres versus levofloxacin, Outcome 1 Test‐of‐clinical‐cure.
Figuras y tablas -
Analysis 8.1

Comparison 8 Azithromycin microspheres versus levofloxacin, Outcome 1 Test‐of‐clinical‐cure.

Comparison 8 Azithromycin microspheres versus levofloxacin, Outcome 2 Bacteriological cure.
Figuras y tablas -
Analysis 8.2

Comparison 8 Azithromycin microspheres versus levofloxacin, Outcome 2 Bacteriological cure.

Comparison 8 Azithromycin microspheres versus levofloxacin, Outcome 3 Adverse events.
Figuras y tablas -
Analysis 8.3

Comparison 8 Azithromycin microspheres versus levofloxacin, Outcome 3 Adverse events.

Comparison 9 Azithromycin microspheres versus clarithromycin, Outcome 1 Test‐of‐clinical‐cure.
Figuras y tablas -
Analysis 9.1

Comparison 9 Azithromycin microspheres versus clarithromycin, Outcome 1 Test‐of‐clinical‐cure.

Comparison 9 Azithromycin microspheres versus clarithromycin, Outcome 2 Bacteriological cure.
Figuras y tablas -
Analysis 9.2

Comparison 9 Azithromycin microspheres versus clarithromycin, Outcome 2 Bacteriological cure.

Comparison 9 Azithromycin microspheres versus clarithromycin, Outcome 3 Adverse events.
Figuras y tablas -
Analysis 9.3

Comparison 9 Azithromycin microspheres versus clarithromycin, Outcome 3 Adverse events.

Comparison 10 Telithromycin versus clarithromycin, Outcome 1 Test‐of‐clinical‐cure.
Figuras y tablas -
Analysis 10.1

Comparison 10 Telithromycin versus clarithromycin, Outcome 1 Test‐of‐clinical‐cure.

Comparison 10 Telithromycin versus clarithromycin, Outcome 2 Bacteriological cure.
Figuras y tablas -
Analysis 10.2

Comparison 10 Telithromycin versus clarithromycin, Outcome 2 Bacteriological cure.

Comparison 10 Telithromycin versus clarithromycin, Outcome 3 Adverse events.
Figuras y tablas -
Analysis 10.3

Comparison 10 Telithromycin versus clarithromycin, Outcome 3 Adverse events.

Comparison 11 Telithromycin versus levofloxacin, Outcome 1 Test‐of‐clinical‐cure.
Figuras y tablas -
Analysis 11.1

Comparison 11 Telithromycin versus levofloxacin, Outcome 1 Test‐of‐clinical‐cure.

Comparison 11 Telithromycin versus levofloxacin, Outcome 2 Bacteriological cure.
Figuras y tablas -
Analysis 11.2

Comparison 11 Telithromycin versus levofloxacin, Outcome 2 Bacteriological cure.

Comparison 11 Telithromycin versus levofloxacin, Outcome 3 Clinical efficacy against H. influenzae.
Figuras y tablas -
Analysis 11.3

Comparison 11 Telithromycin versus levofloxacin, Outcome 3 Clinical efficacy against H. influenzae.

Comparison 11 Telithromycin versus levofloxacin, Outcome 4 Adverse events.
Figuras y tablas -
Analysis 11.4

Comparison 11 Telithromycin versus levofloxacin, Outcome 4 Adverse events.

Comparison 1. Solithromycin versus levofloxacin

Outcome or subgroup title

No. of studies

No. of participants

Statistical method

Effect size

1 Test‐of‐clinical‐cure Show forest plot

1

132

Odds Ratio (M‐H, Fixed, 95% CI)

0.85 [0.32, 2.26]

2 Bacteriological cure Show forest plot

1

32

Odds Ratio (M‐H, Fixed, 95% CI)

1.4 [0.28, 6.98]

3 Adverse events Show forest plot

1

132

Odds Ratio (M‐H, Fixed, 95% CI)

0.52 [0.19, 1.40]

Figuras y tablas -
Comparison 1. Solithromycin versus levofloxacin
Comparison 2. Nemonoxacin versus levofloxacin

Outcome or subgroup title

No. of studies

No. of participants

Statistical method

Effect size

1 Test‐of‐clinical‐cure Show forest plot

1

176

Odds Ratio (M‐H, Fixed, 95% CI)

1.18 [0.55, 2.53]

2 Bacteriological cure Show forest plot

1

91

Odds Ratio (M‐H, Fixed, 95% CI)

0.80 [0.19, 3.44]

3 Adverse events Show forest plot

1

176

Odds Ratio (M‐H, Fixed, 95% CI)

1.32 [0.73, 2.39]

Figuras y tablas -
Comparison 2. Nemonoxacin versus levofloxacin
Comparison 3. Nemonoxacin versus levofloxacin

Outcome or subgroup title

No. of studies

No. of participants

Statistical method

Effect size

1 Test‐of‐clinical‐cure Show forest plot

1

179

Odds Ratio (M‐H, Fixed, 95% CI)

0.76 [0.38, 1.54]

2 Bacteriological cure Show forest plot

1

96

Odds Ratio (M‐H, Fixed, 95% CI)

0.48 [0.13, 1.78]

3 Adverse events Show forest plot

1

179

Odds Ratio (M‐H, Fixed, 95% CI)

0.85 [0.47, 1.54]

Figuras y tablas -
Comparison 3. Nemonoxacin versus levofloxacin
Comparison 4. Clarithromycin versus amoxicillin

Outcome or subgroup title

No. of studies

No. of participants

Statistical method

Effect size

1 Test‐of‐clinical‐cure Show forest plot

1

42

Odds Ratio (M‐H, Fixed, 95% CI)

0.0 [0.0, 0.0]

Figuras y tablas -
Comparison 4. Clarithromycin versus amoxicillin
Comparison 5. Clarithromycin versus azithromycin versus levofloxacin versus amoxicillin

Outcome or subgroup title

No. of studies

No. of participants

Statistical method

Effect size

1 Test‐of‐clinical‐cure Show forest plot

Other data

No numeric data

2 Adverse events Show forest plot

Other data

No numeric data

Figuras y tablas -
Comparison 5. Clarithromycin versus azithromycin versus levofloxacin versus amoxicillin
Comparison 6. Cethromycin versus clarithromycin

Outcome or subgroup title

No. of studies

No. of participants

Statistical method

Effect size

1 Test‐of‐clinical‐cure Show forest plot

1

1025

Odds Ratio (M‐H, Fixed, 95% CI)

0.87 [0.63, 1.22]

2 Bacteriological cure Show forest plot

1

363

Odds Ratio (M‐H, Fixed, 95% CI)

0.89 [0.50, 1.58]

3 Adverse events Show forest plot

1

1096

Odds Ratio (M‐H, Fixed, 95% CI)

1.68 [1.32, 2.15]

Figuras y tablas -
Comparison 6. Cethromycin versus clarithromycin
Comparison 7. Clarithromycin versus erythromycin

Outcome or subgroup title

No. of studies

No. of participants

Statistical method

Effect size

1 Test‐of‐clinical‐cure Show forest plot

2

280

Odds Ratio (M‐H, Fixed, 95% CI)

2.27 [0.66, 7.80]

2 Bacteriological cure Show forest plot

2

57

Odds Ratio (M‐H, Fixed, 95% CI)

0.28 [0.03, 2.57]

3 Radiological cure Show forest plot

2

276

Odds Ratio (M‐H, Fixed, 95% CI)

0.91 [0.33, 2.49]

4 Adverse events Show forest plot

2

476

Odds Ratio (M‐H, Fixed, 95% CI)

0.30 [0.20, 0.46]

Figuras y tablas -
Comparison 7. Clarithromycin versus erythromycin
Comparison 8. Azithromycin microspheres versus levofloxacin

Outcome or subgroup title

No. of studies

No. of participants

Statistical method

Effect size

1 Test‐of‐clinical‐cure Show forest plot

1

363

Odds Ratio (M‐H, Fixed, 95% CI)

0.59 [0.27, 1.26]

2 Bacteriological cure Show forest plot

1

237

Odds Ratio (M‐H, Fixed, 95% CI)

0.81 [0.32, 2.02]

3 Adverse events Show forest plot

1

423

Odds Ratio (M‐H, Fixed, 95% CI)

1.78 [1.04, 3.03]

Figuras y tablas -
Comparison 8. Azithromycin microspheres versus levofloxacin
Comparison 9. Azithromycin microspheres versus clarithromycin

Outcome or subgroup title

No. of studies

No. of participants

Statistical method

Effect size

1 Test‐of‐clinical‐cure Show forest plot

1

411

Odds Ratio (M‐H, Fixed, 95% CI)

0.69 [0.31, 1.55]

2 Bacteriological cure Show forest plot

1

303

Odds Ratio (M‐H, Fixed, 95% CI)

1.17 [0.52, 2.61]

3 Adverse events Show forest plot

1

499

Odds Ratio (M‐H, Fixed, 95% CI)

1.09 [0.73, 1.64]

Figuras y tablas -
Comparison 9. Azithromycin microspheres versus clarithromycin
Comparison 10. Telithromycin versus clarithromycin

Outcome or subgroup title

No. of studies

No. of participants

Statistical method

Effect size

1 Test‐of‐clinical‐cure Show forest plot

1

318

Odds Ratio (M‐H, Fixed, 95% CI)

0.98 [0.49, 1.95]

2 Bacteriological cure Show forest plot

1

62

Odds Ratio (M‐H, Fixed, 95% CI)

0.24 [0.03, 2.29]

3 Adverse events Show forest plot

1

443

Odds Ratio (M‐H, Fixed, 95% CI)

1.61 [1.08, 2.40]

Figuras y tablas -
Comparison 10. Telithromycin versus clarithromycin
Comparison 11. Telithromycin versus levofloxacin

Outcome or subgroup title

No. of studies

No. of participants

Statistical method

Effect size

1 Test‐of‐clinical‐cure Show forest plot

1

123

Odds Ratio (M‐H, Fixed, 95% CI)

0.85 [0.14, 5.25]

2 Bacteriological cure Show forest plot

1

86

Odds Ratio (M‐H, Fixed, 95% CI)

0.03 [0.00, 0.60]

3 Clinical efficacy against H. influenzae Show forest plot

1

46

Odds Ratio (M‐H, Fixed, 95% CI)

4.62 [0.38, 55.51]

4 Adverse events Show forest plot

1

240

Odds Ratio (M‐H, Fixed, 95% CI)

0.99 [0.58, 1.68]

Figuras y tablas -
Comparison 11. Telithromycin versus levofloxacin