Scolaris Content Display Scolaris Content Display

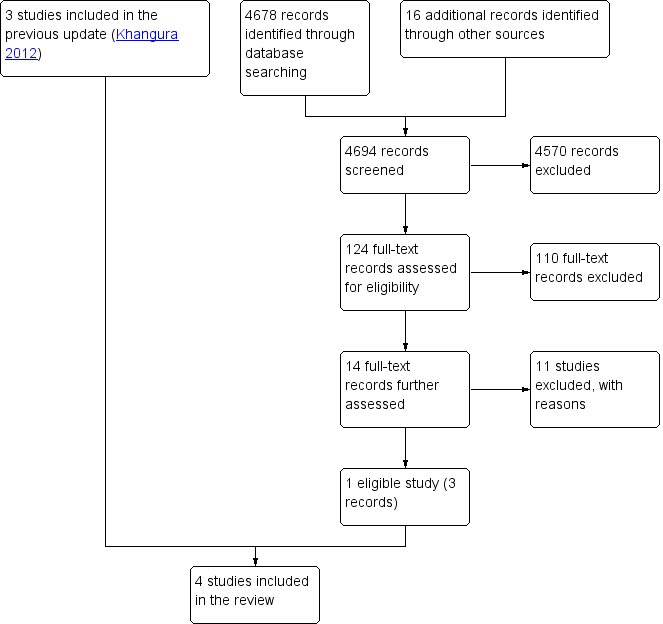
Study flow diagram.
Figuras y tablas -
Figure 1

Study flow diagram.

Risk of bias graph: review authors' judgements about each risk of bias item presented as percentages across all included studies.
Figuras y tablas -
Figure 2

Risk of bias graph: review authors' judgements about each risk of bias item presented as percentages across all included studies.

Risk of bias summary: review authors' judgements about each risk of bias item for each included study.
Figuras y tablas -
Figure 3

Risk of bias summary: review authors' judgements about each risk of bias item for each included study.

Forest plot of comparison: 1 Comparisons of general practitioners versus emergency physicians, outcome: 1.1 Admissions.
Figuras y tablas -
Figure 4

Forest plot of comparison: 1 Comparisons of general practitioners versus emergency physicians, outcome: 1.1 Admissions.

Forest plot of comparison: 1 Comparisons of general practitioners versus emergency physicians, outcome: 1.2 All investigations.
Figuras y tablas -
Figure 5

Forest plot of comparison: 1 Comparisons of general practitioners versus emergency physicians, outcome: 1.2 All investigations.

Forest plot of comparison: 1 Comparisons of general practitioners versus emergency physicians, outcome: 1.3 Laboratory investigations.
Figuras y tablas -
Figure 6

Forest plot of comparison: 1 Comparisons of general practitioners versus emergency physicians, outcome: 1.3 Laboratory investigations.

Forest plot of comparison: 1 Comparisons of general practitioners versus emergency physicians, outcome: 1.4 Imaging results.
Figuras y tablas -
Figure 7

Forest plot of comparison: 1 Comparisons of general practitioners versus emergency physicians, outcome: 1.4 Imaging results.

Forest plot of comparison: 1 Comparisons of general practitioners versus emergency physicians, outcome: 1.5 Any prescription.
Figuras y tablas -
Figure 8

Forest plot of comparison: 1 Comparisons of general practitioners versus emergency physicians, outcome: 1.5 Any prescription.

Forest plot of comparison: 1 Comparisons of general practitioners versus emergency physicians, outcome: 1.6 Referrals.
Figuras y tablas -
Figure 9

Forest plot of comparison: 1 Comparisons of general practitioners versus emergency physicians, outcome: 1.6 Referrals.

Comparison 1 Comparions of general practitioners versus emergency physicians, Outcome 1 Admission to hospital.
Figuras y tablas -
Analysis 1.1

Comparison 1 Comparions of general practitioners versus emergency physicians, Outcome 1 Admission to hospital.

Comparison 1 Comparions of general practitioners versus emergency physicians, Outcome 2 Diagnostic tests: all investigations.
Figuras y tablas -
Analysis 1.2

Comparison 1 Comparions of general practitioners versus emergency physicians, Outcome 2 Diagnostic tests: all investigations.

Comparison 1 Comparions of general practitioners versus emergency physicians, Outcome 3 Diagnostic tests: laboratory investigations.
Figuras y tablas -
Analysis 1.3

Comparison 1 Comparions of general practitioners versus emergency physicians, Outcome 3 Diagnostic tests: laboratory investigations.

Comparison 1 Comparions of general practitioners versus emergency physicians, Outcome 4 Diagnostic tests: imaging results.
Figuras y tablas -
Analysis 1.4

Comparison 1 Comparions of general practitioners versus emergency physicians, Outcome 4 Diagnostic tests: imaging results.

Comparison 1 Comparions of general practitioners versus emergency physicians, Outcome 5 Treatments given: any prescription.
Figuras y tablas -
Analysis 1.5

Comparison 1 Comparions of general practitioners versus emergency physicians, Outcome 5 Treatments given: any prescription.

Comparison 1 Comparions of general practitioners versus emergency physicians, Outcome 6 Consultations or referrals to hospital‐based specialists.
Figuras y tablas -
Analysis 1.6

Comparison 1 Comparions of general practitioners versus emergency physicians, Outcome 6 Consultations or referrals to hospital‐based specialists.

Summary of findings for the main comparison. Primary care professionals compared with ordinary emergency department physicians for patients with minor injuries and illnesses who attend hospital emergency departments

Primary care professionals compared with ordinary emergency department physicians for patients with minor injuries and illnesses who attend hospital emergency departments

Patient or population: patients with minor injuries and illnesses

Settings: hospital emergency departments (Ireland, UK, Australia)

Intervention: primary care professionals       

Comparison: ordinary emergency department physicians

Outcomes

Relative effect

No. of participants
(studies)

Certainty of the evidence
(GRADE)

Comments

Time from arrival to clinical assessment and treatment

MD 2.1 minutes (95% CI ‐4.9 to 9.2)

260

(1 study)

⊕⊝⊝⊝1,2

very low

Expressed in minutes

Follow‐up not reported.

Total length of ED stay

MD ‐3.2 minutes (95% CI ‐20.2 to 13.8)

260

(1 study)

⊕⊝⊝⊝1,2

very low

Expressed in minutes

Follow‐up not reported.

Admission to hospital

RR ranged from 0.33 to 1.11

11,203
(3 studies)

⊕⊝⊝⊝
very low3,4,5

Percentage of patients admitted to hospital from ED
Follow‐up: 7 to 15 months

Diagnostic tests

RR ranged from 0.35 to 0.96

(laboratory investigations)

RR ranged from 0.47 to 1.07

(imaging results)

11,203
(3 studies)

⊕⊝⊝⊝
very low1,4,5

Percentage of patients for whom any blood investigation or imaging results were ordered
Follow‐up: 7 to 15 months

Treatments given

RR ranged from 0.95 to 1.45

(any prescription)

11,203
(3 studies)

⊕⊝⊝⊝
very low1,4,5

Percentage of patients given medication or prescription
Follow‐up: 7 to 15 months

Consultations or referrals to hospital‐based specialists

RR ranged from 0.5 to 1.21

11,203
(3 studies)

⊕⊝⊝⊝
very low3,4,5

Percentage of patients referred to consultants
Follow‐up: 7 to 15 months

In Dale 1995, patients referred to on‐call teams were excluded.

Costs

Cost reduction associated with the intervention ranged from GBP 60,876 to IEP 95,125.

9325

(2 studies)

⊕⊝⊝⊝4,6
very low

Cost in GBP excludes hospital admissions; it is unclear whether cost in IEP includes or excludes hospital admissions.

Adverse events

We did not find any study reporting on adverse events.

CI: confidence interval; ED: emergency department; MD: mean difference; RR: risk ratio

GRADE Working Group grades of evidence
High certainty: We are very confident that the true effect lies close to that of the estimate of the effect.
Moderate certainty: We are moderately confident in the effect estimate: the true effect is likely to be close to the estimate of the effect, but there is a possibility that it is substantially different.
Low certainty: Our confidence in the effect estimate is limited: the true effect may be substantially different from the estimate of the effect.
Very low certainty: We have very little confidence in the effect estimate: the true effect is likely to be substantially different from the estimate of effect.

1We downgraded the evidence due to indirectness.
2We downgraded the evidence two points due to very serious imprecision (very wide confidence intervals including null‐effect and appreciable benefit or harm).
3We downgraded the evidence due to imprecision (wide confidence intervals including null‐effect and appreciable benefit or harm).
4We downgraded the evidence due to trial design (cross‐over of physicians in primary care sessions in Dale 1995 and predictable allocation of patients to either emergency physicians or general practitioners in Murphy 1996 and Gibney 1999).
5We downgraded the evidence due to inconsistency.
6We downgraded the evidence due to risk of bias.

Figuras y tablas -
Summary of findings for the main comparison. Primary care professionals compared with ordinary emergency department physicians for patients with minor injuries and illnesses who attend hospital emergency departments
Table 1. Results summary

Dale 1995

(N = 4641)

Murphy 1996

(N = 4684)

Gibney 1999

(N = 1878)

Laboratory investigations ordered

RR 0.22, 95% CI 0.14 to 0.33

RR 0.35, 95% CI 0.29 to 0.42

RR 0.96, 95% CI 0.76 to 1.2

X‐rays ordered

RR 0.47, 95% CI 0.41 to 0.54

RR 0.77, 95% CI 0.72 to 0.83

RR 1.07, 95% CI 0.99 to 1.15

Admissions

RR 0.33, 95% CI 0.19 to 0.58

RR 0.45, 95% CI 0.36 to 0.56

RR 1.11, 95% CI 0.70 to 1.76

Referrals to specialists

RR 0.50, 95% CI 0.39 to 0.63

RR 0.66, 95% CI 0.60 to 0.73

RR 1.21, 95% CI 1.09 to 1.33

Prescriptions

RR 0.95, 95% CI 0.88 to 1.03

RR 1.45, 95% CI 1.35 to 1.56

RR 1.12, 95% CI 1.01 to 1.23

CI: confidence interval; RR: risk ratio

Figuras y tablas -
Table 1. Results summary
Comparison 1. Comparions of general practitioners versus emergency physicians

Outcome or subgroup title

No. of studies

No. of participants

Statistical method

Effect size

1 Admission to hospital Show forest plot

3

Risk Ratio (M‐H, Random, 95% CI)

Totals not selected

2 Diagnostic tests: all investigations Show forest plot

2

Risk Ratio (M‐H, Random, 95% CI)

Totals not selected

3 Diagnostic tests: laboratory investigations Show forest plot

3

Risk Ratio (M‐H, Random, 95% CI)

Totals not selected

4 Diagnostic tests: imaging results Show forest plot

3

Risk Ratio (M‐H, Random, 95% CI)

Totals not selected

5 Treatments given: any prescription Show forest plot

3

Risk Ratio (M‐H, Random, 95% CI)

Totals not selected

6 Consultations or referrals to hospital‐based specialists Show forest plot

3

Risk Ratio (M‐H, Random, 95% CI)

Totals not selected

Figuras y tablas -
Comparison 1. Comparions of general practitioners versus emergency physicians