Profesionales de atención primaria que prestan servicios no urgentes en servicios hospitalarios de urgencia
Información
- DOI:
- https://doi.org/10.1002/14651858.CD002097.pub4Copiar DOI

- Base de datos:
-
- Cochrane Database of Systematic Reviews
- Versión publicada:
-
- 13 febrero 2018see what's new
- Tipo:
-
- Intervention
- Etapa:
-
- Review
- Grupo Editorial Cochrane:
-
Grupo Cochrane de Práctica y organización sanitaria efectivas
- Copyright:
-
- Copyright © 2018 The Cochrane Collaboration. Published by John Wiley & Sons, Ltd.
Cifras del artículo
Altmetric:
Citado por:
Autores
Contributions of authors
DGB and JKK screened references, extracted data, rated the certainty of the evidence and wrote the review. GF, RP, BHR, and SS provided feedback and contributed to the completion of the review.
Sources of support
Internal sources
-
Tier I Canada Research Chair in Evidence‐based Emergency Medicine through the Canadian Institutes of Health Research (CIHR) and the Government of Canada (Ottawa, ON), Canada.
Support provided to BHR to work on this review
External sources
-
National Institute of Health Research, UK.
Declarations of interest
DGB: none known
JKK: none known
GF: none known
RP: none known
BHR: none known
SS: none known
Acknowledgements
We thank Paul Miller (Information Specialist for the Cochrane Effective Practice and Organisation of Care Group (EPOC)), for his input on the search strategy and for running the searches; Julia Worswick (EPOC's Managing Editor) for her support and feedback during the editorial stages; Luciana Ballini (EPOC's Contact Editor) for her feedback; and Gerrard Abi‐Aad, Lucy Johnson, Nick Mays, and Emilie Roberts, who registered and wrote the original protocol in 2000.
National Institute for Health Research (NIHR), via Cochrane Infrastructure funding to the Cochrane Effective Practice and Organisation of Care Group. The views and opinions expressed therein are those of the authors and do not necessarily reflect those of the Systematic Reviews Programme, NIHR, National Health Service (NHS), or the Department of Health.
Version history
| Published | Title | Stage | Authors | Version |
| 2018 Feb 13 | Primary care professionals providing non‐urgent care in hospital emergency departments | Review | Daniela Gonçalves‐Bradley, Jaspreet K Khangura, Gerd Flodgren, Rafael Perera, Brian H Rowe, Sasha Shepperd | |
| 2012 Nov 14 | Primary care professionals providing non‐urgent care in hospital emergency departments | Review | Jaspreet K Khangura, Gerd Flodgren, Rafael Perera, Brian H Rowe, Sasha Shepperd | |
| 2011 Nov 09 | Primary and community health care professionals in hospital emergency departments: effects on process and outcome of care and resources | Protocol | Jaspreet K Khangura, Gerd Flodgren, Rafael Perera, Brian H Rowe, Sasha Shepperd | |
| 2000 Apr 24 | Primary and community health care professionals in hospital emergency departments: effects on process and outcome of care and resources | Protocol | Gerrard Abi‐Aad, Lucy Johnson, Nick Mays, Emilie Roberts | |
Differences between protocol and review
We edited the order and description of the objectives to reflect the original outcomes defined in the protocol (Abi‐Aad 2000). We included non‐randomised trials after discussion amongst the current author team. We added a 'Summary of findings' table and updated the Methods section to comply with current Methodological Expectations of Cochrane Intervention Reviews (MECIR) standards. Gerrard Abi‐Aad, Lucy Johnson, Nick Mays, and Emilie Roberts left the review author team, and Daniela C Gonçalves‐Bradley, Jaspreet K Khangura, Gerd Flodgren, Rafael Perera, Brian H Rowe, and Sasha Shepperd joined the review author team.
Keywords
MeSH
Medical Subject Headings (MeSH) Keywords
- Crowding;
- Emergencies [classification];
- Emergency Medicine [organization & administration, statistics & numerical data];
- Emergency Nursing [organization & administration];
- Emergency Service, Hospital [*organization & administration, statistics & numerical data];
- General Practice [*organization & administration, statistics & numerical data];
- Hematologic Tests [statistics & numerical data];
- Hospitalization [statistics & numerical data];
- Non‐Randomized Controlled Trials as Topic;
- Nurse Practitioners [organization & administration];
- Practice Patterns, Physicians' [statistics & numerical data];
- Primary Health Care [*organization & administration, statistics & numerical data];
- Radiography [statistics & numerical data];
- Randomized Controlled Trials as Topic;
- Referral and Consultation [statistics & numerical data];
- Triage;
Medical Subject Headings Check Words
Humans;
PICO
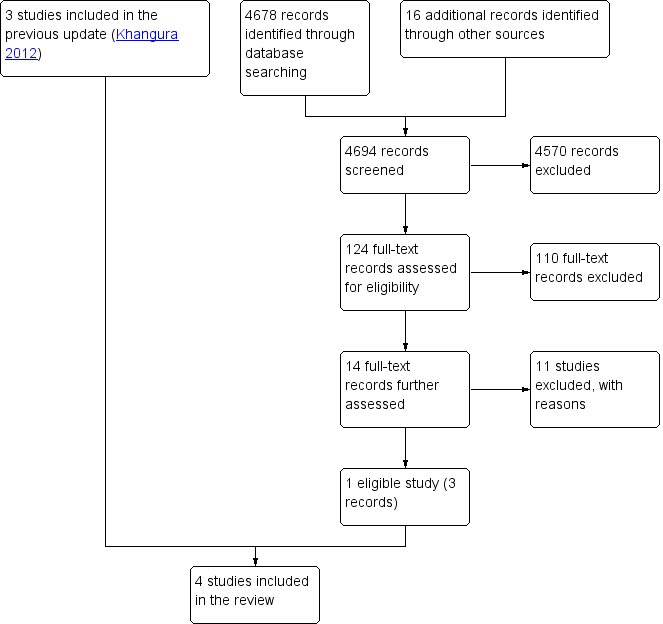
Study flow diagram.

Risk of bias graph: review authors' judgements about each risk of bias item presented as percentages across all included studies.

Risk of bias summary: review authors' judgements about each risk of bias item for each included study.
Forest plot of comparison: 1 Comparisons of general practitioners versus emergency physicians, outcome: 1.1 Admissions.

Forest plot of comparison: 1 Comparisons of general practitioners versus emergency physicians, outcome: 1.2 All investigations.

Forest plot of comparison: 1 Comparisons of general practitioners versus emergency physicians, outcome: 1.3 Laboratory investigations.
Forest plot of comparison: 1 Comparisons of general practitioners versus emergency physicians, outcome: 1.4 Imaging results.

Forest plot of comparison: 1 Comparisons of general practitioners versus emergency physicians, outcome: 1.5 Any prescription.

Forest plot of comparison: 1 Comparisons of general practitioners versus emergency physicians, outcome: 1.6 Referrals.

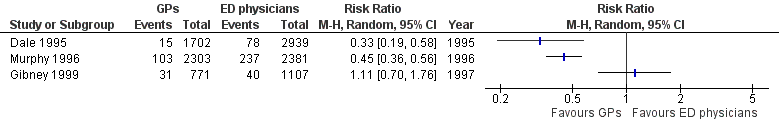
Comparison 1 Comparions of general practitioners versus emergency physicians, Outcome 1 Admission to hospital.
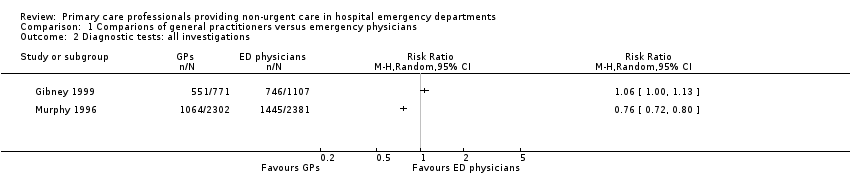
Comparison 1 Comparions of general practitioners versus emergency physicians, Outcome 2 Diagnostic tests: all investigations.

Comparison 1 Comparions of general practitioners versus emergency physicians, Outcome 3 Diagnostic tests: laboratory investigations.

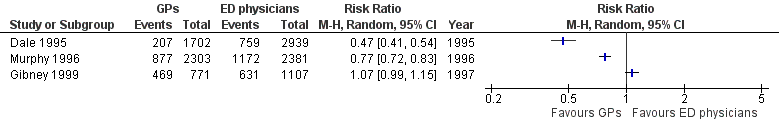
Comparison 1 Comparions of general practitioners versus emergency physicians, Outcome 4 Diagnostic tests: imaging results.

Comparison 1 Comparions of general practitioners versus emergency physicians, Outcome 5 Treatments given: any prescription.
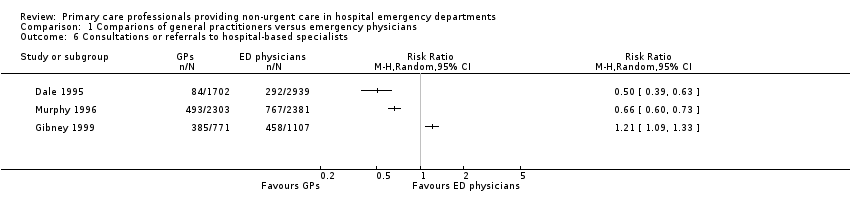
Comparison 1 Comparions of general practitioners versus emergency physicians, Outcome 6 Consultations or referrals to hospital‐based specialists.
| Primary care professionals compared with ordinary emergency department physicians for patients with minor injuries and illnesses who attend hospital emergency departments | ||||
| Patient or population: patients with minor injuries and illnesses Settings: hospital emergency departments (Ireland, UK, Australia) Intervention: primary care professionals Comparison: ordinary emergency department physicians | ||||
| Outcomes | Relative effect | No. of participants | Certainty of the evidence | Comments |
| Time from arrival to clinical assessment and treatment | MD 2.1 minutes (95% CI ‐4.9 to 9.2) | 260 (1 study) | ⊕⊝⊝⊝1,2 very low | Expressed in minutes Follow‐up not reported. |
| Total length of ED stay | MD ‐3.2 minutes (95% CI ‐20.2 to 13.8) | 260 (1 study) | ⊕⊝⊝⊝1,2 very low | Expressed in minutes Follow‐up not reported. |
| Admission to hospital | RR ranged from 0.33 to 1.11 | 11,203 | ⊕⊝⊝⊝ | Percentage of patients admitted to hospital from ED |
| Diagnostic tests | RR ranged from 0.35 to 0.96 (laboratory investigations) RR ranged from 0.47 to 1.07 (imaging results) | 11,203 | ⊕⊝⊝⊝ | Percentage of patients for whom any blood investigation or imaging results were ordered |
| Treatments given | RR ranged from 0.95 to 1.45 (any prescription) | 11,203 | ⊕⊝⊝⊝ | Percentage of patients given medication or prescription |
| Consultations or referrals to hospital‐based specialists | RR ranged from 0.5 to 1.21 | 11,203 | ⊕⊝⊝⊝ | Percentage of patients referred to consultants In Dale 1995, patients referred to on‐call teams were excluded. |
| Costs | Cost reduction associated with the intervention ranged from GBP 60,876 to IEP 95,125. | 9325 (2 studies) | ⊕⊝⊝⊝4,6 | Cost in GBP excludes hospital admissions; it is unclear whether cost in IEP includes or excludes hospital admissions. |
| Adverse events | ‐ | ‐ | ‐ | We did not find any study reporting on adverse events. |
| CI: confidence interval; ED: emergency department; MD: mean difference; RR: risk ratio GRADE Working Group grades of evidence | ||||
| 1We downgraded the evidence due to indirectness. | ||||
| (N = 4641) | (N = 4684) | (N = 1878) | |
| Laboratory investigations ordered | RR 0.22, 95% CI 0.14 to 0.33 | RR 0.35, 95% CI 0.29 to 0.42 | RR 0.96, 95% CI 0.76 to 1.2 |
| X‐rays ordered | RR 0.47, 95% CI 0.41 to 0.54 | RR 0.77, 95% CI 0.72 to 0.83 | RR 1.07, 95% CI 0.99 to 1.15 |
| Admissions | RR 0.33, 95% CI 0.19 to 0.58 | RR 0.45, 95% CI 0.36 to 0.56 | RR 1.11, 95% CI 0.70 to 1.76 |
| Referrals to specialists | RR 0.50, 95% CI 0.39 to 0.63 | RR 0.66, 95% CI 0.60 to 0.73 | RR 1.21, 95% CI 1.09 to 1.33 |
| Prescriptions | RR 0.95, 95% CI 0.88 to 1.03 | RR 1.45, 95% CI 1.35 to 1.56 | RR 1.12, 95% CI 1.01 to 1.23 |
| CI: confidence interval; RR: risk ratio | |||
| Outcome or subgroup title | No. of studies | No. of participants | Statistical method | Effect size |
| 1 Admission to hospital Show forest plot | 3 | Risk Ratio (M‐H, Random, 95% CI) | Totals not selected | |
| 2 Diagnostic tests: all investigations Show forest plot | 2 | Risk Ratio (M‐H, Random, 95% CI) | Totals not selected | |
| 3 Diagnostic tests: laboratory investigations Show forest plot | 3 | Risk Ratio (M‐H, Random, 95% CI) | Totals not selected | |
| 4 Diagnostic tests: imaging results Show forest plot | 3 | Risk Ratio (M‐H, Random, 95% CI) | Totals not selected | |
| 5 Treatments given: any prescription Show forest plot | 3 | Risk Ratio (M‐H, Random, 95% CI) | Totals not selected | |
| 6 Consultations or referrals to hospital‐based specialists Show forest plot | 3 | Risk Ratio (M‐H, Random, 95% CI) | Totals not selected | |