Behavioural treatment for chronic low‐back pain
Abstract
Background
Behavioural treatment is commonly used in the management of chronic low‐back pain (CLBP) to reduce disability through modification of maladaptive pain behaviours and cognitive processes. Three behavioural approaches are generally distinguished: operant, cognitive, and respondent; but are often combined as a treatment package.
Objectives
To determine the effects of behavioural therapy for CLBP and the most effective behavioural approach.
Search methods
The Cochrane Back Review Group Trials Register, CENTRAL, MEDLINE, EMBASE, and PsycINFO were searched up to February 2009. Reference lists and citations of identified trials and relevant systematic reviews were screened.
Selection criteria
Randomised trials on behavioural treatments for non‐specific CLBP were included.
Data collection and analysis
Two review authors independently assessed the risk of bias in each study and extracted the data. If sufficient homogeneity existed among studies in the pre‐defined comparisons, a meta‐analysis was performed. We determined the quality of the evidence for each comparison with the GRADE approach.
Main results
We included 30 randomised trials (3438 participants) in this review, up 11 from the previous version. Fourteen trials (47%) had low risk of bias. For most comparisons, there was only low or very low quality evidence to support the results. There was moderate quality evidence that:
i) operant therapy was more effective than waiting list (SMD ‐0.43; 95%CI ‐0.75 to ‐0.11) for short‐term pain relief;
ii) little or no difference exists between operant, cognitive, or combined behavioural therapy for short‐ to intermediate‐term pain relief;
iii) behavioural treatment was more effective than usual care for short‐term pain relief (MD ‐5.18; 95%CI ‐9.79 to ‐0.57), but there were no differences in the intermediate‐ to long‐term, or on functional status;
iv) there was little or no difference between behavioural treatment and group exercise for pain relief or depressive symptoms over the intermediate‐ to long‐term;
v) adding behavioural therapy to inpatient rehabilitation was no more effective than inpatient rehabilitation alone.
Authors' conclusions
For patients with CLBP, there is moderate quality evidence that in the short‐term, operant therapy is more effective than waiting list and behavioural therapy is more effective than usual care for pain relief, but no specific type of behavioural therapy is more effective than another. In the intermediate‐ to long‐term, there is little or no difference between behavioural therapy and group exercises for pain or depressive symptoms. Further research is likely to have an important impact on our confidence in the estimates of effect and may change the estimates.
PICO
Plain language summary
Behavioural treatment for chronic low‐back pain
Low‐back pain is a major health and economical problem that affects populations around the world. Chronic low‐back pain, in particular, is a major cause of medical expenses, work absenteeism, and disability. Current management of chronic low‐back pain includes a range of different treatments such as medication, exercise, and behavioural therapy. Research has shown that social roles and psychological factors have a role in the course of chronic low‐back pain.
This review of 30 studies (3438 participants) evaluated three behavioural therapies for chronic low‐back pain: (i) operant (which acknowledges that external factors associated with pain can reinforce it), (ii) cognitive (dealing with thoughts, feelings, beliefs, or a combination of the three, that trigger the pain), (iii) respondent (interrupts muscle tension with progressive relaxation techniques or biofeedback of muscle activity).
For pain relief, there was moderate quality evidence that:
(i) operant therapy was more effective than waiting list controls in the short‐term,
(ii) there was little or no difference between operant therapy, cognitive therapy; or a combination of behavioural therapies in the short‐ or intermediate‐term, and
(iii) behavioural treatment was more effective than usual care (which usually consists of physical therapy, back school and/or medical treatments) in the short‐term.
Over a longer term, there was little or no difference between behavioural treatment and group exercise for pain relief or reduced depressive symptoms. The addition of behavioural therapy to inpatient rehabilitation did not appear to increase the effect of inpatient rehabilitation alone.
For most of the other comparisons, there was only low or very low quality evidence, which was based on the results of only two or three small trials. There were only a few studies which provided information on the effect of behavioural treatment on functional disability or return to work.
Further research is very likely to have an important impact on the results and our confidence in them.
Authors' conclusions
Summary of findings
| Behavioural treatment compared with waiting list control for chronic low‐back pain | |||||
| Patient or population: adults with chronic low‐back pain Settings: primary and secondary health care centres Intervention: behavioural treatment (respondent, cognitive, and operant therapy, or a combination) Comparison: waiting list control | |||||
| Outcomes | Illustrative means (95% CI) | No of Participants | Quality of the evidence | Comments | |
| Control group | Intervention group | ||||
| Waiting list control | Respondent therapy (progressive relaxation) | ||||
| Pain intensity VAS scale (0‐100) short‐term follow‐up | The mean pain intensity ranged across control groups from | The mean pain intensity in the intervention groups was 19.77 points lower (34.34 to 5.2 lower) | 74 | ++OO | |
| Functional status (generic) various scales short‐term follow‐up | The mean generic functional status in the intervention groups was 0.88 standard deviations lower (1.36 to 0.39 lower) | 74 | ++OO | SMD ‐0.88 (‐1.36 to ‐0.39) | |
| Depression Beck Depression Inventory (0‐63) short‐term follow‐up | The mean depression ranged across control groups from | The mean depression in the intervention groups was 6.8 points lower (19.73 lower to 6.12 higher) | 58 | +OOO | |
| Waiting list control | Respondent therapy (EMG biofeedback) | ||||
| Pain intensity various scales short‐term follow‐up | The mean pain intensity in the intervention groups was 0.8 standard deviations lower (1.32 to 0.28 lower) | 64 | ++OO | SMD ‐0.8 (‐1.32 to ‐0.28) | |
| Functional status (generic) various scales short‐term follow‐up | The mean functional status in the intervention groups was 0.17 standard deviations lower (1.56 lower to 1.22 higher) | 44 | +OOO | SMD ‐0.17 (‐1.56 to 1.22) | |
| Waiting list control | Operant therapy | ||||
| Pain intensity various scales short‐term follow‐up | The mean pain intensity in the intervention groups was 0.43 standard deviations lower (0.75 to 0.11 lower) | 153 | +++O | SMD ‐0.43 (‐0.75 to ‐0.11) | |
| Functional status (generic) Sickness Impact Profile (0‐136) short‐term follow‐up | The mean generic functional status ranged across control groups from | The mean functional status in the intervention groups was 1.18 points lower (3.53 lower to 1.18 higher) | 87 | ++OO | |
| Depression various scales short‐term follow‐up | The mean depression in the intervention groups was 0.11 standard deviations lower (0.67 lower to 0.44 higher) | 103 | ++OO | SMD ‐0.11 (‐0.67 to 0.44) | |
| Waiting list control | Cognitive therapy | ||||
| Pain intensity various scales short‐term follow‐up | The mean pain intensity in the intervention groups was 0.27 standard deviations lower (0.75 lower to 0.22 higher) | 68 | ++OO | SMD ‐0.27 (‐0.75 to 0.22) | |
| Functional status (generic) various scales short‐term follow‐up | The mean functional status in the intervention groups was 0.15 standard deviations lower (0.64 lower to 0.33 higher) | 68 | ++OO | SMD ‐0.15 (‐0.64 to 0.33) | |
| Waiting list control | Combined behavioural therapy | ||||
| Pain intensity various scales short‐term follow‐up | The mean pain intensity in the intervention groups was 0.60 standard deviations lower (0.97 to 0.22 lower) | 239 | ++OO | SMD ‐0.60 (‐0.97 to ‐0.22) | |
| Functional status (generic) various scales short‐term follow‐up | The mean functional status in the intervention groups was 0.37 standard deviations lower (0.87 lower to 0.13 higher) | 134 | ++OO | SMD ‐0.37 (‐0.87 to 0.13) | |
| Depression Beck Depression Inventory (0‐63) short‐term follow‐up | The mean depression ranged across control groups from | The mean depression in the intervention groups was 1.92 points lower (6.16 lower to 2.32 higher) | 194 | +OOO | |
| CI: Confidence interval | |||||
| GRADE Working Group grades of evidence | |||||
| 1 Serious limitations in study design (i.e. >25% of participants from studies with high risk of bias) 2 Serious inconsistency of results (i.e. opposite direction of effects and/or significant statistical heterogeneity) 3 Serious imprecision (i.e. total number of participants <300 for each outcome) | |||||
| Comparisons among behavioural treatments for chronic low‐back pain | |||||
| Patient or population: adults with chronic low‐back pain Settings: primary and secondary health care centres Intervention: behavioural treatments (respondent, cognitive, and operant therapy, or a combination) Comparison: behavioural treatments (respondent, cognitive, and operant therapy, or a combination) | |||||
| Outcomes | Illustrative means (95% CI) | No of Participants | Quality of the evidence | Comments | |
| Control group | Intervention group | ||||
| Operant therapy | Cognitive therapy | ||||
| Pain intensity various scales short‐term follow‐up | The mean pain intensity in the intervention groups was 0.41 standard deviations higher (0.63 lower to 1.45 higher) | 93 | +++O | SMD 0.41 (‐0.63 to 1.45) | |
| Pain intensity various scales intermediate‐term follow‐up | The mean pain intensity in the intervention groups was 0.35 standard deviations higher (0.64 lower to 1.35 higher) | 82 | +++O | SMD 0.35 (‐0.64 to 1.35) | |
| Cognitive therapy | Combined behavioural therapy | ||||
| Pain intensity various scales short‐term follow‐up | The mean pain intensity in the intervention groups was 0.24 standard deviations lower (1.36 lower to 0.87 higher) | 61 | +OOO | SMD ‐0.24 (‐1.36 to 0.87) | |
| Pain intensity various scales intermediate‐term follow‐up | The mean pain intensity in the intervention groups was 0.3 standard deviations lower (2.59 lower to 1.98 higher) | 44 | +OOO | SMD ‐0.3 (‐2.59 to 1.98) | |
| Pain intensity various scales long‐term follow‐up | The mean pain intensity in the intervention groups was 0.89 standard deviations lower (3.64 lower to 1.87 higher) | 48 | +OOO | SMD ‐0.89 (‐3.64 to 1.87) | |
| Functional status (generic) Sickness Impact Profile (0‐136) short‐term follow‐up | The mean generic functional status ranged across control groups from | The mean functional status in the intervention groups was 2.01 points lower (10.02 lower to 5.99 higher) | 61 | ++OO | |
| Functional status (generic) Sickness Impact Profile (0‐136) intermediate‐term follow‐up | The mean generic functional status ranged across control groups from | The mean functional status in the intervention groups was 3.2 points lower (16.44 lower to 10.04 higher) | 47 | +OOO | |
| Functional status (generic) Sickness Impact Profile (0‐136) long‐term follow‐up | The mean generic functional status ranged across control groups from | The mean functional status in the intervention groups was 2.23 points lower (12.59 lower to 8.13 higher) | 51 | +OOO | |
| Depression Beck Depression Inventory (0‐63) short‐term follow‐up | The mean depression ranged across control groups from | The mean depression in the intervention groups was 3.1 points lower (11.43 lower to 5.23 higher) | 61 | +OOO | |
| Depression Beck Depression Inventory (0‐63) intermediate‐term follow‐up | The mean depression ranged across control groups from | The mean depression in the intervention groups was 4.66 points lower (10.94 lower to 1.61 higher) | 47 | ++OO | |
| Depression Beck Depression Inventory (0‐63) long‐term follow‐up | The mean depression ranged across control groups from | The mean depression in the intervention groups was 0.64 points lower (4.61 lower to 3.32 higher) | 51 | ++OO | |
| Operant therapy | Combined behavioural therapy | ||||
| Pain intensity various scales short‐term follow‐up | The mean pain intensity in the intervention groups was 0.15 standard deviations lower (0.46 lower to 0.16 higher) | 161 | +++O | SMD ‐0.15 (‐0.46 to 0.16) | |
| Pain intensity various scales intermediate‐term follow‐up | The mean pain intensity in the intervention groups was 0.23 standard deviations lower (0.57 lower to 0.11 higher) | 139 | +++O | SMD ‐0.23 (‐0.57 to 0.11) | |
| Pain intensity various scales long‐term follow‐up | The mean pain intensity in the intervention groups was 0.31 standard deviations lower (0.65 lower to 0.03 higher) | 140 | +++O | SMD ‐0.31 (‐0.65 to 0.03) | |
| Functional status (generic) various scales short‐term follow‐up | The mean functional status in the intervention groups was 0.21 standard deviations higher (0.24 lower to 0.67 higher) | 77 | ++OO | SMD 0.21 (‐0.24 to 0.67) | |
| Functional status (generic) various scales intermediate‐term follow‐up | The mean functional status in the intervention groups was 0.23 standard deviations lower (1.01 lower to 0.55 higher) | 61 | ++OO | SMD ‐0.23 (‐1.01 to 0.55) | |
| Functional status (generic) various scales long‐term follow‐up | The mean functional status in the intervention groups was 0.50 standard deviations lower (1.56 lower to 0.56 higher) | 66 | ++OO | SMD ‐0.50 (‐1.56 to 0.56) | |
| Respondent therapy | Combined behavioural therapy | ||||
| Pain intensity various scales short‐term follow‐up | The mean pain intensity in the intervention groups was 0.09 standard deviations higher (0.31 lower to 0.5 higher) | 97 | ++OO | SMD 0.09 (‐0.31 to 0.5) | |
| Pain intensity various scales intermediate‐term follow‐up | The mean pain intensity in the intervention groups was 0.47 standard deviations higher (0.42 lower to 1.35 higher) | 62 | ++OO | SMD 0.47 (‐0.42 to 1.35) | |
| Functional status (generic) various scales short‐term follow‐up | The mean functional status in the intervention groups was 0.38 standard deviations higher (0.02 lower to 0.78 higher) | 97 | ++OO | SMD 0.38 (‐0.02 to 0.78) | |
| Functional status (generic) various scales intermediate‐term follow‐up | The mean functional status in the intervention groups was 0.13 standard deviations higher (0.81 lower to 1.07 higher) | 62 | ++OO | SMD 0.13 (‐0.81 to 1.07) | |
| Depression Beck Depression Inventory (0‐63) short‐term follow‐up | The mean depression ranged across control groups from | The mean depression in the intervention groups was 2.89 points higher (0.55 to 5.24 higher) | 97 | ++OO | |
| Depression Beck Depression Inventory (0‐63) intermediate‐term follow‐up | The mean depression ranged across control groups from | The mean depression in the intervention groups was 1.84 points lower (0.43 lower to 4.11 higher) | 62 | ++OO | |
| CI: Confidence interval | |||||
| GRADE Working Group grades of evidence | |||||
| 1 Serious limitations in study design (i.e. >25% of participants from studies with high risk of bias) 2 Serious inconsistency of results (i.e. opposite direction of effects and/or significant statistical heterogeneity) 3 Serious imprecision (i.e. total number of participants <300 for each outcome) | |||||
| Behavioural treatment compared with other treatments for chronic low‐back pain | |||||
| Patient or population: adults with chronic low‐back pain Settings: primary or secondary health care settings Intervention: behavioural treatment (respondent, cognitive, and operant therapy, or a combination) Comparison: other chronic low‐back pain treatments (i.e. usual care, exercise, surgery) | |||||
| Outcomes | Illustrative means (95% CI) | No of Participants | Quality of the evidence | Comments | |
| Control group | Intervention group | ||||
| Usual care | Behavioural treatment | ||||
| Pain intensity VAS (0‐100) short‐term follow‐up | The mean pain intensity ranged across control groups from | The mean pain intensity in the intervention groups was 5.18 points lower (9.79 to 0.57 lower) | 330 | +++O | |
| Pain intensity VAS (0‐100) intermediate‐term follow‐up | The mean pain intensity ranged across control groups from | The mean pain intensity in the intervention groups was 4.29 points lower (9.28 lower to 0.69 higher) | 319 | +++O | |
| Functional status (back‐specific) various scales short‐term follow‐up | The mean back‐specific functional status in the intervention groups was 0.2 standard deviations lower (0.41 lower to 0.02 higher) | 330 | +++O | SMD ‐0.2 (‐0.41 to 0.02) | |
| Functional status (back‐specific) various scales intermediate‐term follow‐up | The mean back‐specific functional status in the intervention groups was 0.12 standard deviations lower (0.34 lower to 0.1 higher) | 319 | +++O | SMD ‐0.12 (‐0.34 to 0.1) | |
| Exercise | Behavioural treatment | ||||
| Pain intensity Pain Rating Index (0‐45) short‐term follow‐up | The mean pain intensity ranged across control groups from | The mean pain intensity in the intervention groups was 2.31 points lower (6.33 lower to 1.7 higher) | 146 | ++OO | |
| Pain intensity Pain Rating Index (0‐45) intermediate‐term follow‐up | The mean pain intensity ranged across control groups from | The mean pain intensity in the intervention groups was 1.18 points higher (3.16 lower to 5.53 higher) | 137 | +++O | |
| Pain intensity Pain Rating Index (0‐45) long‐term follow‐up | The mean pain intensity ranged across control groups from | The mean pain intensity in the intervention groups was 0.14 points higher (4.4 lower to 4.67 higher) | 136 | +++O | |
| Depression various scales short‐term follow‐up | The mean depression in the intervention groups was 0.25 standard deviations higher (0.07 lower to 0.58 higher) | 146 | ++OO | SMD 0.25 (‐0.07 to 0.58) | |
| Depression various scales intermediate‐term follow‐up | The mean depression in the intervention groups was 0.02 standard deviations higher (0.32 lower to 0.35 higher) | 137 | +++O | SMD 0.02 (‐0.32 to 0.35) | |
| Depression various scales long‐term follow‐up | The mean depression in the intervention groups was 0.07 standard deviations higher (0.27 lower to 0.41 higher) | 136 | +++O | SMD 0.07 (‐0.27 to 0.41) | |
| Surgery | Behavioural treatment | ||||
| Functional status (back specific) Oswestry Disability Index (0‐100) long‐term follow‐up | The mean back‐specific functional status ranged across control groups from | The mean back‐specific functional status in the intervention groups was 2.36 points higher (1.94 lower to 6.66 higher) | 345 | ++OO | |
| CI: Confidence interval | |||||
| GRADE Working Group grades of evidence | |||||
| 1 Serious limitations in study design (i.e. >25% of participants from studies with high risk of bias) 2 Serious inconsistency of results (i.e. opposite direction of effects and/or significant statistical heterogeneity) 3 Serious imprecision (i.e. total number of participants <300 for each outcome) 4 Serious indirectness (i.e. not directly applicable to all patients with chronic low‐back pain) | |||||
| Behavioural treatment in addition to other treatments for chronic low‐back pain | |||||
| Patient or population: adults with chronic low‐back pain Settings: primary, secondary, or tertiary health care settings Intervention: behavioural treatment (respondent, cognitive, and operant therapy, or a combination) in addition to another treatment Comparison: the other treatment alone | |||||
| Outcomes | Illustrative means (95% CI) | No of Participants | Quality of the evidence | Comments | |
| Control group | Intervention group | ||||
| Physiotherapy | Behavioural treatment + physiotherapy | ||||
| Pain intensity 5‐point scale short‐term follow‐up | The mean pain intensity ranged across control groups from | The mean pain intensity in the intervention groups was 0.13 points lower (1.01 lower to 0.75 higher) | 59 | ++OO | |
| Pain intensity 5‐point scale intermediate‐term follow‐up | The mean pain intensity ranged across control groups from | The mean pain intensity in the intervention groups was 0.11 points lower (0.67 lower to 0.44 higher) | 45 | ++OO | |
| Depression Beck Depression Inventory (0‐63) short‐term follow‐up | The mean depression ranged across control groups from | The mean depression in the intervention groups was 1.56 points higher (1.71 lower to 4.83 higher) | 59 | ++OO | |
| Depression Beck Depression Inventory (0‐63) intermediate‐term follow‐up | The mean depression ranged across control groups from | The mean depression in the intervention groups was 0.17 points higher (6.85 lower to 7.19 higher) | 50 | ++OO | |
| Functional status (generic) Sickness Impact Profile (0‐136) short‐term follow‐up | The mean generic functional status ranged across control groups from | The mean generic functional status in the intervention groups was 6.26 points lower (12.71 to 0.19 lower) | 59 | ++OO | |
| Functional status (generic) Sickness Impact Profile (0‐136) intermediate‐term follow‐up | The mean generic functional status ranged across control groups from | The mean generic functional status in the intervention groups was 0.93 points lower (6.71 lower to 4.84 higher) | 51 | ++OO | |
| Inpatient rehabilitation | Behavioural treatment + inpatient rehabilitation | ||||
| Pain intensity various scales short‐term follow‐up | The mean pain intensity in the intervention groups was 0.14 standard deviations lower (0.34 lower to 0.05 higher) | 405 | +++O | SMD ‐0.14 (‐0.34 to 0.05) | |
| CI: Confidence interval | |||||
| GRADE Working Group grades of evidence | |||||
| 1 Serious limitations in study design (i.e. >25% of participants from studies with high risk of bias) 2 Serious imprecision (i.e. total number of participants <300 for each outcome) | |||||
Background
Low‐back pain is a major health and economical problem which affects large populations around the world. In particular, chronic low‐back pain (CLBP) is a major cause of medical expenses, work absenteeism, and disability (Koes 2006). Current management of CLBP includes a range of different intervention strategies such as medication, exercise, and behavioural therapy. The main assumption underlying a behavioural therapy approach is that pain and its resulting disability are not only influenced by somatic pathology, but by psychological and social factors as well. In this way, CLBP is not only a physical problem, but may also be influenced by the patient's attitudes and beliefs, psychologic distress, and illness behaviour (Waddell 2004). Consequently, the goal of behavioural treatment is to alter maladaptive thoughts, feelings and behaviours as well as dysfunctional sensory phenomena, and thereby the experience of pain. In general, three behavioural treatment approaches can be distinguished: operant, cognitive, and respondent (Turk 1984; Vlaeyen 1995). Each of these focuses on modifying one of the three response systems which characterize emotional experiences: behaviour, cognition, and physiological reactivity.
Operant treatments are based on the operant conditioning principles of Skinner (Skinner 1953) which have been applied to CLBP by Fordyce (Fordyce 1976). This model proposes that acute pain behaviours may be reinforced by external factors (such as attention of the spouse and the medical personnel, rest, or reduction of pain level by analgesic medication) and thus develop into a chronic pain problem. Therefore, operant treatment involves the removal of positive reinforcement of pain behaviours and the promotion of healthy behaviours (e.g. exercise, work). It often incorporates involvement of the spouse to help maintain these changes. Increased activity levels are promoted by establishing exercise quota and reinforcing exercise with positive feedback and verbal encouragement. The exercise quota are systematically increased for each treatment session, towards a pre‐defined goal. Each successfully performed increment is positively reinforced by all treatment staff (Fordyce 1976).
Cognitive treatment aims to identify and modify harmful cognitions which patients may have regarding their pain and disability. Patients with CLBP often have maladaptive thoughts, feelings, and beliefs, which have an important role in their experience of low‐back pain (Pincus 2006). It is proposed that beliefs about the meaning of pain and expectations regarding control over pain can be directly modified using cognitive restructuring techniques such as imagery and attention diversion (Turner 1993). Cognitions can also be indirectly altered through education and other treatments, so cognitive therapy is often used as part of a 'package' approach of behavioural treatment.
Respondent treatment aims to modify the physiological response system to pain, through reduction of muscular tension. The theoretical basis of this approach is the assumption of a pain‐tension cycle, where pain is viewed as both a cause and a result of muscular tension. Respondent treatment attempts to interrupt this cycle by using a tension‐incompatible reaction, such as relaxation. Electromyographic (EMG) biofeedback, progressive relaxation, and applied relaxation are frequently used to reduce the assumed muscular tension, relieve anxiety, and subsequently pain (Turk 1984; Vlaeyen 1995).
Behavioural treatments are often applied together, as part of a combined treatment approach, commonly referred to as cognitive‐behavioural treatment. This combined behavioural treatment is based on a multidimensional model of pain that includes physical, affective, cognitive, and behavioural components. Treatment may therefore include education about a multidimensional view of pain, how to identify pain‐eliciting and pain‐aggravating situations, thoughts and behaviour, and use of coping strategies and applied relaxation. Goal setting and activity increase is encouraged, as the basis of a combined treatment approach is to reduce feelings of helplessness and assist the patient to gain control over the pain experience (Turk 1984; Rudy 1995). Furthermore, combined behavioural treatments are often applied in addition to other therapies such as physiotherapy, medication, or exercise.
Previous reviews have summarized the literature concerning behavioural therapy for chronic pain (Morley 1999) and CLBP (Pincus 2006; Hoffman 2007). Two previous versions of the current review have been published (van Tulder 2000; Ostelo 2005), systematically evaluating the effectiveness of behavioural therapy for CLBP, using the methods of The Cochrane Collaboration. In this second update, the most recent literature is included and the methods of data collection and analysis have been updated (Furlan 2009; Higgins 2009).
Objectives
The objective of this systematic review is to determine whether behavioural therapy is more effective than other treatments for non‐specific CLBP, and to ascertain which type of behavioural therapy is most effective.
The following comparisons were investigated:
1. behavioural treatment versus placebo, no treatment, or waiting list controls
2. between different types of behavioural treatment
3. behavioural treatment versus other kinds of treatment
4. behavioural treatment in addition to another treatment (e.g. physiotherapy) versus the other treatment alone.
Methods
Criteria for considering studies for this review
Types of studies
Only randomised controlled trials (RCTs) were included.
Types of participants
RCTs that investigated male and female subjects with non‐specific CLBP, between 18 and 65 years of age, were included. CLBP was defined as back pain that had persisted for 12 weeks or more. If an RCT recruited LBP patients with a mixed duration of symptoms (i.e. including patients with < 12 weeks duration), it was only considered eligible if data for the CLBP patients were presented separately. Trials were excluded if they included subjects with specific low‐back pain caused by pathological entities such as infection, neoplasm, metastasis, osteoporosis, rheumatoid arthritis, or fractures.
Types of interventions
RCTs that evaluated one or more types of behavioural treatment, that is, treatment based on the behavioural therapy principles outlined in the introduction, were included. As there exists some variability in the delivery and content of behavioural interventions, only RCTs in which the interventions were explicitly stated to follow the behavioural principles were considered eligible. Where this was not explicit and there remained uncertainty regarding the eligibility of an RCT (based on the intervention provided), a consensus was sought from the review co‐authors. For examples of good descriptions of treatments following these behavioural principles, studies by Fordyce 1976 and Roberts 1986 for operant treatments, Vlaeyen 1991 for cognitive treatments, and Belar 1986 for respondent treatments were used as a point of reference. Where a combination of behavioural therapy components were evaluated as part of a treatment 'package' (e.g. cognitive‐behavioural treatment), it was considered as a single intervention in the analyses. Because of the considerable overlap in the definitions of behavioural components and delivery of the interventions, it is difficult to disaggregate the effects of separate components in these combined treatments.
Types of outcome measures
RCTs were included that measured at least one of the outcome measures that the Cochrane Back Review Group and review authors considered to be important, i.e. overall improvement (either self‐reported or observed), back pain‐specific functional status (e.g. Roland‐Morris Questionnaire, Oswestry Disability Index), generic functional status (e.g. Sickness Impact Profile), return‐to‐work (e.g. expressed as the number of days of sick leave or the proportion of patients returned to work), and pain intensity (e.g. expressed on a visual analogue (VAS) or numerical rating scale (NRS)) (Furlan 2009). In the behavioural domain, any type of behavioural outcome was considered relevant (e.g. observed pain behaviours, cognitive errors, perceived or observed levels of tension, anxiety, and depression).
Search methods for identification of studies
All relevant RCTs meeting our inclusion criteria were identified by:
-
a computer‐aided search of the Cochrane Back Review Group Trials Register (February 2009), CENTRAL (The Cochrane Library 2009, issue 2), MEDLINE (1966 to February 2009), EMBASE (1988 to February 2009), and PsycINFO (1974 to February 2009) databases, using the search strategy recommended by the Cochrane Back Review Group (Furlan 2009). A highly sensitive search strategy for retrieval of controlled trials was run in conjunction with a specific search for low‐back pain and behavioural treatment. RCTs published in any language were considered (Appendix 2).
-
screening references from relevant identified publications and reviews
-
citation tracking of the RCTs identified by these first two steps, using Science Citation Index.
Data collection and analysis
The most recent version of the Cochrane review on this topic (Ostelo 2005) included 21 RCTs which were screened using the eligibility criteria of this update. The methods of data collection and analysis were updated to align with recent recommendations from the Cochrane Handbook (Higgins 2009) and the Cochrane Back Review Group (Furlan 2009).
Study selection
Two review authors (NH and RO) independently selected the trials to be included in this update of the systematic review. A consensus meeting was held to resolve disagreements concerning the inclusion of RCTs and co‐authors were consulted if disagreements persisted.
Risk of bias assessment
The risk of bias of each included trial was independently assessed by two review authors (NH and RO), using the 12 criteria (Appendix 1) recommended by the Cochrane Back Review Group (Furlan 2009). This updated list contains two new assessment items (selective reporting and timing of outcomes) from the list used previously (Ostelo 2005). The articles were not blinded for authors, institution and journal, because the review authors who performed the risk of bias assessments were familiar with the literature. A consensus method was used to resolve disagreements and a third review author was consulted if disagreements persisted. A total score was computed by adding the number of positive scores, and a low risk of bias was defined as studies fulfilling six or more of the 12 internal validity criteria. Empirical evidence seems to suggest that studies fulfilling fewer than six items report higher treatment effects than studies fulfilling six or more items (van Tulder 2009).
Clinical relevance
The clinical relevance of each included trial was also assessed by two review authors (NH and RO). A list of five questions has been recommended to facilitate decisions about the applicability of the results to other populations (Furlan 2009; Malmivaara 2006):
1. Are the patients described in detail so that you can decide whether they are comparable to those that you see in your practice?
2. Are the interventions and treatment settings described well enough so that you can provide the same for your patients?
3. Were all clinically relevant outcomes measured and reported?
4. Is the size of the effect clinically important?
5. Are the likely treatment benefits worth the potential adverse effects?
Data extraction
A standardized form was used to collect descriptive data on the study populations and the types of intervention, as well as quantitative data from the outcome measures. Two review authors (NH and RO) independently extracted the data, considering the following domains: i) behavioural outcomes, ii) overall improvement, iii) back‐pain specific functional status, iv) generic functional status, v) return‐to‐work, and vi) pain intensity. Measures of effect and estimates of variability were extracted in the form of follow‐up (post‐intervention) measurements or change scores from baseline in all intervention and control groups. Where possible, only follow‐up measures were entered in the meta‐analyses.
Data analysis and the GRADE approach
If studies were clinically homogeneous regarding study population, types of treatment, outcomes and measurement instruments, a meta‐analysis was performed. If possible, the mean difference (MD) was calculated, because this improves the interpretability of the results. If an MD was not possible, the standardized mean difference (SMD) was calculated. If trials reported outcomes as graphs, the mean scores and standard deviations were estimated from these graphs. If standard deviations (SD) for outcomes were not reported, they were calculated using the reported values of the confidence intervals, if possible. If an RCT evaluated multiple groups which were relevant for a comparison in the meta‐analysis, all relevant experimental intervention groups of the study were combined to create a single group and all relevant control groups were combined to create a single control group (Higgins 2008).
GRADE (Grades of Recommendation, Assessment, Development and Evaluation) profiles were used to evaluate the overall quality of the evidence and the strength of the recommendations (Atkins 2004). Using this approach, as recommended in the recent update of The Cochrane Handbook (Higgins 2009), and the Cochrane Back Review Group method guidelines (Furlan 2009), the overall quality of evidence for a particular outcome is considered to be high when multiple RCTs with a low risk of bias provide consistent, generalisable, and precise data. The quality of the evidence was downgraded by one level for each of the five factors that was encountered: 1) limitations in design (i.e. >25% of participants from studies with high risk of bias), 2) inconsistency of results (i.e. opposite direction of effects and/or significant statistical heterogeneity), 3) indirectness (e.g. patients selected based on MRI results, surgical candidates), 4) imprecision (i.e. total number of participants <300 for each outcome), and 5) other considerations (e.g. reporting bias). The judgment of whether these factors were present for each outcome was made by two review authors (NH and RO) using the descriptions shown in brackets above. Single studies were considered inconsistent and imprecise (i.e. sparse data) and provided "low quality evidence". This could be further downgraded to "very low quality evidence" if there were also limitations in design or indirectness. The following definitions of quality of the evidence were applied (Guyatt 2008):
High quality: Further research is very unlikely to change our confidence in the estimate of effect.
Moderate quality: Further research is likely to have an important impact on our confidence in the estimate of effect and may change the estimate.
Low quality: Further research is very likely to have an important impact on our confidence in the estimate of effect and is likely to change the estimate.
Very low quality: We are very uncertain about the estimate.
To improve the readability of this review, a GRADE profile was only completed when we completed a meta‐analysis. If only one study was present for a given comparison, the results are described in the text and in the Characteristics of included studies table.
Results
Description of studies
See Characteristics of included studies; Characteristics of excluded studies.
In the previous Cochrane review on this topic, which was published in 2005 (Ostelo 2005), 21 RCTs were included. After screening these RCTs, two studies were considered to be ineligible for this update, one for not reporting the number of patients with CLBP (Bru 1994) and the other for including patients with sub‐acute LBP (Lindström 1992).
The updated search strategy for the current review identified an additional 121 references from MEDLINE, 337 from EMBASE, 100 from CINAHL, and 20 from PsycINFO. However, 186 of these publications were duplicated in more than one database, resulting in a total of 392 unique titles from the updated search. After screening the titles and abstracts, full text copies of 75 trials and 16 reviews were retrieved. The reference lists of the reviews were checked but did not result in the identification of any further relevant studies. After reviewing the full text of the 75 selected trials, both review authors (NH, RO) agreed on the inclusion of nine trials and exclusion of 57 trials. There was uncertainty regarding the inclusion of the nine remaining trials, so the remaining review authors were consulted in order to arrive at a consensus. Two of these nine trials were eventually included in this review. Therefore, 11 additional trials were included in this update, giving a total of 30 RCTs included in this systematic review.
Twelve studies compared some type of behavioural treatment to waiting list controls (Bush 1985; Kole‐Snijders 1996; Linton 1989; Linton 2008; Newton‐John 1995; Nouwen 1983; Smeets 2006; Stuckey 1986; Turner 1982; Turner 1988; Turner 1990; Turner 1993); ten studies were identified that compared various types of behavioural treatment (Donaldson 1994; Kole‐Snijders 1996; Leeuw 2008; Newton‐John 1995; Nicholas 1991; Rose 1997; Turner 1982; Turner 1988; Turner 1993; van den Hout 2003); nine studies compared behavioural treatment with some other kind of treatment (Brox 2003; Donaldson 1994; Fairbank 2005; McCauley 1983; Poole 2007; Smeets 2006; Turner 1990; van der Roer 2008; von Korff 2005); and ten studies compared behavioural treatment in addition to another treatment to that treatment alone (Altmaier 1992; Basler 1997; Friedrich 1998; Johnson 2007; Nicholas 1991; Nicholas 1992; Schweikert 2006; Smeets 2006; Strong 1998; Turner 1990). Five studies did not report the results in a way that allowed us to include them in the statistical pooling (Bush 1985; Kole‐Snijders 1996; Linton 1989; McCauley 1983; Strong 1998).
There were 20 RCTs that specifically mentioned the qualification of therapists and 10 RCTs where the qualification of therapists was not reported or reported insufficiently (Altmaier 1992; Brox 2003; Donaldson 1994; Fairbank 2005; Linton 2008; Newton‐John 1995; Schweikert 2006; Stuckey 1986; van der Roer 2008; Von Korff 1998). An example of sufficient description of qualifications of therapists was "psychologist who has had five years of experience with chronic pain patients since completing his clinical qualifications" (Nicholas 1991).
Risk of bias in included studies
The final results of the risk of bias assessment are shown in Figure 1. Fourteen studies (47%) had a low risk of bias, meeting six or more of the criteria (Basler 1997; Brox 2003; Bush 1985; Johnson 2007; Kole‐Snijders 1996; Leeuw 2008; Linton 1989; Newton‐John 1995; Nouwen 1983; Smeets 2006; Strong 1998; Turner 1988; van den Hout 2003; van der Roer 2008). All studies were described as randomised, however only nine studies (30%) used a clearly described and adequate randomisation procedure in combination with an adequate concealment of treatment allocation. All 30 studies (100%) had similar timing of outcome measurements between groups and most studies were free of selective reporting (28 studies; 93%). Fifteen studies (50%) had an acceptable drop‐out rate, 11 studies (37%) reported acceptable compliance, and in only nine studies (30%) were co‐interventions avoided or similar between groups.
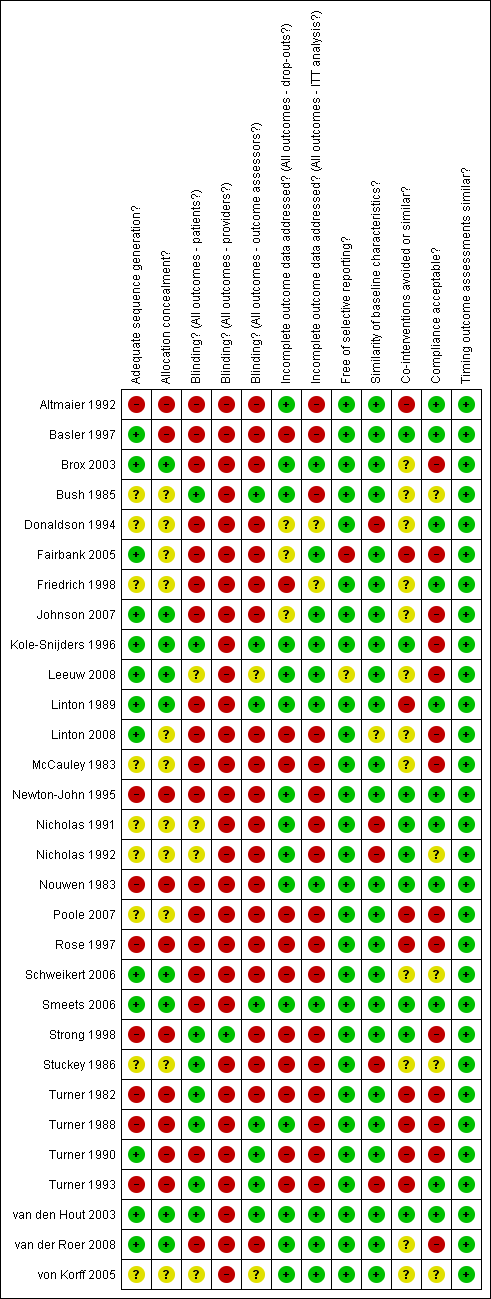
Summary of risks of bias for each included study
Clinical relevance
The clinical relevance scores for each trial are presented in Table 1. Twenty (67%) of the 30 RCTs were found to have moderate to high clinical relevance (a score of three or greater). The majority of studies could be easily assessed in terms of applicability to other populations because they provided sufficient descriptions of the included patients (26 trials; 87%), the interventions applied (27 trials; 90%), and measured appropriate outcome measures (26 trials; 87%). However, determining whether the study results were clinically relevant proved to be more difficult. Most studies did not provide enough information to ascertain whether the size of the effect was clinically important (16 trials, 53%) or whether treatment benefits outweighed the potential harms (29 trials; 97%). These findings indicate that while most studies were found to have moderate to high clinical relevance, the assessment is limited by poor reporting of outcome data and potential harms associated with treatment. However, It could be argued that the potential harms associated with behavioural therapy are negligible.
| Study | Patients | Interventions | Relevant outcomes | Size of effect | Benefit/Harms |
| Y | N | Y | N | ? | |
| Y | Y | Y | N | ? | |
| Y | Y | Y | N | ? | |
| Y | Y | Y | ? | ? | |
| Y | Y | N | ? | ? | |
| Y | Y | N | N | ? | |
| Y | Y | Y | ? | ? | |
| Y | Y | Y | Y | ? | |
| Y | Y | N | ? | ? | |
| Y | Y | Y | N | ? | |
| N | Y | Y | ? | ? | |
| Y | N | Y | N | ? | |
| N | Y | Y | ? | ? | |
| Y | Y | Y | ? | ? | |
| Y | Y | Y | N | ? | |
| Y | Y | Y | N | ? | |
| Y | Y | N | ? | ? | |
| Y | Y | Y | N | ? | |
| N | N | Y | N | ? | |
| Y | Y | Y | N | ? | |
| Y | Y | Y | Y | ? | |
| Y | Y | Y | ? | ? | |
| N | Y | Y | ? | ? | |
| Y | Y | Y | ? | ? | |
| Y | Y | Y | ? | ? | |
| Y | Y | Y | ? | ? | |
| Y | Y | Y | ? | ? | |
| Y | Y | Y | ? | ? | |
| Y | Y | Y | ? | Y | |
| Y | Y | Y | N | ? |
Effects of interventions
See: Summary of findings for the main comparison Summary of findings: Behavioural treatment versus waiting list control; Summary of findings 2 Summary of findings: Comparisons among behavioural treatments; Summary of findings 3 Summary of findings: Behavioural treatments versus other treatments; Summary of findings 4 Summary of findings: Behavioural treatments + other treatments versus other treatments alone
1. Behavioural treatment versus waiting list controls
Summary
As stated in the objectives, "no treatment" or "placebo" groups were considered as controls in this comparison, however, the included studies used only waiting list controls. Twelve studies, seven of which had a low risk of bias (Bush 1985; Kole‐Snijders 1996; Linton 1989; Newton‐John 1995; Nouwen 1983; Smeets 2006; Turner 1988), were identified as comparing some type of behavioural treatment (either cognitive, operant, respondent, or a combination) to waiting list controls. For this comparison, only post‐treatment (short‐term) data were available because after the treatment period, most studies allowed the waiting list controls to receive the intervention.
Using the GRADE approach, there is low quality evidence that respondent therapy (through progressive relaxation or EMG biofeedback) or a combination of behavioural therapies is more effective than a waiting list control for short‐term pain relief. There is also low quality evidence that respondent therapy (through progressive relaxation) is more effective than a waiting list control for improving functional status in the short‐term. Very low quality evidence exists that there is little or no difference between respondent therapy and a waiting list control on depression in the short‐term.
We found moderate quality evidence that operant therapy is more effective than a waiting list control for pain relief in the short‐term. There is low quality evidence that there is little or no difference between operant therapy, a combination of behavioural therapies, or a waiting list control for improved function or depression in the short‐term. Low quality evidence exists that there is little or no difference between cognitive therapy and a waiting list control for pain relief or improved function in the short‐term.
1.1 Respondent therapy (progressive relaxation) versus waiting list controls
Three studies with high risk of bias were identified for this comparison and provided data which could be pooled (Stuckey 1986; Turner 1982; Turner 1993). All three studies measured pain intensity as an outcome measure using a 100‐point scale. The Chi‐square value for homogeneity was 4.69 (P > 0.05), indicating statistical homogeneity among these studies. The MD (95% CI) when these studies were pooled was ‐19.77 (‐34.34 to ‐5.20) (Analysis 1.1). There is low quality evidence (three RCTs; N = 74; limitations in design, imprecision) that respondent therapy (progressive relaxation) is more effective than a waiting list control for pain relief in the short‐term.
The three RCTs measured generic functional status using either a 7‐point scale (Stuckey 1986) or the 136‐item Sickness Impact Profile (Turner 1982; Turner 1993). The SMD (95% CI) between these studies was ‐0.88 (‐1.36 to ‐0.39) (Analysis 1.2). There is low quality evidence (three RCTs; N = 74; limitations in design, imprecision) that respondent therapy (progressive relaxation) is more effective than a waiting list control at improving functional status over the short‐term.
In the behavioural domain, two RCTs (Turner 1982; Turner 1993) measured symptoms of depression as an outcome, using the Beck Depression Inventory. The MD (95% CI) when these studies were pooled was ‐6.80 (‐19.73 to 6.12) (Analysis 1.3). There is very low quality evidence (two RCTs; N = 58; limitations in design, inconsistency, imprecision) that there is no significant difference between respondent therapy (progressive relaxation) and a waiting list on symptoms of depression over a short‐term.
1.2 Respondent therapy (EMG biofeedback) versus waiting list controls
Three RCTs provided data in a format that could be pooled for this comparison (Newton‐John 1995; Nouwen 1983; Stuckey 1986). The RCT (N = 44) that was not included in the statistical pooling showed no differences between the two treatment arms (Bush 1985). The SMD (95% CI) between groups for pain intensity was ‐0.80 (‐1.32 to ‐0.28) in favour of respondent therapy (Analysis 2.1). There is low quality evidence (three RCTs; N = 64; limitations in design, imprecision) that respondent therapy through EMG biofeedback is more effective than a waiting list control for pain relief in the short‐term.
Two of the RCTs measured general functional status as an outcome measure (Newton‐John 1995; Stuckey 1986). The SMD (95% CI) between groups was ‐0.17 (‐1.56 to 1.22) (Analysis 2.2). There is very low quality evidence (two RCTs; N = 44; limitations in design, inconsistency, imprecision) that there is no significant difference between respondent therapy through EMG biofeedback and a waiting list control for improved function in the short‐term.
1.3 Operant therapy versus waiting list controls
Of four RCTs which were identified, two RCTs with a low risk of bias (Linton 1989; Turner 1988) and one RCT with a high risk of bias (Turner 1990) could be pooled. The trial (N = 89) that was not included in the pooling found small effects in favour of operant therapy (Kole‐Snijders 1996). Pain intensity was measured by the three pooled RCTs, and the pooled SMD (95% CI) between groups was ‐0.43 (‐0.75 to ‐0.11) in favour of the operant therapy group (Analysis 3.1). There is moderate quality evidence (N = 153; imprecision) that operant therapy is more effective than waiting list control for pain relief in the short‐term.
Two RCTs measured generic functional status using the SIP (Turner 1988; Turner 1990). The pooled MD (95% CI) between groups was ‐1.18 (‐3.53 to 1.18) (Analysis 3.2). There is low quality evidence (two RCTs; N = 87; limitations in design, imprecision) that there is no significant difference between operant therapy and a waiting list control on improved functional status in the short‐term.
Two RCTs measured symptoms of depression as an outcome measure, using different scales (Linton 1989; Turner 1990). The pooled SMD (95% CI) between groups was ‐0.11 (‐0.67 to 0.44) (Analysis 3.3). There is low quality evidence (two RCTs; N = 103; limitations in design, imprecision) that there is no significant difference between operant therapy and a waiting list control on depressive symptoms in the short‐term.
1.4 Cognitive therapy versus waiting list controls
Two RCTs with high risk of bias were identified for this comparison and could be pooled (Linton 2008; Turner 1993). With pain intensity as the outcome, the pooled SMD (95% CI) between groups was ‐0.27 (‐0.75 to 0.22) (Analysis 4.1). There is low quality evidence (two RCTs; N = 68; limitations in design, imprecision) that there is no significant difference between cognitive therapy and a waiting list control for pain relief in the short‐term.
The two RCTs also measured generic functional status as an outcome measure (Linton 2008; Turner 1993). The pooled SMD (95% CI) between groups was ‐0.15 (‐0.64 to 0.33) (Analysis 4.2). There is low quality evidence (two RCTs, N = 68; limitations in design, imprecision) that there is no significant difference between cognitive therapy and a waiting list control on improved functional status in the short‐term.
1.5 Combined behavioural therapy versus waiting list controls
There were five RCTs identified which compared a combination of behavioural therapy components (as a treatment 'package') to waiting list controls (Newton‐John 1995; Smeets 2006; Turner 1982; Turner 1988; Turner 1993). Three RCTs with a low risk of bias (Newton‐John 1995; Smeets 2006; Turner 1988) and two RCTs with a high risk of bias (Turner 1982; Turner 1993) measured pain intensity as an outcome of treatment. The pooled SMD (95% CI) for pain intensity between groups was ‐0.60 (‐0.97 to ‐0.22) in favour of combined behavioural therapy (Analysis 5.1). There is low quality evidence (five RCTs; N = 239; limitations in design, imprecision) that combined behavioural therapy is more effective than a waiting list control for pain relief in the short‐term.
Four of the RCTs measured generic functional status as an outcome, using the Pain Disability Index (Newton‐John 1995) or the SIP (Turner 1982; Turner 1988; Turner 1993). The pooled SMD (95% CI) between groups was ‐0.37 (‐0.87 to 0.13) (Analysis 5.2). There is low quality evidence (four RCTs; N = 134; limitations in design, imprecision) that there is no significant difference between combined behavioural therapy and a waiting list control on improved functional status in the short‐term.
Four RCTs used the BDI to evaluate symptoms of depression as an outcome measure (Newton‐John 1995; Smeets 2006; Turner 1982; Turner 1993). The pooled MD (95% CI) between groups was ‐1.92 (‐6.16 to 2.32) (Analysis 5.3). There is very low quality evidence (four RCTs; N = 194; limitations in design, inconsistency, imprecision) that there is no significant difference between combined behavioural therapy and a waiting list control on symptoms of depression in the short‐term.
2. Comparison among different types of behavioural treatment
Summary
Ten studies, five of which had a low risk of bias (Kole‐Snijders 1996; Leeuw 2008; Newton‐John 1995; Turner 1988; van den Hout 2003), were identified as comparing one type of behavioural therapy (or a combination of behavioural therapies) to another behavioural therapy. For some of the analyses in this comparison, short‐term (immediately post‐treatment), intermediate‐term (6‐month follow‐up), or long‐term (12‐month follow‐up) data were available. Seven RCTs provided data in a form that was suitable for statistical pooling (Leeuw 2008; Newton‐John 1995; Nicholas 1991; Turner 1982; Turner 1988; Turner 1993; van den Hout 2003).
Using the GRADE approach, we found moderate quality evidence that there is little or no difference between cognitive therapy and operant therapy, or operant therapy and a combination of behavioural therapies, on pain relief over a short‐ to intermediate‐term follow‐up. There is low quality evidence that respondent therapy is more effective than a combination of behavioural therapies for depression in the short‐term. There is very low quality evidence that respondent therapy using EMG biofeedback is more effective than respondent therapy using progressive relaxation for pain relief in the short‐term. For all of the other comparisons between different types of behavioural treatment, there is either no evidence, or only low to very low quality evidence that there is little or no difference in efficacy between one type or another.
2.1 Respondent therapy (EMG biofeedback) versus respondent therapy (progressive relaxation)
One RCT (N = 24) with a high risk of bias (Donaldson 1994) compared two types of respondent therapy, progressive relaxation and EMG biofeedback. The EMG biofeedback group improved significantly more than the relaxation group post‐treatment, and after three months of follow‐up. As this was the only study eligible for this comparison, there is only very low quality evidence (N = 24; limitations in design, inconsistency, imprecision) that EMG biofeedback is more effective than progressive relaxation for pain relief over the short‐term.
2.2 Cognitive versus operant therapy
Two RCTs, one with a low risk of bias (Leeuw 2008) and one with high risk of bias (Nicholas 1991), compared cognitive therapy to operant therapy. All groups in the trial with high risk of bias also received physiotherapy, back‐education and an exercise program (Nicholas 1991). Both studies evaluated pain intensity as an outcome measure over short‐ and intermediate‐term follow‐ups. The pooled SMD (95% CI) between groups was 0.41 (‐0.63 to 1.45) (Analysis 6.1) in the short‐term and 0.35 (‐0.64 to 1.35) in the intermediate‐term (Analysis 6.2). There is moderate quality evidence that there is no significant difference between cognitive therapy and operant therapy for pain relief over a short‐term follow‐up (two RCTs; N = 93; imprecision) or an intermediate‐term follow‐up (two RCTs; N = 82; imprecision).
2.3 Cognitive versus respondent therapy
One RCT with a high risk of bias compared cognitive therapy to respondent therapy with progressive muscle relaxation training (Turner 1993). This RCT (N = 47) found no significant differences between the groups post‐treatment or after six and 12 months on pain intensity, a global measure of improvement, or functional status (Turner 1993). As this was the only study eligible for this comparison, there is only very low quality evidence (N = 47; limitations in design, inconsistency, imprecision) that there is no significant difference in effect between cognitive therapy and respondent therapy using progressive muscle relaxation over any length of follow‐up.
2.4 Operant versus respondent therapy
There is no evidence, because no studies were identified that compared operant therapy to respondent therapy.
2.5 Combined behavioural therapy versus cognitive therapy
Two RCTs with high risk of bias compared a combination of behavioural treatments to cognitive therapy (Nicholas 1991; Turner 1993). The trial by Nicholas 1991 included two groups that underwent combined behavioural therapy and were included in the analyses. One of these groups received a combination of operant and respondent therapy, while the other received a combination of cognitive and respondent therapy (Nicholas 1991). When these groups were pooled with the trial by Turner 1993, the SMD (95% CI) for pain intensity was ‐0.24 (‐1.36 to 0.87) in the short‐term (Analysis 7.1); ‐0.30 (‐2.59 to 1.98) in the intermediate‐term (Analysis 7.2); and ‐0.89 (‐3.64 to 1.87) in the long‐term (Analysis 7.3). There is very low quality evidence (two RCTs; N = 61; limitations in design, inconsistency, imprecision) that there is no significant difference between a combination of behavioural therapies and cognitive therapy alone for pain relief over the short‐, intermediate‐, or long‐term.
The two RCTs also measured generic functional status using the SIP after short‐, intermediate‐, and long‐term follow‐ups (Nicholas 1991; Turner 1993). The MD (95% CI) between groups was ‐2.01 (‐10.02 to 5.99) in the short‐term (Analysis 7.4); ‐3.20 (‐16.44 to 10.04) in the intermediate‐term (Analysis 7.5); and ‐2.23 (‐12.59 to 8.13) in the long‐term (Analysis 7.6). There is low quality evidence over short‐term follow‐up (two RCTs; N = 61; limitations in design, imprecision) and very low quality evidence over intermediate‐ to long‐term follow‐up (two RCTs; N = 47; limitations in design, inconsistency, imprecision) that there is no significant difference between a combination of behavioural therapies and cognitive therapy for improved functional status.
Both RCTs evaluated symptoms of depression using the BDI (Nicholas 1991; Turner 1993). The pooled MD (95% CI) was ‐3.10 (‐11.43 to 5.23) over the short‐term (Analysis 7.7); ‐4.66 (‐10.94 to 1.61) in the intermediate‐term (Analysis 7.8); and ‐0.64 (‐4.61 to 3.32) over a long‐term follow‐up (Analysis 7.9). There is very low quality evidence over short‐term follow‐up (two RCTs; N = 61; limitations in design, inconsistency, imprecision) and low quality evidence in the intermediate‐ to long‐term (two RCTs; N = 47; limitations in design, imprecision) that there is no significant difference between a combination of behavioural therapies and cognitive therapy alone on symptoms of depression.
2.6 Combined behavioural therapy versus operant therapy
Three studies with a low risk of bias (Kole‐Snijders 1996; Turner 1988; van den Hout 2003) and one study with a high risk of bias (Nicholas 1991) were identified which compared a combination of behavioural treatments to operant therapy alone. One RCT, comparing a combination of cognitive and operant therapy to operant therapy alone, did not provide data in a form that was suitable for statistical pooling (Kole‐Snijders 1996). One of the pooled RCTs included two groups that underwent combined behavioural therapy and were included in the analyses (Nicholas 1991). One of these groups was a combination of operant and respondent therapy, while the other was a combination of cognitive and respondent therapy. When these groups were pooled with the other two studies (Turner 1988; van den Hout 2003) the SMD (95% CI) for pain intensity was ‐0.15 (‐0.46 to 0.16) in the short‐term (Analysis 8.1); ‐0.23 (‐0.57 to 0.11) in the intermediate‐term (Analysis 8.2); and ‐0.31 (‐0.65 to 0.03) in the long‐term (Analysis 8.3). There is moderate quality evidence (three RCTs; N = 161; imprecision) that there is no significant difference between combined behavioural treatment and operant therapy alone for pain relief in the short‐, intermediate‐, and long‐term.
One RCT with a low risk of bias (Turner 1988) and one RCT with a high risk of bias (Nicholas 1991) measured generic functional status as an outcome. The pooled SMD (95% CI) was 0.21(‐0.24 to 0.67) in the short‐term (Analysis 8.4); ‐0.23 (‐1.01 to 0.55) in the intermediate‐term (Analysis 8.5); and ‐0.50 (‐1.56 to 0.56) in the long‐term (Analysis 8.6). There is low quality evidence (two RCTs; N = 77; limitations in design, imprecision) that there is no significant difference between combined behavioural therapy and operant therapy alone for improved functional status in the short‐, intermediate‐, and long‐term.
2.7 Combined behavioural therapy versus respondent therapy
Three RCTs were identified which compared a combined behavioural treatment to respondent therapy alone (Newton‐John 1995; Turner 1982; Turner 1993). Two had a high risk of bias (Turner 1982; Turner 1993) and one had a low risk of bias (Newton‐John 1995). The pooled SMD (95% CI) for pain intensity was 0.09 (‐0.31 to 0.50) in the short‐term (Analysis 9.1) and 0.47 (‐0.42 to 1.35) in the intermediate‐term (Analysis 9.2). There is low quality evidence that there is no significant difference between combined behavioural therapy and respondent therapy alone for pain relief in the short‐term (three RCTs; N = 97; limitations in design, imprecision), or in the intermediate‐term (two RCTs; N = 62; limitations in design, imprecision).
The three RCTs measured generic functional status as an outcome, using the Pain Disability Index (Newton‐John 1995) or the SIP (Turner 1982; Turner 1993). The pooled SMD (95% CI) was 0.38 (‐0.02 to 0.78) in the short‐term (Analysis 9.3) and 0.13 (‐0.81 to 1.07) in the long‐term (Analysis 9.4). There is low quality evidence that there is no significant difference between combined behavioural therapy and respondent therapy alone for improved functional status in the short‐term (three RCTs; N = 97; limitations in design, imprecision), or in the intermediate‐term (two RCTs; N = 62; limitations in design, imprecision).
Symptoms of depression, measured with the BDI, were also evaluated as an outcome measure in the three RCTs (Newton‐John 1995; Turner 1982; Turner 1993). The pooled MD (95% CI) was 2.89 (0.55 to 5.24) in favour of respondent therapy in the short‐term (Analysis 9.5) and 1.84 (‐0.43 to 4.11) in the intermediate‐term (Analysis 9.6). There is low quality evidence in the short‐term (three RCTs; N = 97; limitations in design, imprecision) that respondent therapy is more effective than combined behavioural therapy; and low quality evidence in the intermediate‐term (two RCTs; N = 62; limitations in design, imprecision) that there is no significant difference between combined behavioural therapy and respondent therapy for symptoms of depression.
A separate RCT with a high risk of bias (Rose 1997) evaluated four groups of LBP patients following different programs of combined behavioural therapy, but found no significant differences between group and individual therapy (N = 50), or between a high and low intensity program (N = 60).
3. Behavioural treatment versus other kinds of treatment
Summary
Nine RCTs were identified which compared some form of behavioural treatment to another kind of treatment, two of which had a low risk of bias (Brox 2003; Smeets 2006). The treatments that behavioural therapy was compared to were: usual care (Poole 2007; von Korff 2005), group exercise (Smeets 2006; Turner 1990), spine stabilisation surgery (Brox 2003; Fairbank 2005), guideline‐based care (van der Roer 2008), education (Donaldson 1994), and hypnosis (McCauley 1983).
Using the GRADE approach, we found moderate quality evidence that behavioural treatment is more effective than usual care for pain relief in the short‐term, but there is no difference in the intermediate‐term. There is also moderate quality evidence that there is no significant difference between behavioural treatment and usual care for improved back‐specific functional status in the short‐ to intermediate‐term. When compared to a group exercise program, there is moderate quality evidence that behavioural treatment is as effective for improving pain or depression in the intermediate‐ to long‐term. There is also low quality evidence that there is no significant difference between behavioural therapy and group exercise for pain or depression in the short‐term. We found low quality evidence that there is no significant difference between behavioural treatment and surgical stabilisation for back‐specific functional status in the long‐term. Only single RCTs were identified for comparisons between behavioural treatment and guideline‐based care (van der Roer 2008), education (Donaldson 1994), or hypnosis (McCauley 1983). These studies are described in further detail in the Characteristics of included studies table.
3.1 Behavioural treatment versus usual care
Two RCTs with a high risk of bias compared behavioural treatment to usual care (Poole 2007; von Korff 2005) and were deemed to be clinically homogenous enough to allow for statistical pooling. For pain intensity measured on a 100‐point VAS, the pooled MD (95% CI) was ‐5.18 (‐9.79 to ‐0.57) in favour of behavioural treatment in the short‐term (Analysis 10.1); and ‐4.29 (‐9.28 to 0.69) in the intermediate‐term (Analysis 10.2). There is moderate quality evidence (two RCTs; N = 330; limitations in design) that behavioural treatment is more effective than usual care for pain relief in the short‐term, but there is little or no difference between the groups for pain relief in the intermediate‐term.
The two RCTs also measured back‐specific functional status as an outcome measure using the Roland‐Morris Disability Questionnaire (RMDQ) (von Korff 2005) or the Oswestry Disability Index (ODI) (Poole 2007). The pooled SMD (95% CI) was ‐0.20 (‐0.41 to 0.02) in the short‐term (Analysis 10.3) and ‐0.12 (‐0.34 to 0.10) in the intermediate‐term (Analysis 10.4). There is moderate quality evidence (two RCTs; N = 330; limitations in design) that there is no significant difference between behavioural treatment and usual care for improved back‐specific functional status in the short‐ to intermediate‐term.
3.2 Behavioural treatment versus group exercise
Two RCTs, one with a low risk of bias (Smeets 2006) and one with a high risk of bias (Turner 1990), compared behavioural treatment to a group exercise program. Both trials measured pain intensity using the Pain Rating Index (PRI) as an outcome. The pooled MD (95% CI) between groups was ‐2.31 (‐6.33 to 1.70) in the short‐term (Analysis 11.1), 1.18 (‐3.16 to 5.53) in the intermediate‐term (Analysis 11.2), and 0.14 (‐4.40 to 4.67) in the long‐term (Analysis 11.3). There is low quality evidence (two RCTs; N = 146; limitations in design, imprecision) that there is no significant difference between behavioural treatment and a group exercise program for pain relief in the short‐term. There is moderate quality evidence (two RCTs; N = 137; imprecision) that there is no significant difference between behavioural treatment and a group exercise program for pain relief in the intermediate‐ to long‐term.
These two RCTs also measured symptoms of depression, using the BDI (Smeets 2006) or the CESD (Turner 1990). The pooled SMD (95% CI) between groups was 0.25 (‐0.07 to 0.58) in the short‐term (Analysis 11.4), 0.02 (‐0.32 to 0.35) in the intermediate‐term (Analysis 11.5), and 0.07 (‐0.27 to 0.41) in the long‐term (Analysis 11.6). There is low quality evidence (two RCTs; N = 146; limitations in design, imprecision) that there is no significant difference between behavioural treatment and a group exercise program for symptoms of depression in the short‐term. There is moderate quality evidence (two RCTs; N = 137; imprecision) that there is no significant difference between behavioural treatment and a group exercise program for symptoms of depression in the intermediate‐ to long‐term.
3.3 Behavioural treatment versus surgical stabilisation
Two RCTs, one with a low risk of bias (Brox 2003) and one with a high risk of bias (Fairbank 2005), compared behavioural treatment to surgical stabilisation in CLBP patients who were candidates for surgery. Both trials provided long‐term follow‐up data (>12 months) for back‐specific functional status, measured by the ODI. The pooled MD (95% CI) between groups was 2.36 (‐1.94 to 6.66) (Analysis 12.1). There is low quality evidence (two RCTs; N = 345; limitations in design, indirectness) that behavioural treatment is as effective as surgical stabilisation to improve back‐specific functional status over long‐term follow‐up.
4. Behavioural treatment in addition to another treatment versus the other treatment alone
Summary
Ten RCTs, four of which had a low risk of bias (Basler 1997; Johnson 2007; Smeets 2006; Strong 1998), were identified in which behavioural treatment was added to another treatment and compared to the other treatment alone. Behavioural treatment was added to a number of different treatments including physiotherapy with back education (Nicholas 1991; Nicholas 1992), an educational booklet and audio cassette (Johnson 2007), an inpatient pain management program (Altmaier 1992; Schweikert 2006, Strong 1998), various forms of medical treatment (e.g., pain medication, nerve blocks, or physical therapy) (Basler 1997), and exercise therapy (Friedrich 1998; Smeets 2006; Turner 1990). The RCTs which evaluated the addition of behavioural treatment to exercise therapy were considered to be clinically heterogenous and so were not pooled (Friedrich 1998; Smeets 2006; Turner 1990).
Using the GRADE approach, we found low quality evidence that adding behavioural treatment to physiotherapy and back education was no more effective for pain, depression, or function over the short‐ to intermediate‐term than physiotherapy and back education alone. There was moderate quality evidence that adding behavioural treatment to inpatient pain rehabilitation was no more effective for short‐term pain relief than inpatient rehabilitation alone.
4.1 Behavioural treatment in addition to physiotherapy
Two RCTs with a high risk of bias (Nicholas 1991; Nicholas 1992) evaluated the addition of a number of behavioural treatments to physiotherapy and back education. For pain intensity on a 6‐point nominal scale, the pooled MD (95% CI) was ‐0.13 (‐1.01 to 0.75) in the short‐term (Analysis 13.1), and ‐0.11 (‐0.67 to 0.44) in the intermediate‐term (Analysis 13.2). There is low quality evidence (two RCTs; N = 59; limitations in design, imprecision) that the addition of behavioural treatment to physiotherapy and back education is no more effective than physiotherapy and back education alone for pain relief over the short‐ to intermediate‐term.
The same two RCTs (Nicholas 1991; Nicholas 1992) also measured symptoms of depression using the BDI, and the pooled MD (95% CI) was 1.56 (‐1.71 to 4.83) in the short‐term (Analysis 13.3) and 0.17 (‐6.85 to 7.19) in the intermediate‐term (Analysis 13.4). There is low quality evidence (two RCTs; N = 59; limitations in design, imprecision) that the addition of behavioural treatment to physiotherapy and back education is no more effective than physiotherapy and back education alone for symptoms of depression over the short‐ to intermediate‐term.
For generic functional status (measured with the SIP) in these two RCTs (Nicholas 1991; Nicholas 1992) the pooled MD (95% CI) was ‐6.26 (‐12.71 to 0.19) in the short‐term (Analysis 13.5), and ‐0.93 (‐6.71 to 4.84) in the intermediate‐term (Analysis 13.6). There is low quality evidence (two RCTs; N = 59; limitations in design, imprecision) that the addition of behavioural treatment to physiotherapy and back education is no more effective than physiotherapy and back education alone for improving functional status over the short‐ to intermediate‐term.
4.1 Behavioural treatment in addition to inpatient pain rehabilitation
Two RCTs with a high risk of bias (Altmaier 1992; Schweikert 2006) compared the addition of behavioural treatment to an inpatient multidisciplinary pain program to the multidisciplinary program alone. One RCT with a low risk of bias did not provide data in a form suitable for pooling (Strong 1998). The SMD (95% CI) for pain intensity was ‐0.14 (‐0.34 to 0.05) in the short‐term (Analysis 14.1). There is moderate quality evidence (two RCTs; N = 405; limitations in design) that the addition of behavioural treatment to an inpatient multidisciplinary program is no more effective than the multidisciplinary program alone for pain intensity in the short‐term.
Discussion
Thirty RCTs were included in this updated systematic review. In addition to eleven new trials identified since the previous review, an updated risk of bias assessment was performed, and the GRADE approach was used to judge the quality of the evidence. Generally, the included trials were small in size, did not provide long‐term outcomes, and suffered from poor reporting of a number of methodological quality items. None of the comparisons made in this systematic review provided high quality evidence, either for or against behavioural treatment. For most of the comparisons made in this review, there was only low or very low quality evidence to support the results. Moderate quality evidence was found for a small number of comparisons evaluated in this updated systematic review. Operant therapy was found to be more effective than a waiting list control for short‐term pain relief. No significant differences were found for pain relief when operant therapy was compared to cognitive therapy or to a combined behavioural treatment. There was also moderate quality evidence that behavioural treatment is more effective than usual care for pain relief in the short‐term, but there was no difference in the intermediate‐term. There were no differences between behavioural treatment and a usual care package on back‐pain related disability over the short‐ to intermediate‐term. When behavioural treatment was compared to a group exercise program, no significant difference was found for pain relief or symptoms of depression over the intermediate‐ to long‐term. There was moderate quality evidence that the addition of behavioural treatment to an inpatient pain management program is no more effective than an inpatient program alone for short‐term pain relief.
The rationale upon which behavioural treatments for CLBP are based recognises that the aim is not to treat the pain directly, but to attempt to modify one of the three response systems: behaviour, cognition, or physiological reactivity (Vlaeyen 1995). Therefore, if a behavioural treatment is effective, we would expect to see significant changes in outcomes which measure one of these three responses, but not necessarily a reduction in pain intensity. A large number and variety of behavioural outcomes were measured by the included trials in this review, which served to express the diversity of behavioural constructs which are considered part of the three response systems. Behavioural outcomes measuring the effect of treatment on coping skills, pain behaviours, mood, or social role functioning were identified, in most cases however, these were only measured in individual studies. This variation in outcome measures hampered the comparability between studies in this domain. Apart from pain intensity and functional status (generic and back specific), depressive symptoms (measured by the Beck Depression Inventory) were the only other outcomes to be pooled in the meta‐analyses. Despite general recommendations that RCTs on interventions for CLBP measure pain intensity and pain‐related disability to evaluate the efficacy of treatment (Bombardier 2000), there is still uncertainty regarding the appropriate behavioural outcomes to use. A recent study compared 20 psychological constructs in predicting LBP outcome in primary care and found that four factors (personal control, acute/chronic timeline, illness identify, and pain self‐efficacy) were strongly predictive of outcome after six months of follow‐up (Foster 2010). These appeared to be better predictors of disability than more common targets for behavioural treatment such as fear avoidance, catastrophising, and depression. Future research is needed to translate this information about the most predictive psychological factors to recovery into targeted interventions and improved outcomes for patients.
While the evidence from the current review shows a promising effect on pain relief in favour of behavioural therapy, it is important to consider how the interventions are applied in practice and the clinical importance of the effect size before it is recommended as part of CLBP management (Malmivaara 2006). The applicability and clinical relevance of the results deal with the questions of whether and how to use the evidence in practice. It is difficult to provide firm definitions of the therapeutic components of behavioural treatment, such as cognitive or operant methods, as there are often considerable differences in the descriptions of the applied interventions between trials. However, in this review, it was found that most of the included RCTs provided adequate descriptions of the interventions (90%), the patient characteristics (87%), and outcome measures (87%) to assess whether the results are applicable to other populations. A clinically significant effect size was defined as a 30% difference between groups in pain intensity, as measured with a visual analogue scale (VAS); and an improvement of 8% to12% in functional ability measured with the Roland‐Morris Disability Questionnaire (RMDQ) (Furlan 2009). However, because many of the included trials did not measure pain and functional ability with a VAS or the RMDQ (respectively), there was usually insufficient information to determine if the size of the effect was clinically significant. While these outcomes are recommended for use in most CLBP trials (Bombardier 2000), further research is needed to expand the definition of a clinically significant effect size, especially when measured with other commonly used outcome measures. Only one of the included RCTs (van der Roer 2008) reported on whether any adverse effects related to the intervention were observed. This made it difficult to determine whether the benefits gained from behavioural treatment are worth the potential harms. From the results of the meta‐analyses, it can be seen that behavioural treatment for CLBP generally results in small effect sizes. However, as behavioural treatment can be considered inherently harmless, small benefits could be considered worthwhile if they prove to be cost‐effective.
Risk of Bias
The risk of bias of the trials included in this review was generally high (Figure 1). Considering the nature of behavioural therapy, blinding of patients and care providers is difficult, if not impossible in some cases. Many of the other criteria used to assess risk of bias were not reported, especially details about the randomisation procedure and concealment, compliance, and tracking of co‐interventions. In order for an RCT to be considered to have a low risk of bias, adequate reporting of essential methodological quality criteria is required. There was a trend for more recent studies (e.g. Smeets 2006, van der Roer 2008) to fulfil more of these criteria, which can be attributed to an increasing awareness of methodological issues and reporting guidelines (Plint 2006). The limitations found in the design and reporting of the included RCTs contributed to the overall judgment of the quality of evidence, using the GRADE approach, and served to downgrade the quality for most of the comparisons.
Data‐analysis
A number of important changes in data collection and analysis have been made to the review since the previous version, the most significant of which was the method of grading the quality of the evidence for each comparison. Using a "levels of evidence" approach, the previous version of this review (Ostelo 2005) found moderate evidence that respondent therapy (using progressive relaxation) has a large positive effect on pain intensity and behavioural outcomes in the short‐term. In the same comparison performed in the current review, there was only low quality evidence to support a positive effect of respondent therapy (using progressive relaxation) on pain relief. This change in the strength of evidence was not a result of the addition of new trials to the meta‐analysis, but of applying the GRADE approach, which considers limitations in the design of trials as well as factors such as inconsistency, imprecision, and indirectness. We can see from the case of respondent therapy with progressive relaxation that there were serious limitations in the design of the pooled trials but also sparse data. The small sample sizes of the pooled trials meant there was serious imprecision in the estimate and thus the evidence was downgraded from moderate to low quality.
In an effort to remain consistent when applying the GRADE approach to a meta‐analysis, provisional cut‐offs were made for each factor. For example, when coming to a decision about the extent of limitations in the design of pooled trials, we downgraded the quality of evidence if more than 25% of the pooled sample came from studies with a high risk of bias. The evidence for a comparison was considered inconsistent if significant statistical heterogeneity existed, and imprecise if the pooled sample size was less than 300. While these cut‐offs have not been empirically tested, they can be considered to have face validity and their intention was to ensure the consensus process remained consistent and manageable. It is important to note that small variations in the decision making process when applying the GRADE approach can lead to changes in the reported quality of evidence.

Summary of risks of bias for each included study

Comparison 1 Respondent therapy (progressive relaxation) versus waiting list control, Outcome 1 Pain (short‐term).
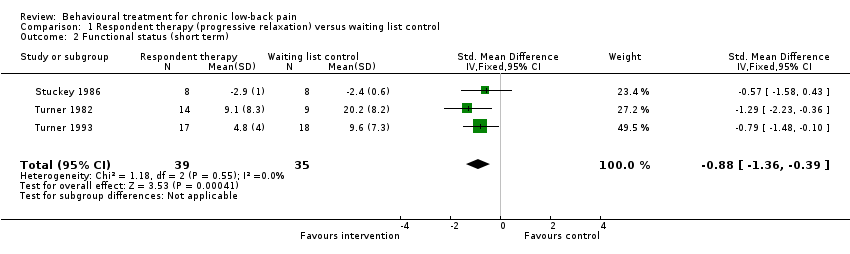
Comparison 1 Respondent therapy (progressive relaxation) versus waiting list control, Outcome 2 Functional status (short term).
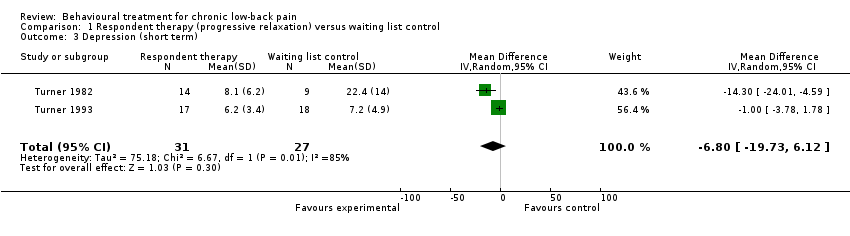
Comparison 1 Respondent therapy (progressive relaxation) versus waiting list control, Outcome 3 Depression (short term).

Comparison 2 Respondent therapy (EMG biofeedback) versus waiting list control, Outcome 1 Pain (short term).
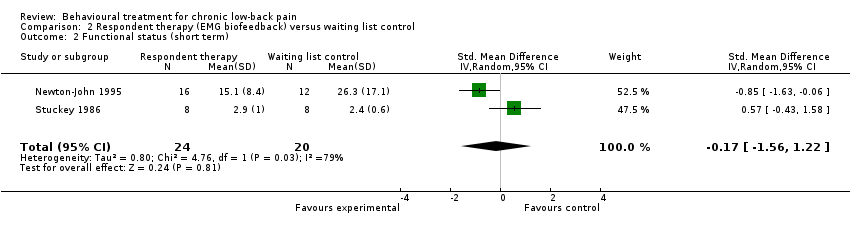
Comparison 2 Respondent therapy (EMG biofeedback) versus waiting list control, Outcome 2 Functional status (short term).

Comparison 3 Operant therapy versus waiting list control, Outcome 1 Pain (short term).

Comparison 3 Operant therapy versus waiting list control, Outcome 2 Functional status (short term).
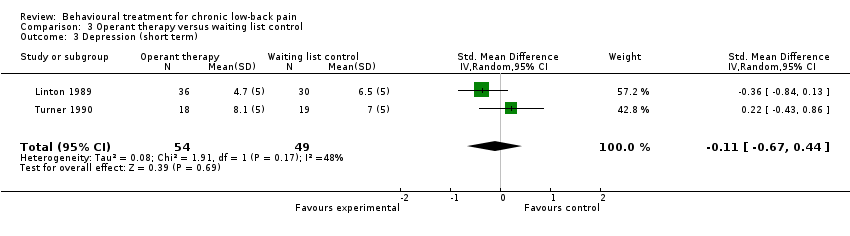
Comparison 3 Operant therapy versus waiting list control, Outcome 3 Depression (short term).

Comparison 4 Cognitive therapy versus waiting list control, Outcome 1 Pain (short term).

Comparison 4 Cognitive therapy versus waiting list control, Outcome 2 Functional status (short term).

Comparison 5 Cognitive‐behavioural therapy versus waiting list control, Outcome 1 Pain (short term).
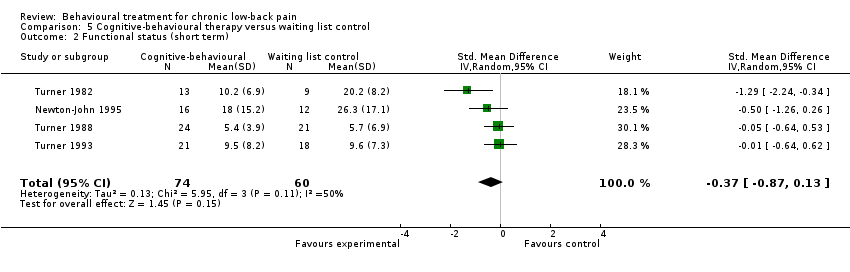
Comparison 5 Cognitive‐behavioural therapy versus waiting list control, Outcome 2 Functional status (short term).
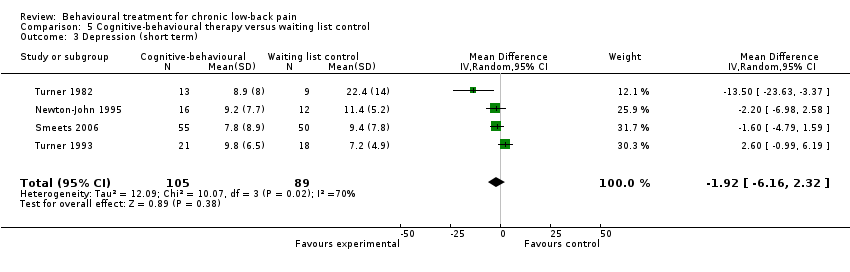
Comparison 5 Cognitive‐behavioural therapy versus waiting list control, Outcome 3 Depression (short term).

Comparison 6 Cognitive therapy versus operant therapy, Outcome 1 Pain (short term).

Comparison 6 Cognitive therapy versus operant therapy, Outcome 2 Pain (intermediate term).

Comparison 7 Cognitive‐behavioural therapy versus cognitive therapy, Outcome 1 Pain (short‐term).

Comparison 7 Cognitive‐behavioural therapy versus cognitive therapy, Outcome 2 Pain (intermediate‐term).
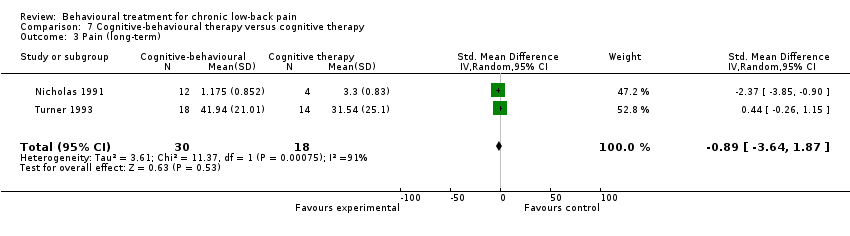
Comparison 7 Cognitive‐behavioural therapy versus cognitive therapy, Outcome 3 Pain (long‐term).
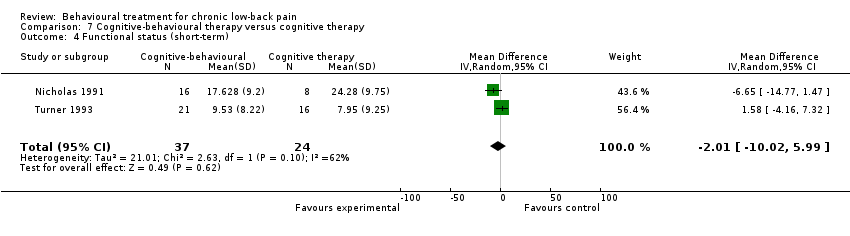
Comparison 7 Cognitive‐behavioural therapy versus cognitive therapy, Outcome 4 Functional status (short‐term).

Comparison 7 Cognitive‐behavioural therapy versus cognitive therapy, Outcome 5 Functional status (intermediate‐term).

Comparison 7 Cognitive‐behavioural therapy versus cognitive therapy, Outcome 6 Functional status (long‐term).

Comparison 7 Cognitive‐behavioural therapy versus cognitive therapy, Outcome 7 Depression (short‐term).
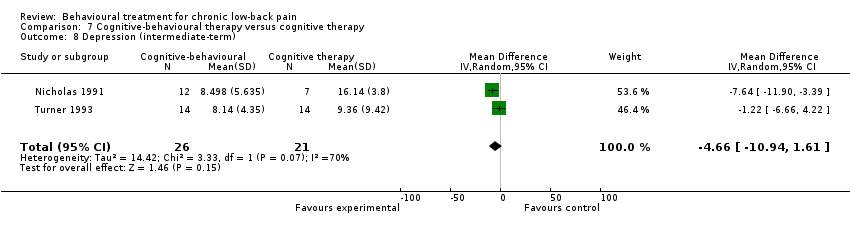
Comparison 7 Cognitive‐behavioural therapy versus cognitive therapy, Outcome 8 Depression (intermediate‐term).

Comparison 7 Cognitive‐behavioural therapy versus cognitive therapy, Outcome 9 Depression (long‐term).

Comparison 8 Cognitive‐behavioural therapy versus operant therapy, Outcome 1 Pain (short‐term).

Comparison 8 Cognitive‐behavioural therapy versus operant therapy, Outcome 2 Pain (intermediate‐term).

Comparison 8 Cognitive‐behavioural therapy versus operant therapy, Outcome 3 Pain (long‐term).
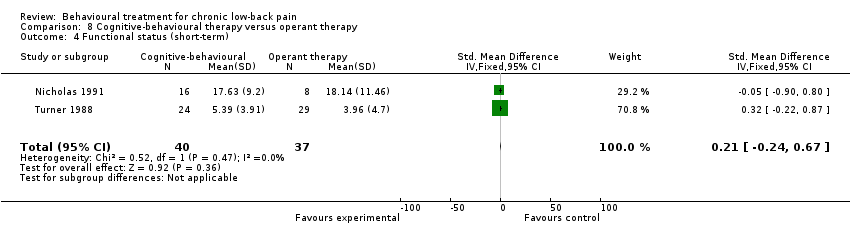
Comparison 8 Cognitive‐behavioural therapy versus operant therapy, Outcome 4 Functional status (short‐term).

Comparison 8 Cognitive‐behavioural therapy versus operant therapy, Outcome 5 Functional status (intermediate‐term).

Comparison 8 Cognitive‐behavioural therapy versus operant therapy, Outcome 6 Functional status (long‐term).
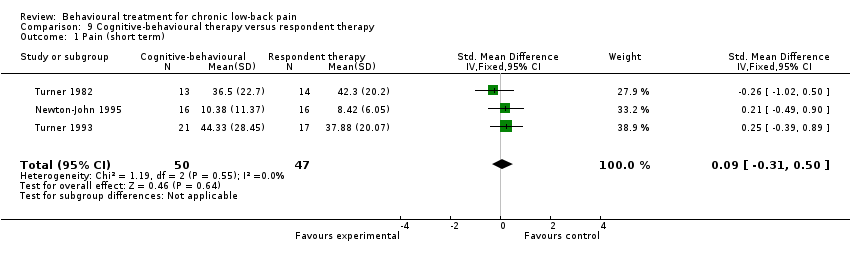
Comparison 9 Cognitive‐behavioural therapy versus respondent therapy, Outcome 1 Pain (short term).
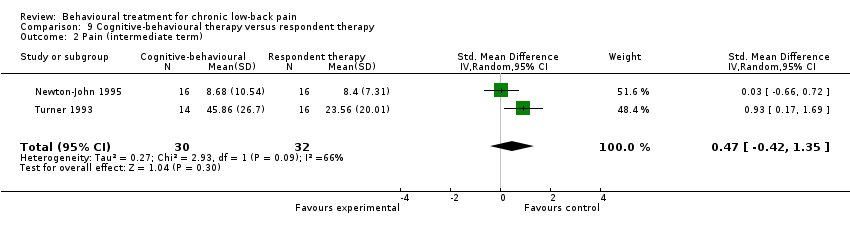
Comparison 9 Cognitive‐behavioural therapy versus respondent therapy, Outcome 2 Pain (intermediate term).

Comparison 9 Cognitive‐behavioural therapy versus respondent therapy, Outcome 3 Functional status (short term).

Comparison 9 Cognitive‐behavioural therapy versus respondent therapy, Outcome 4 Functional status (intermediate term).

Comparison 9 Cognitive‐behavioural therapy versus respondent therapy, Outcome 5 Depression (short term).

Comparison 9 Cognitive‐behavioural therapy versus respondent therapy, Outcome 6 Depression (intermediate term).
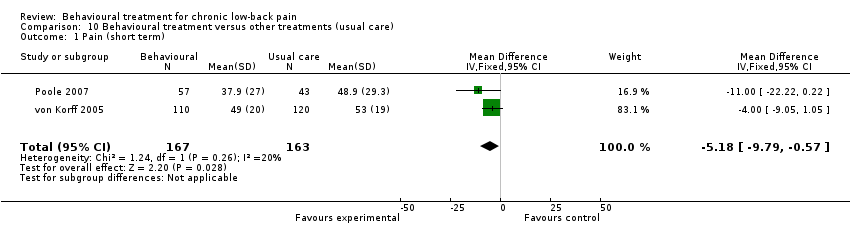
Comparison 10 Behavioural treatment versus other treatments (usual care), Outcome 1 Pain (short term).
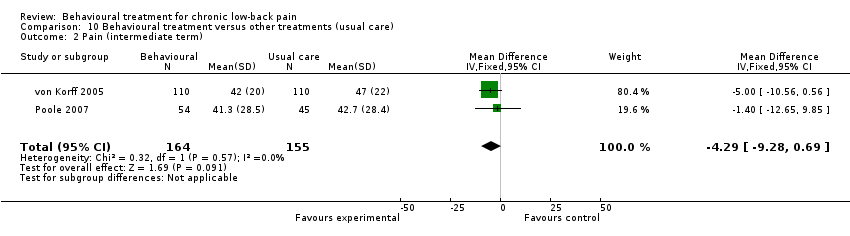
Comparison 10 Behavioural treatment versus other treatments (usual care), Outcome 2 Pain (intermediate term).

Comparison 10 Behavioural treatment versus other treatments (usual care), Outcome 3 Back specific functional status (short term).

Comparison 10 Behavioural treatment versus other treatments (usual care), Outcome 4 Back specific functional status (intermediate term).

Comparison 11 Behavioural treatment versus other treatments (group exercise), Outcome 1 Pain (short term).
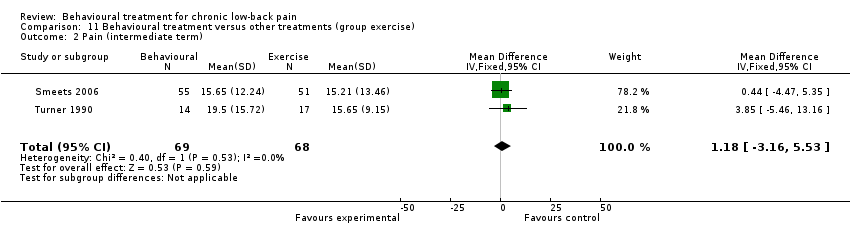
Comparison 11 Behavioural treatment versus other treatments (group exercise), Outcome 2 Pain (intermediate term).

Comparison 11 Behavioural treatment versus other treatments (group exercise), Outcome 3 Pain (long term).

Comparison 11 Behavioural treatment versus other treatments (group exercise), Outcome 4 Depression (short term).

Comparison 11 Behavioural treatment versus other treatments (group exercise), Outcome 5 Depression (intermediate term).

Comparison 11 Behavioural treatment versus other treatments (group exercise), Outcome 6 Depression (long term).

Comparison 12 Behavioural treatment versus other treatments (surgery), Outcome 1 Back specific functional status (long term).

Comparison 13 Behavioural treatment in addition to physiotherapy versus physiotherapy, Outcome 1 Pain intensity (short term).

Comparison 13 Behavioural treatment in addition to physiotherapy versus physiotherapy, Outcome 2 Pain Intensity (intermediate term).
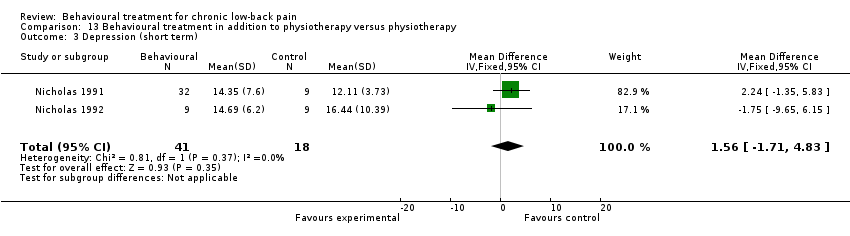
Comparison 13 Behavioural treatment in addition to physiotherapy versus physiotherapy, Outcome 3 Depression (short term).

Comparison 13 Behavioural treatment in addition to physiotherapy versus physiotherapy, Outcome 4 Depression (intermediate term).

Comparison 13 Behavioural treatment in addition to physiotherapy versus physiotherapy, Outcome 5 Functional status (short term).

Comparison 13 Behavioural treatment in addition to physiotherapy versus physiotherapy, Outcome 6 Functional status (intermediate term).

Comparison 14 Behavioural treatment in addition to inpatient rehabilitation versus inpatient rehabilitation, Outcome 1 Pain intensity (short term).
| Behavioural treatment compared with waiting list control for chronic low‐back pain | |||||
| Patient or population: adults with chronic low‐back pain Settings: primary and secondary health care centres Intervention: behavioural treatment (respondent, cognitive, and operant therapy, or a combination) Comparison: waiting list control | |||||
| Outcomes | Illustrative means (95% CI) | No of Participants | Quality of the evidence | Comments | |
| Control group | Intervention group | ||||
| Waiting list control | Respondent therapy (progressive relaxation) | ||||
| Pain intensity VAS scale (0‐100) short‐term follow‐up | The mean pain intensity ranged across control groups from | The mean pain intensity in the intervention groups was 19.77 points lower (34.34 to 5.2 lower) | 74 | ++OO | |
| Functional status (generic) various scales short‐term follow‐up | The mean generic functional status in the intervention groups was 0.88 standard deviations lower (1.36 to 0.39 lower) | 74 | ++OO | SMD ‐0.88 (‐1.36 to ‐0.39) | |
| Depression Beck Depression Inventory (0‐63) short‐term follow‐up | The mean depression ranged across control groups from | The mean depression in the intervention groups was 6.8 points lower (19.73 lower to 6.12 higher) | 58 | +OOO | |
| Waiting list control | Respondent therapy (EMG biofeedback) | ||||
| Pain intensity various scales short‐term follow‐up | The mean pain intensity in the intervention groups was 0.8 standard deviations lower (1.32 to 0.28 lower) | 64 | ++OO | SMD ‐0.8 (‐1.32 to ‐0.28) | |
| Functional status (generic) various scales short‐term follow‐up | The mean functional status in the intervention groups was 0.17 standard deviations lower (1.56 lower to 1.22 higher) | 44 | +OOO | SMD ‐0.17 (‐1.56 to 1.22) | |
| Waiting list control | Operant therapy | ||||
| Pain intensity various scales short‐term follow‐up | The mean pain intensity in the intervention groups was 0.43 standard deviations lower (0.75 to 0.11 lower) | 153 | +++O | SMD ‐0.43 (‐0.75 to ‐0.11) | |
| Functional status (generic) Sickness Impact Profile (0‐136) short‐term follow‐up | The mean generic functional status ranged across control groups from | The mean functional status in the intervention groups was 1.18 points lower (3.53 lower to 1.18 higher) | 87 | ++OO | |
| Depression various scales short‐term follow‐up | The mean depression in the intervention groups was 0.11 standard deviations lower (0.67 lower to 0.44 higher) | 103 | ++OO | SMD ‐0.11 (‐0.67 to 0.44) | |
| Waiting list control | Cognitive therapy | ||||
| Pain intensity various scales short‐term follow‐up | The mean pain intensity in the intervention groups was 0.27 standard deviations lower (0.75 lower to 0.22 higher) | 68 | ++OO | SMD ‐0.27 (‐0.75 to 0.22) | |
| Functional status (generic) various scales short‐term follow‐up | The mean functional status in the intervention groups was 0.15 standard deviations lower (0.64 lower to 0.33 higher) | 68 | ++OO | SMD ‐0.15 (‐0.64 to 0.33) | |
| Waiting list control | Combined behavioural therapy | ||||
| Pain intensity various scales short‐term follow‐up | The mean pain intensity in the intervention groups was 0.60 standard deviations lower (0.97 to 0.22 lower) | 239 | ++OO | SMD ‐0.60 (‐0.97 to ‐0.22) | |
| Functional status (generic) various scales short‐term follow‐up | The mean functional status in the intervention groups was 0.37 standard deviations lower (0.87 lower to 0.13 higher) | 134 | ++OO | SMD ‐0.37 (‐0.87 to 0.13) | |
| Depression Beck Depression Inventory (0‐63) short‐term follow‐up | The mean depression ranged across control groups from | The mean depression in the intervention groups was 1.92 points lower (6.16 lower to 2.32 higher) | 194 | +OOO | |
| CI: Confidence interval | |||||
| GRADE Working Group grades of evidence | |||||
| 1 Serious limitations in study design (i.e. >25% of participants from studies with high risk of bias) 2 Serious inconsistency of results (i.e. opposite direction of effects and/or significant statistical heterogeneity) 3 Serious imprecision (i.e. total number of participants <300 for each outcome) | |||||
| Comparisons among behavioural treatments for chronic low‐back pain | |||||
| Patient or population: adults with chronic low‐back pain Settings: primary and secondary health care centres Intervention: behavioural treatments (respondent, cognitive, and operant therapy, or a combination) Comparison: behavioural treatments (respondent, cognitive, and operant therapy, or a combination) | |||||
| Outcomes | Illustrative means (95% CI) | No of Participants | Quality of the evidence | Comments | |
| Control group | Intervention group | ||||
| Operant therapy | Cognitive therapy | ||||
| Pain intensity various scales short‐term follow‐up | The mean pain intensity in the intervention groups was 0.41 standard deviations higher (0.63 lower to 1.45 higher) | 93 | +++O | SMD 0.41 (‐0.63 to 1.45) | |
| Pain intensity various scales intermediate‐term follow‐up | The mean pain intensity in the intervention groups was 0.35 standard deviations higher (0.64 lower to 1.35 higher) | 82 | +++O | SMD 0.35 (‐0.64 to 1.35) | |
| Cognitive therapy | Combined behavioural therapy | ||||
| Pain intensity various scales short‐term follow‐up | The mean pain intensity in the intervention groups was 0.24 standard deviations lower (1.36 lower to 0.87 higher) | 61 | +OOO | SMD ‐0.24 (‐1.36 to 0.87) | |
| Pain intensity various scales intermediate‐term follow‐up | The mean pain intensity in the intervention groups was 0.3 standard deviations lower (2.59 lower to 1.98 higher) | 44 | +OOO | SMD ‐0.3 (‐2.59 to 1.98) | |
| Pain intensity various scales long‐term follow‐up | The mean pain intensity in the intervention groups was 0.89 standard deviations lower (3.64 lower to 1.87 higher) | 48 | +OOO | SMD ‐0.89 (‐3.64 to 1.87) | |
| Functional status (generic) Sickness Impact Profile (0‐136) short‐term follow‐up | The mean generic functional status ranged across control groups from | The mean functional status in the intervention groups was 2.01 points lower (10.02 lower to 5.99 higher) | 61 | ++OO | |
| Functional status (generic) Sickness Impact Profile (0‐136) intermediate‐term follow‐up | The mean generic functional status ranged across control groups from | The mean functional status in the intervention groups was 3.2 points lower (16.44 lower to 10.04 higher) | 47 | +OOO | |
| Functional status (generic) Sickness Impact Profile (0‐136) long‐term follow‐up | The mean generic functional status ranged across control groups from | The mean functional status in the intervention groups was 2.23 points lower (12.59 lower to 8.13 higher) | 51 | +OOO | |
| Depression Beck Depression Inventory (0‐63) short‐term follow‐up | The mean depression ranged across control groups from | The mean depression in the intervention groups was 3.1 points lower (11.43 lower to 5.23 higher) | 61 | +OOO | |
| Depression Beck Depression Inventory (0‐63) intermediate‐term follow‐up | The mean depression ranged across control groups from | The mean depression in the intervention groups was 4.66 points lower (10.94 lower to 1.61 higher) | 47 | ++OO | |
| Depression Beck Depression Inventory (0‐63) long‐term follow‐up | The mean depression ranged across control groups from | The mean depression in the intervention groups was 0.64 points lower (4.61 lower to 3.32 higher) | 51 | ++OO | |
| Operant therapy | Combined behavioural therapy | ||||
| Pain intensity various scales short‐term follow‐up | The mean pain intensity in the intervention groups was 0.15 standard deviations lower (0.46 lower to 0.16 higher) | 161 | +++O | SMD ‐0.15 (‐0.46 to 0.16) | |
| Pain intensity various scales intermediate‐term follow‐up | The mean pain intensity in the intervention groups was 0.23 standard deviations lower (0.57 lower to 0.11 higher) | 139 | +++O | SMD ‐0.23 (‐0.57 to 0.11) | |
| Pain intensity various scales long‐term follow‐up | The mean pain intensity in the intervention groups was 0.31 standard deviations lower (0.65 lower to 0.03 higher) | 140 | +++O | SMD ‐0.31 (‐0.65 to 0.03) | |
| Functional status (generic) various scales short‐term follow‐up | The mean functional status in the intervention groups was 0.21 standard deviations higher (0.24 lower to 0.67 higher) | 77 | ++OO | SMD 0.21 (‐0.24 to 0.67) | |
| Functional status (generic) various scales intermediate‐term follow‐up | The mean functional status in the intervention groups was 0.23 standard deviations lower (1.01 lower to 0.55 higher) | 61 | ++OO | SMD ‐0.23 (‐1.01 to 0.55) | |
| Functional status (generic) various scales long‐term follow‐up | The mean functional status in the intervention groups was 0.50 standard deviations lower (1.56 lower to 0.56 higher) | 66 | ++OO | SMD ‐0.50 (‐1.56 to 0.56) | |
| Respondent therapy | Combined behavioural therapy | ||||
| Pain intensity various scales short‐term follow‐up | The mean pain intensity in the intervention groups was 0.09 standard deviations higher (0.31 lower to 0.5 higher) | 97 | ++OO | SMD 0.09 (‐0.31 to 0.5) | |
| Pain intensity various scales intermediate‐term follow‐up | The mean pain intensity in the intervention groups was 0.47 standard deviations higher (0.42 lower to 1.35 higher) | 62 | ++OO | SMD 0.47 (‐0.42 to 1.35) | |
| Functional status (generic) various scales short‐term follow‐up | The mean functional status in the intervention groups was 0.38 standard deviations higher (0.02 lower to 0.78 higher) | 97 | ++OO | SMD 0.38 (‐0.02 to 0.78) | |
| Functional status (generic) various scales intermediate‐term follow‐up | The mean functional status in the intervention groups was 0.13 standard deviations higher (0.81 lower to 1.07 higher) | 62 | ++OO | SMD 0.13 (‐0.81 to 1.07) | |
| Depression Beck Depression Inventory (0‐63) short‐term follow‐up | The mean depression ranged across control groups from | The mean depression in the intervention groups was 2.89 points higher (0.55 to 5.24 higher) | 97 | ++OO | |
| Depression Beck Depression Inventory (0‐63) intermediate‐term follow‐up | The mean depression ranged across control groups from | The mean depression in the intervention groups was 1.84 points lower (0.43 lower to 4.11 higher) | 62 | ++OO | |
| CI: Confidence interval | |||||
| GRADE Working Group grades of evidence | |||||
| 1 Serious limitations in study design (i.e. >25% of participants from studies with high risk of bias) 2 Serious inconsistency of results (i.e. opposite direction of effects and/or significant statistical heterogeneity) 3 Serious imprecision (i.e. total number of participants <300 for each outcome) | |||||
| Behavioural treatment compared with other treatments for chronic low‐back pain | |||||
| Patient or population: adults with chronic low‐back pain Settings: primary or secondary health care settings Intervention: behavioural treatment (respondent, cognitive, and operant therapy, or a combination) Comparison: other chronic low‐back pain treatments (i.e. usual care, exercise, surgery) | |||||
| Outcomes | Illustrative means (95% CI) | No of Participants | Quality of the evidence | Comments | |
| Control group | Intervention group | ||||
| Usual care | Behavioural treatment | ||||
| Pain intensity VAS (0‐100) short‐term follow‐up | The mean pain intensity ranged across control groups from | The mean pain intensity in the intervention groups was 5.18 points lower (9.79 to 0.57 lower) | 330 | +++O | |
| Pain intensity VAS (0‐100) intermediate‐term follow‐up | The mean pain intensity ranged across control groups from | The mean pain intensity in the intervention groups was 4.29 points lower (9.28 lower to 0.69 higher) | 319 | +++O | |
| Functional status (back‐specific) various scales short‐term follow‐up | The mean back‐specific functional status in the intervention groups was 0.2 standard deviations lower (0.41 lower to 0.02 higher) | 330 | +++O | SMD ‐0.2 (‐0.41 to 0.02) | |
| Functional status (back‐specific) various scales intermediate‐term follow‐up | The mean back‐specific functional status in the intervention groups was 0.12 standard deviations lower (0.34 lower to 0.1 higher) | 319 | +++O | SMD ‐0.12 (‐0.34 to 0.1) | |
| Exercise | Behavioural treatment | ||||
| Pain intensity Pain Rating Index (0‐45) short‐term follow‐up | The mean pain intensity ranged across control groups from | The mean pain intensity in the intervention groups was 2.31 points lower (6.33 lower to 1.7 higher) | 146 | ++OO | |
| Pain intensity Pain Rating Index (0‐45) intermediate‐term follow‐up | The mean pain intensity ranged across control groups from | The mean pain intensity in the intervention groups was 1.18 points higher (3.16 lower to 5.53 higher) | 137 | +++O | |
| Pain intensity Pain Rating Index (0‐45) long‐term follow‐up | The mean pain intensity ranged across control groups from | The mean pain intensity in the intervention groups was 0.14 points higher (4.4 lower to 4.67 higher) | 136 | +++O | |
| Depression various scales short‐term follow‐up | The mean depression in the intervention groups was 0.25 standard deviations higher (0.07 lower to 0.58 higher) | 146 | ++OO | SMD 0.25 (‐0.07 to 0.58) | |
| Depression various scales intermediate‐term follow‐up | The mean depression in the intervention groups was 0.02 standard deviations higher (0.32 lower to 0.35 higher) | 137 | +++O | SMD 0.02 (‐0.32 to 0.35) | |
| Depression various scales long‐term follow‐up | The mean depression in the intervention groups was 0.07 standard deviations higher (0.27 lower to 0.41 higher) | 136 | +++O | SMD 0.07 (‐0.27 to 0.41) | |
| Surgery | Behavioural treatment | ||||
| Functional status (back specific) Oswestry Disability Index (0‐100) long‐term follow‐up | The mean back‐specific functional status ranged across control groups from | The mean back‐specific functional status in the intervention groups was 2.36 points higher (1.94 lower to 6.66 higher) | 345 | ++OO | |
| CI: Confidence interval | |||||
| GRADE Working Group grades of evidence | |||||
| 1 Serious limitations in study design (i.e. >25% of participants from studies with high risk of bias) 2 Serious inconsistency of results (i.e. opposite direction of effects and/or significant statistical heterogeneity) 3 Serious imprecision (i.e. total number of participants <300 for each outcome) 4 Serious indirectness (i.e. not directly applicable to all patients with chronic low‐back pain) | |||||
| Behavioural treatment in addition to other treatments for chronic low‐back pain | |||||
| Patient or population: adults with chronic low‐back pain Settings: primary, secondary, or tertiary health care settings Intervention: behavioural treatment (respondent, cognitive, and operant therapy, or a combination) in addition to another treatment Comparison: the other treatment alone | |||||
| Outcomes | Illustrative means (95% CI) | No of Participants | Quality of the evidence | Comments | |
| Control group | Intervention group | ||||
| Physiotherapy | Behavioural treatment + physiotherapy | ||||
| Pain intensity 5‐point scale short‐term follow‐up | The mean pain intensity ranged across control groups from | The mean pain intensity in the intervention groups was 0.13 points lower (1.01 lower to 0.75 higher) | 59 | ++OO | |
| Pain intensity 5‐point scale intermediate‐term follow‐up | The mean pain intensity ranged across control groups from | The mean pain intensity in the intervention groups was 0.11 points lower (0.67 lower to 0.44 higher) | 45 | ++OO | |
| Depression Beck Depression Inventory (0‐63) short‐term follow‐up | The mean depression ranged across control groups from | The mean depression in the intervention groups was 1.56 points higher (1.71 lower to 4.83 higher) | 59 | ++OO | |
| Depression Beck Depression Inventory (0‐63) intermediate‐term follow‐up | The mean depression ranged across control groups from | The mean depression in the intervention groups was 0.17 points higher (6.85 lower to 7.19 higher) | 50 | ++OO | |
| Functional status (generic) Sickness Impact Profile (0‐136) short‐term follow‐up | The mean generic functional status ranged across control groups from | The mean generic functional status in the intervention groups was 6.26 points lower (12.71 to 0.19 lower) | 59 | ++OO | |
| Functional status (generic) Sickness Impact Profile (0‐136) intermediate‐term follow‐up | The mean generic functional status ranged across control groups from | The mean generic functional status in the intervention groups was 0.93 points lower (6.71 lower to 4.84 higher) | 51 | ++OO | |
| Inpatient rehabilitation | Behavioural treatment + inpatient rehabilitation | ||||
| Pain intensity various scales short‐term follow‐up | The mean pain intensity in the intervention groups was 0.14 standard deviations lower (0.34 lower to 0.05 higher) | 405 | +++O | SMD ‐0.14 (‐0.34 to 0.05) | |
| CI: Confidence interval | |||||
| GRADE Working Group grades of evidence | |||||
| 1 Serious limitations in study design (i.e. >25% of participants from studies with high risk of bias) 2 Serious imprecision (i.e. total number of participants <300 for each outcome) | |||||
| Study | Patients | Interventions | Relevant outcomes | Size of effect | Benefit/Harms |
| Y | N | Y | N | ? | |
| Y | Y | Y | N | ? | |
| Y | Y | Y | N | ? | |
| Y | Y | Y | ? | ? | |
| Y | Y | N | ? | ? | |
| Y | Y | N | N | ? | |
| Y | Y | Y | ? | ? | |
| Y | Y | Y | Y | ? | |
| Y | Y | N | ? | ? | |
| Y | Y | Y | N | ? | |
| N | Y | Y | ? | ? | |
| Y | N | Y | N | ? | |
| N | Y | Y | ? | ? | |
| Y | Y | Y | ? | ? | |
| Y | Y | Y | N | ? | |
| Y | Y | Y | N | ? | |
| Y | Y | N | ? | ? | |
| Y | Y | Y | N | ? | |
| N | N | Y | N | ? | |
| Y | Y | Y | N | ? | |
| Y | Y | Y | Y | ? | |
| Y | Y | Y | ? | ? | |
| N | Y | Y | ? | ? | |
| Y | Y | Y | ? | ? | |
| Y | Y | Y | ? | ? | |
| Y | Y | Y | ? | ? | |
| Y | Y | Y | ? | ? | |
| Y | Y | Y | ? | ? | |
| Y | Y | Y | ? | Y | |
| Y | Y | Y | N | ? |
| Outcome or subgroup title | No. of studies | No. of participants | Statistical method | Effect size |
| 1 Pain (short‐term) Show forest plot | 3 | 74 | Mean Difference (IV, Random, 95% CI) | ‐19.77 [‐34.34, ‐5.20] |
| 2 Functional status (short term) Show forest plot | 3 | 74 | Std. Mean Difference (IV, Fixed, 95% CI) | ‐0.88 [‐1.36, ‐0.39] |
| 3 Depression (short term) Show forest plot | 2 | 58 | Mean Difference (IV, Random, 95% CI) | ‐6.80 [‐19.73, 6.12] |
| Outcome or subgroup title | No. of studies | No. of participants | Statistical method | Effect size |
| 1 Pain (short term) Show forest plot | 3 | 64 | Std. Mean Difference (IV, Fixed, 95% CI) | ‐0.80 [‐1.32, ‐0.28] |
| 2 Functional status (short term) Show forest plot | 2 | 44 | Std. Mean Difference (IV, Random, 95% CI) | ‐0.17 [‐1.56, 1.22] |
| Outcome or subgroup title | No. of studies | No. of participants | Statistical method | Effect size |
| 1 Pain (short term) Show forest plot | 3 | 153 | Std. Mean Difference (IV, Fixed, 95% CI) | ‐0.43 [‐0.75, ‐0.11] |
| 2 Functional status (short term) Show forest plot | 2 | 87 | Mean Difference (IV, Fixed, 95% CI) | ‐1.18 [‐3.53, 1.18] |
| 3 Depression (short term) Show forest plot | 2 | 103 | Std. Mean Difference (IV, Random, 95% CI) | ‐0.11 [‐0.67, 0.44] |
| Outcome or subgroup title | No. of studies | No. of participants | Statistical method | Effect size |
| 1 Pain (short term) Show forest plot | 2 | 68 | Std. Mean Difference (IV, Fixed, 95% CI) | ‐0.27 [‐0.75, 0.22] |
| 2 Functional status (short term) Show forest plot | 2 | 68 | Std. Mean Difference (IV, Fixed, 95% CI) | ‐0.15 [‐0.64, 0.33] |
| Outcome or subgroup title | No. of studies | No. of participants | Statistical method | Effect size |
| 1 Pain (short term) Show forest plot | 5 | 239 | Std. Mean Difference (IV, Random, 95% CI) | ‐0.60 [‐0.97, ‐0.22] |
| 2 Functional status (short term) Show forest plot | 4 | 134 | Std. Mean Difference (IV, Random, 95% CI) | ‐0.37 [‐0.87, 0.13] |
| 3 Depression (short term) Show forest plot | 4 | 194 | Mean Difference (IV, Random, 95% CI) | ‐1.92 [‐6.16, 2.32] |
| Outcome or subgroup title | No. of studies | No. of participants | Statistical method | Effect size |
| 1 Pain (short term) Show forest plot | 2 | 93 | Std. Mean Difference (IV, Random, 95% CI) | 0.41 [‐0.63, 1.45] |
| 2 Pain (intermediate term) Show forest plot | 2 | 82 | Std. Mean Difference (IV, Random, 95% CI) | 0.35 [‐0.64, 1.35] |
| Outcome or subgroup title | No. of studies | No. of participants | Statistical method | Effect size |
| 1 Pain (short‐term) Show forest plot | 2 | 61 | Std. Mean Difference (IV, Random, 95% CI) | ‐0.24 [‐1.36, 0.87] |
| 2 Pain (intermediate‐term) Show forest plot | 2 | 44 | Std. Mean Difference (IV, Random, 95% CI) | ‐0.30 [‐2.59, 1.98] |
| 3 Pain (long‐term) Show forest plot | 2 | 48 | Std. Mean Difference (IV, Random, 95% CI) | ‐0.89 [‐3.64, 1.87] |
| 4 Functional status (short‐term) Show forest plot | 2 | 61 | Mean Difference (IV, Random, 95% CI) | ‐2.01 [‐10.02, 5.99] |
| 5 Functional status (intermediate‐term) Show forest plot | 2 | 47 | Mean Difference (IV, Random, 95% CI) | ‐3.20 [‐16.44, 10.04] |
| 6 Functional status (long‐term) Show forest plot | 2 | 51 | Mean Difference (IV, Random, 95% CI) | ‐2.23 [‐12.59, 8.13] |
| 7 Depression (short‐term) Show forest plot | 2 | 61 | Mean Difference (IV, Random, 95% CI) | ‐3.10 [‐11.43, 5.23] |
| 8 Depression (intermediate‐term) Show forest plot | 2 | 47 | Mean Difference (IV, Random, 95% CI) | ‐4.66 [‐10.94, 1.61] |
| 9 Depression (long‐term) Show forest plot | 2 | 51 | Mean Difference (IV, Fixed, 95% CI) | ‐0.64 [‐4.61, 3.32] |
| Outcome or subgroup title | No. of studies | No. of participants | Statistical method | Effect size |
| 1 Pain (short‐term) Show forest plot | 3 | 161 | Std. Mean Difference (IV, Fixed, 95% CI) | ‐0.15 [‐0.46, 0.16] |
| 2 Pain (intermediate‐term) Show forest plot | 3 | 139 | Std. Mean Difference (IV, Fixed, 95% CI) | ‐0.23 [‐0.57, 0.11] |
| 3 Pain (long‐term) Show forest plot | 3 | 140 | Std. Mean Difference (IV, Fixed, 95% CI) | ‐0.31 [‐0.65, 0.03] |
| 4 Functional status (short‐term) Show forest plot | 2 | 77 | Std. Mean Difference (IV, Fixed, 95% CI) | 0.21 [‐0.24, 0.67] |
| 5 Functional status (intermediate‐term) Show forest plot | 2 | 61 | Std. Mean Difference (IV, Random, 95% CI) | ‐0.23 [‐1.01, 0.55] |
| 6 Functional status (long‐term) Show forest plot | 2 | 66 | Std. Mean Difference (IV, Random, 95% CI) | ‐0.50 [‐1.56, 0.56] |
| Outcome or subgroup title | No. of studies | No. of participants | Statistical method | Effect size |
| 1 Pain (short term) Show forest plot | 3 | 97 | Std. Mean Difference (IV, Fixed, 95% CI) | 0.09 [‐0.31, 0.50] |
| 2 Pain (intermediate term) Show forest plot | 2 | 62 | Std. Mean Difference (IV, Random, 95% CI) | 0.47 [‐0.42, 1.35] |
| 3 Functional status (short term) Show forest plot | 3 | 97 | Std. Mean Difference (IV, Fixed, 95% CI) | 0.38 [‐0.02, 0.78] |
| 4 Functional status (intermediate term) Show forest plot | 2 | 62 | Std. Mean Difference (IV, Random, 95% CI) | 0.13 [‐0.81, 1.07] |
| 5 Depression (short term) Show forest plot | 3 | 97 | Mean Difference (IV, Fixed, 95% CI) | 2.89 [0.55, 5.24] |
| 6 Depression (intermediate term) Show forest plot | 2 | 62 | Mean Difference (IV, Fixed, 95% CI) | 1.84 [‐0.43, 4.11] |
| Outcome or subgroup title | No. of studies | No. of participants | Statistical method | Effect size |
| 1 Pain (short term) Show forest plot | 2 | 330 | Mean Difference (IV, Fixed, 95% CI) | ‐5.18 [‐9.79, ‐0.57] |
| 2 Pain (intermediate term) Show forest plot | 2 | 319 | Mean Difference (IV, Fixed, 95% CI) | ‐4.29 [‐9.28, 0.69] |
| 3 Back specific functional status (short term) Show forest plot | 2 | 330 | Std. Mean Difference (IV, Fixed, 95% CI) | ‐0.20 [‐0.41, 0.02] |
| 4 Back specific functional status (intermediate term) Show forest plot | 2 | 319 | Std. Mean Difference (IV, Fixed, 95% CI) | ‐0.12 [‐0.34, 0.10] |
| Outcome or subgroup title | No. of studies | No. of participants | Statistical method | Effect size |
| 1 Pain (short term) Show forest plot | 2 | 146 | Mean Difference (IV, Fixed, 95% CI) | ‐2.31 [‐6.33, 1.70] |
| 2 Pain (intermediate term) Show forest plot | 2 | 137 | Mean Difference (IV, Fixed, 95% CI) | 1.18 [‐3.16, 5.53] |
| 3 Pain (long term) Show forest plot | 2 | 136 | Mean Difference (IV, Fixed, 95% CI) | 0.14 [‐4.40, 4.67] |
| 4 Depression (short term) Show forest plot | 2 | 146 | Std. Mean Difference (IV, Fixed, 95% CI) | 0.25 [‐0.07, 0.58] |
| 5 Depression (intermediate term) Show forest plot | 2 | 137 | Std. Mean Difference (IV, Fixed, 95% CI) | 0.02 [‐0.32, 0.35] |
| 6 Depression (long term) Show forest plot | 2 | 136 | Std. Mean Difference (IV, Fixed, 95% CI) | 0.07 [‐0.27, 0.41] |
| Outcome or subgroup title | No. of studies | No. of participants | Statistical method | Effect size |
| 1 Back specific functional status (long term) Show forest plot | 2 | 345 | Mean Difference (IV, Fixed, 95% CI) | 2.36 [‐1.94, 6.66] |
| Outcome or subgroup title | No. of studies | No. of participants | Statistical method | Effect size |
| 1 Pain intensity (short term) Show forest plot | 2 | 59 | Mean Difference (IV, Random, 95% CI) | ‐0.13 [‐1.01, 0.75] |
| 2 Pain Intensity (intermediate term) Show forest plot | 2 | 45 | Mean Difference (IV, Fixed, 95% CI) | ‐0.11 [‐0.67, 0.44] |
| 3 Depression (short term) Show forest plot | 2 | 59 | Mean Difference (IV, Fixed, 95% CI) | 1.56 [‐1.71, 4.83] |
| 4 Depression (intermediate term) Show forest plot | 2 | 50 | Mean Difference (IV, Random, 95% CI) | 0.17 [‐6.85, 7.19] |
| 5 Functional status (short term) Show forest plot | 2 | 59 | Mean Difference (IV, Fixed, 95% CI) | ‐6.26 [‐12.71, 0.19] |
| 6 Functional status (intermediate term) Show forest plot | 2 | 51 | Mean Difference (IV, Fixed, 95% CI) | ‐0.93 [‐6.71, 4.84] |
| Outcome or subgroup title | No. of studies | No. of participants | Statistical method | Effect size |
| 1 Pain intensity (short term) Show forest plot | 2 | 405 | Std. Mean Difference (IV, Fixed, 95% CI) | ‐0.14 [‐0.34, 0.05] |