Terapia conductual para el dolor lumbar crónico
Appendices
Appendix 1. Risk of Bias assessment criteria
| Criteria for a judgment of "yes" for the sources of risk of bias | |
| Method of randomisation | A random (unpredictable) assignment sequence. Examples of adequate methods are computer generated random sequence and pre‐ordered sealed envelopes. Methods of allocation using date of birth, social insurance/security number, date in which they are invited to participate in the study, or alternation will not be regarded as appropriate. |
| Concealment of treatment allocation | Assignment generated by an independent person not responsible for determining the eligibility of the patients. This person has no information about the persons included in the trial and has no influence on the assignment sequence or on the decision about eligibility of the patient. |
| Blinding of patients | The index and control groups are indistinguishable for the patients or the success of blinding was tested among the patients and it was successful. |
| Blinding of care providers | The index and control groups are indistinguishable for the care providers or the success of blinding was tested among the care providers and it was successful. |
| Blinding of outcome assessment | Item has a positive score if the outcome assessors are blinded regarding treatment allocation and the blinding is evaluated and adequate. If only self‐reported (by the patients) outcome measures are used the blinding procedure is adequate for outcome assessors if participant blinding is scored "yes". |
| Incomplete outcome data addressed (drop‐outs) | The number of participants who were included in the study but did not complete the observation period or were not included in the analysis must be described and reasons given. If the percentage of withdrawals and drop‐outs does not exceed 20% for short‐term follow‐up and 30% for long‐term follow‐up, and does not lead to substantial bias, a "yes" is scored. |
| Incomplete outcome data addressed (intention‐to‐treat analysis) | All randomised patients are reported/analysed in the group they were allocated to by randomisation for the most important moments of effect measurement (minus missing values) irrespective of non‐compliance and co‐interventions. |
| Free of selective reporting | The review author determines if all the results from all pre‐specified outcomes have been adequately reported in the published report of the trial. This information is either obtained by comparing the protocol and the report, or in the absence of the protocol, assessing that the published report includes enough information to make this judgment. |
| Similarity of baseline characteristics | Item has a positive score if the study groups are comparable at baseline for the most important prognostic factors (for example, demographic factors, duration and severity of complaints, and value of main outcome measures). |
| Co‐interventions avoided or similar | Item has a positive score if co‐interventions are avoided in the study design or are similar among the intervention groups. |
| Compliance | The reviewer determines if the compliance with the interventions is acceptable, based on the reported intensity, duration, number and frequency of sessions for both the index intervention and control intervention(s). |
| Timing of outcome assessments | Timing of outcome assessment should be identical for all intervention groups and for all important outcome assessments. |
Appendix 2. Electronic database searches
MEDLINE
1. randomised controlled trial.pt.
2. controlled clinical trial.pt.
3. randomized.ab.
4. placebo.ab,ti.
5. drug therapy.fs.
6. randomly.ab,ti.
7. trial.ab,ti.
8. groups.ab,ti.
9. or/1‐8
10. (animals not (humans and animals)).sh.
11. 9 not 10
12. dorsalgia.ti,ab.
13. exp Back Pain/
14. backache.ti,ab.
15. exp Low Back Pain/
16. (lumbar adj pain).ti,ab.
17. coccyx.ti,ab.
18. coccydynia.ti,ab.
19. sciatica.ti,ab.
20. sciatica/
21. spondylosis.ti,ab.
22. lumbago.ti,ab.
23. or/12‐22
24. exp Behavior Therapy/
25. Conditioning, Operant/
26. exp "Reinforcement (Psychology)"/
27. behavior therapy.mp.
28. operant conditioning.mp.
29. respondent treatment.mp.
30. behavioral therapy.mp.
31. behavioural therapy.mp.
32. Cognitive Therapy/
33. cognitive therapy.mp.
34. cognitive treatment.mp.
35. behavior treatment.mp.
36. relaxation.mp. or exp Relaxation/
37. graded activity.mp.
38. or/24‐37
39. 38 and 11 and 23
40. 39
41. limit 40 to yr="2007 ‐ 2009"
EMBASE
1. Clinical Article/
2. exp Clinical Study/
3. Clinical Trial/
4. Controlled Study/
5. Randomized Controlled Trial/
6. Major Clinical Study/
7. Double Blind Procedure/
8. Multicenter Study/
9. Single Blind Procedure/
10. Phase 3 Clinical Trial/
11. Phase 4 Clinical Trial/
12. crossover procedure/
13. placebo/
14. or/1‐13
15. allocat$.mp.
16. assign$.mp.
17. blind$.mp.
18. (clinic$ adj25 (study or trial)).mp.
19. compar$.mp.
20. control$.mp.
21. cross?over.mp.
22. factorial$.mp.
23. follow?up.mp.
24. placebo$.mp.
25. prospectiv$.mp.
26. random$.mp.
27. ((singl$ or doubl$ or trebl$ or tripl$) adj25 (blind$ or mask$)).mp.
28. trial.mp.
29. (versus or vs).mp.
30. or/15‐29
31. 14 and 30
32. human/
33. Nonhuman/
34. exp ANIMAL/
35. Animal Experiment/
36. 33 or 34 or 35
37. 32 not 36
38. 31 not 36
39. 37 and 38
40. 38 or 39
41. dorsalgia.mp.
42. back pain.mp.
43. exp BACKACHE/
44. (lumbar adj pain).mp.
45. coccyx.mp.
46. coccydynia.mp.
47. sciatica.mp.
48. exp ISCHIALGIA/
49. spondylosis.mp.
50. lumbago.mp.
51. exp Low Back Pain/
52. or/41‐51
53. exp Behavior Therapy/
54. exp Cognitive Therapy/
55. exp CONDITIONING/
56. behavior therapy.mp.
57. behavior treatment.mp.
58. behavioural therapy.mp.
59. behavioural treatment.mp.
60. cognitive therapy.mp.
61. cognitive treatment.mp.
62. exp instrumental conditioning/
63. operant conditioning.mp.
64. operant treatment.mp.
65. relaxation.mp.
66. or/53‐65
67. 40 and 52 and 66
68. 67
69. limit 68 to yr="2007 ‐ 2009"
CINAHL
S58 S56 and S41 and S23 Limiters ‐ Published Date from: 200701‐200912
S57 S56 and S41 and S23
S56 S55 or S54 or S53 or S52 or S51 or S50 or S49 or S48 or S47 or S46 or S45 or S44 or S43 or S42
S55
S54 ("relaxation") or (MH "Relaxation")
S53 "behavioural treatment"
S52 "behavioral treatment"
S51 "behavioural therapy"
S50 "behavioral therapy"
S49 "respondent treatment"
S48 "operant conditioning"
S47 "behaviour therapy"
S46 "behavior therapy"
S45 (MH "Cognitive Therapy")
S44 (MH "Reinforcement (Psychology)+")
S43 (MH "Conditioning (Psychology)")
S42 (MH "Behavior Therapy+")
S41 S40 or S39 or S38 or S37 or S36 or S35 or S34 or S33 or S32 or S31 or S30 or S29 or S28 or S27 or S26 or S25 or S24
S40 "lumbago"
S39 (MH "Spondylolysis")
S38 (MH "Spondylolisthesis")
S37 (MH "Thoracic Vertebrae")
S36 (MH "Lumbar Vertebrae")
S35 coccydynia
S34 "sciatica"
S33 "coccyx"
S32 (MH "Sciatica")
S31 (MH "Coccyx")
S30 "lumbar N5 pain"
S29 ""lumbarW1pain""
S28 "lumbar W1 pain"
S27 "backache"
S26 (MH "Low Back Pain")
S25 (MH "Back Pain+")
S24 dorsalgia
S23 S21 not S22
S22 (MH "Animals+")
S21 S20 or S19 or S18 or S17 or S16 or S15 or S14 or S13 or S12 or S11 or S10 or S9 or S8 or S7 or S6 or S5 or S4 or S3 or S2 or S1
S20 "volunteer*"
S19 prospectiv*
S18 "control*"
S17 "follow‐up stud*"
S16 (MH "Prospective Studies+")
S15 (MH "Evaluation Research+")
S14 (MH "Comparative Studies")
S13 "latin square"
S12 (MH "Study Design+")
S11 (MH "Random Sample+")
S10 "random*"
S9 "placebo*"
S8 (MH "Placebos")
S7 (MH "Placebo Effect")
S6 "triple‐blind"
S5 "single‐blind"
S4 "double‐blind"
S3 ""clinical W8 trial""
S2 "randomi?ed controlled trial*"
S1 (MH "Clinical Trials+")
PsycINFO
((DE=("relaxation therapy" or "behavior therapy" or "relaxation")) or (DE=("conditioning" or "operant conditioning" or "behavior therapy")) or (DE=("behavior therapy" or "behavior modification" or "psychotherapy" or "cognitive behavior therapy"))) AND ((KW=(Randomi?ed controlled trial*) OR KW=(clinical trial*) OR KW=(clin* near trail*) OR KW= (sing* near blind*) OR KW=(sing* near mask*) OR (doub* near blind*) OR KW=(doubl* NEAR mask*) OR KW=(trebl* near mask*) OR KW=(trebl* near mask*) OR KW=(tripl* near blind*) OR KW=(tripl* near mask*) OR KW=(placebo*) OR KW=(random*) OR DE=(research design) OR KW=(Latin square) OR KW=(comparative stud*) OR KW=(evaluation stud*) OR KW=(follow up stud*) OR DE=(prospective stud*)OR KW=(control*) OR KW=(prospective*) OR KW=(volunteer*)) AND (DE=(back) OR DE=(back pain) OR DE=(neck)))
Date Range: 2007‐2009
Cochrane Back Review Group Trials Register
1. behav\*
2. cognit\*
3. relax\*
4. graded activity
5. reinforcement
6. respondent
February 2009

Summary of risks of bias for each included study

Comparison 1 Respondent therapy (progressive relaxation) versus waiting list control, Outcome 1 Pain (short‐term).
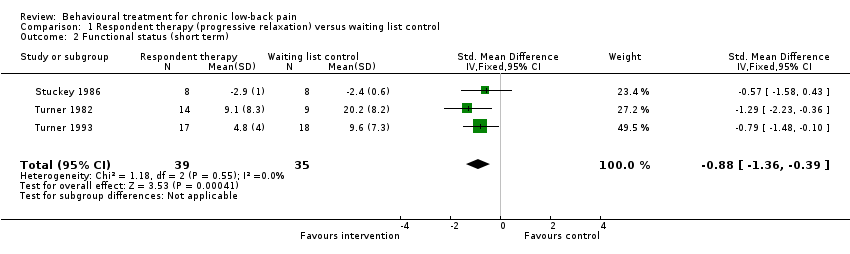
Comparison 1 Respondent therapy (progressive relaxation) versus waiting list control, Outcome 2 Functional status (short term).
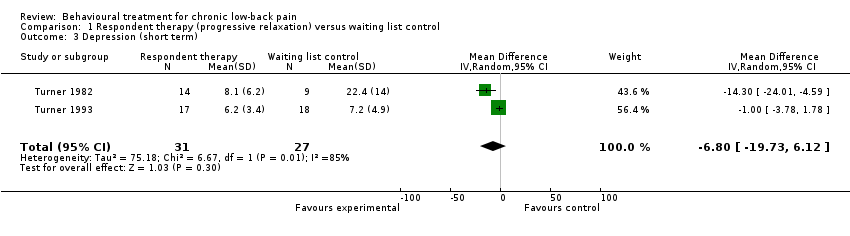
Comparison 1 Respondent therapy (progressive relaxation) versus waiting list control, Outcome 3 Depression (short term).

Comparison 2 Respondent therapy (EMG biofeedback) versus waiting list control, Outcome 1 Pain (short term).
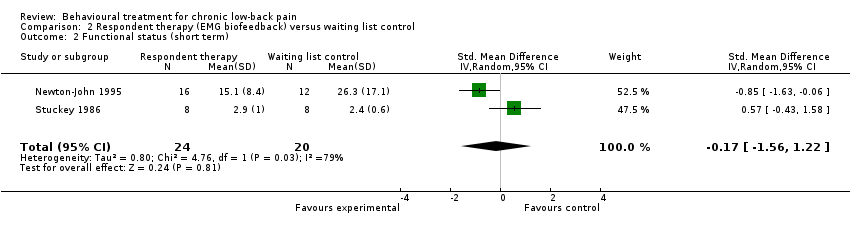
Comparison 2 Respondent therapy (EMG biofeedback) versus waiting list control, Outcome 2 Functional status (short term).

Comparison 3 Operant therapy versus waiting list control, Outcome 1 Pain (short term).

Comparison 3 Operant therapy versus waiting list control, Outcome 2 Functional status (short term).
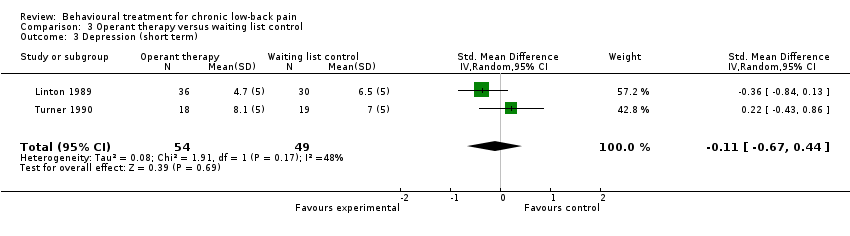
Comparison 3 Operant therapy versus waiting list control, Outcome 3 Depression (short term).

Comparison 4 Cognitive therapy versus waiting list control, Outcome 1 Pain (short term).

Comparison 4 Cognitive therapy versus waiting list control, Outcome 2 Functional status (short term).

Comparison 5 Cognitive‐behavioural therapy versus waiting list control, Outcome 1 Pain (short term).
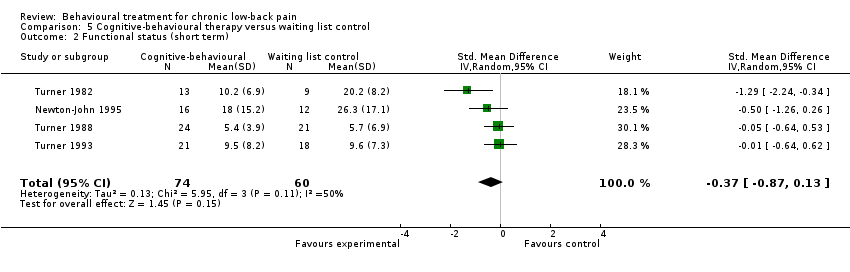
Comparison 5 Cognitive‐behavioural therapy versus waiting list control, Outcome 2 Functional status (short term).
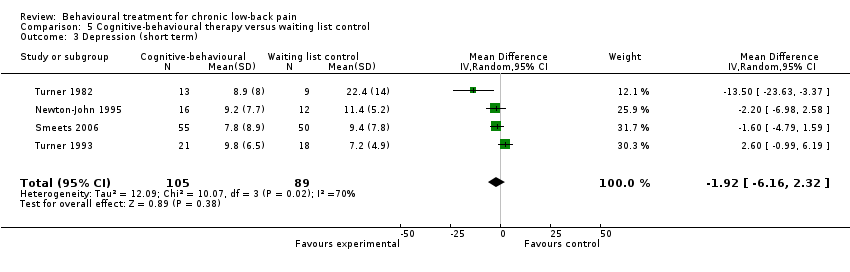
Comparison 5 Cognitive‐behavioural therapy versus waiting list control, Outcome 3 Depression (short term).

Comparison 6 Cognitive therapy versus operant therapy, Outcome 1 Pain (short term).

Comparison 6 Cognitive therapy versus operant therapy, Outcome 2 Pain (intermediate term).

Comparison 7 Cognitive‐behavioural therapy versus cognitive therapy, Outcome 1 Pain (short‐term).

Comparison 7 Cognitive‐behavioural therapy versus cognitive therapy, Outcome 2 Pain (intermediate‐term).
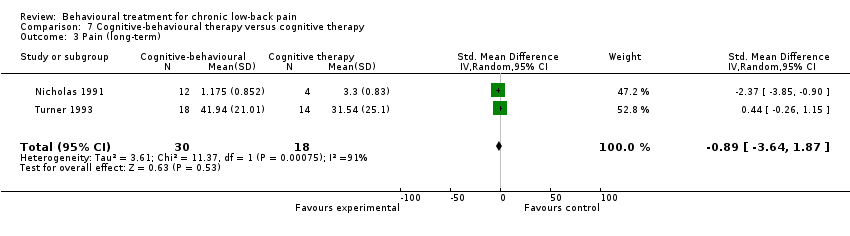
Comparison 7 Cognitive‐behavioural therapy versus cognitive therapy, Outcome 3 Pain (long‐term).
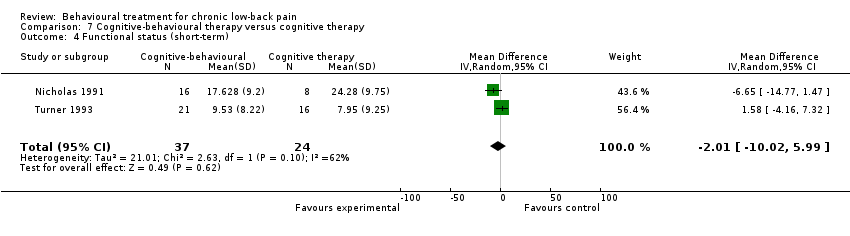
Comparison 7 Cognitive‐behavioural therapy versus cognitive therapy, Outcome 4 Functional status (short‐term).

Comparison 7 Cognitive‐behavioural therapy versus cognitive therapy, Outcome 5 Functional status (intermediate‐term).

Comparison 7 Cognitive‐behavioural therapy versus cognitive therapy, Outcome 6 Functional status (long‐term).

Comparison 7 Cognitive‐behavioural therapy versus cognitive therapy, Outcome 7 Depression (short‐term).
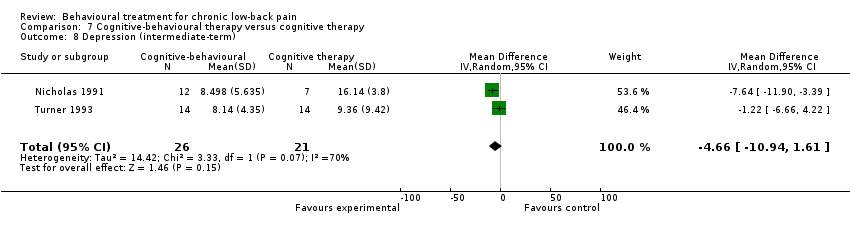
Comparison 7 Cognitive‐behavioural therapy versus cognitive therapy, Outcome 8 Depression (intermediate‐term).

Comparison 7 Cognitive‐behavioural therapy versus cognitive therapy, Outcome 9 Depression (long‐term).

Comparison 8 Cognitive‐behavioural therapy versus operant therapy, Outcome 1 Pain (short‐term).

Comparison 8 Cognitive‐behavioural therapy versus operant therapy, Outcome 2 Pain (intermediate‐term).

Comparison 8 Cognitive‐behavioural therapy versus operant therapy, Outcome 3 Pain (long‐term).
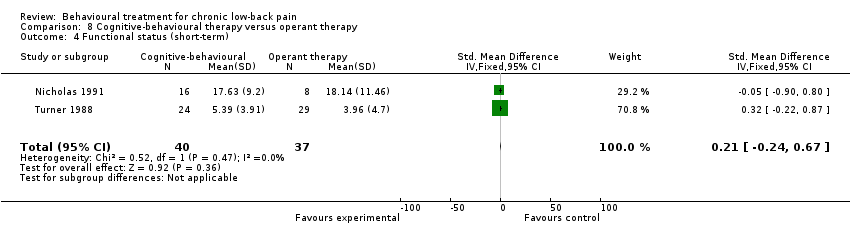
Comparison 8 Cognitive‐behavioural therapy versus operant therapy, Outcome 4 Functional status (short‐term).

Comparison 8 Cognitive‐behavioural therapy versus operant therapy, Outcome 5 Functional status (intermediate‐term).

Comparison 8 Cognitive‐behavioural therapy versus operant therapy, Outcome 6 Functional status (long‐term).
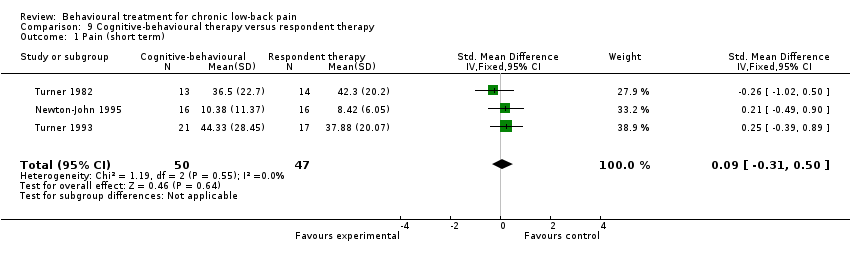
Comparison 9 Cognitive‐behavioural therapy versus respondent therapy, Outcome 1 Pain (short term).
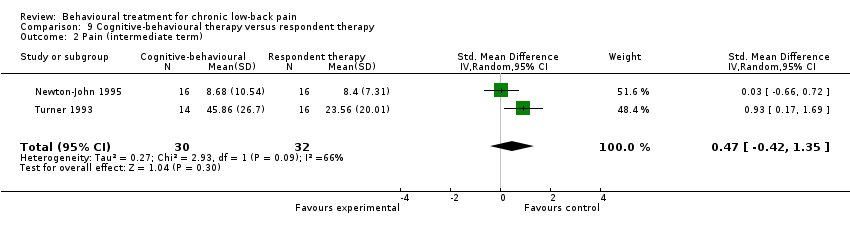
Comparison 9 Cognitive‐behavioural therapy versus respondent therapy, Outcome 2 Pain (intermediate term).

Comparison 9 Cognitive‐behavioural therapy versus respondent therapy, Outcome 3 Functional status (short term).

Comparison 9 Cognitive‐behavioural therapy versus respondent therapy, Outcome 4 Functional status (intermediate term).

Comparison 9 Cognitive‐behavioural therapy versus respondent therapy, Outcome 5 Depression (short term).

Comparison 9 Cognitive‐behavioural therapy versus respondent therapy, Outcome 6 Depression (intermediate term).
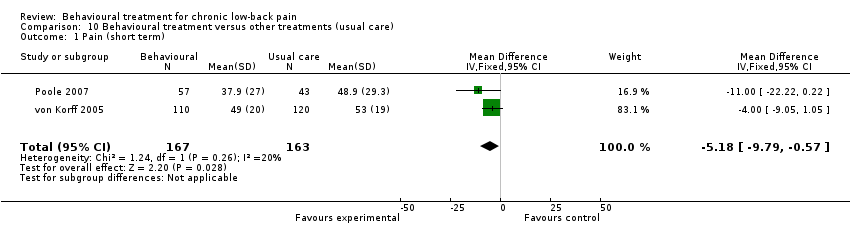
Comparison 10 Behavioural treatment versus other treatments (usual care), Outcome 1 Pain (short term).
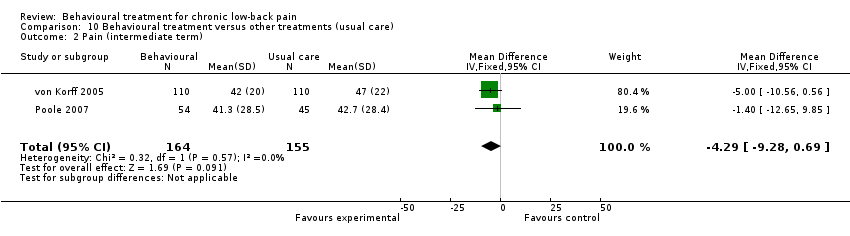
Comparison 10 Behavioural treatment versus other treatments (usual care), Outcome 2 Pain (intermediate term).

Comparison 10 Behavioural treatment versus other treatments (usual care), Outcome 3 Back specific functional status (short term).

Comparison 10 Behavioural treatment versus other treatments (usual care), Outcome 4 Back specific functional status (intermediate term).

Comparison 11 Behavioural treatment versus other treatments (group exercise), Outcome 1 Pain (short term).
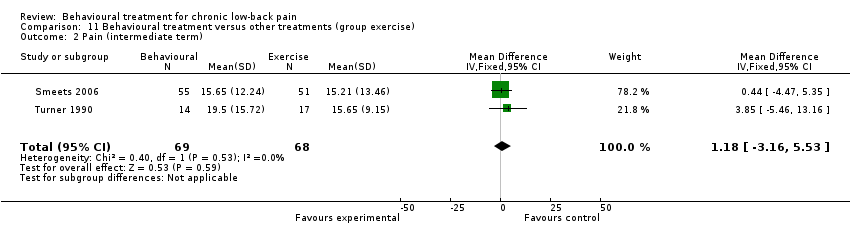
Comparison 11 Behavioural treatment versus other treatments (group exercise), Outcome 2 Pain (intermediate term).

Comparison 11 Behavioural treatment versus other treatments (group exercise), Outcome 3 Pain (long term).

Comparison 11 Behavioural treatment versus other treatments (group exercise), Outcome 4 Depression (short term).

Comparison 11 Behavioural treatment versus other treatments (group exercise), Outcome 5 Depression (intermediate term).

Comparison 11 Behavioural treatment versus other treatments (group exercise), Outcome 6 Depression (long term).

Comparison 12 Behavioural treatment versus other treatments (surgery), Outcome 1 Back specific functional status (long term).

Comparison 13 Behavioural treatment in addition to physiotherapy versus physiotherapy, Outcome 1 Pain intensity (short term).

Comparison 13 Behavioural treatment in addition to physiotherapy versus physiotherapy, Outcome 2 Pain Intensity (intermediate term).
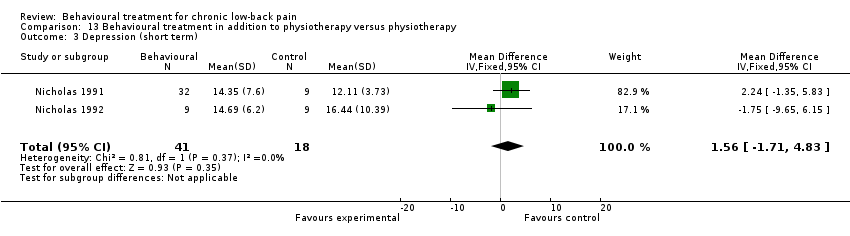
Comparison 13 Behavioural treatment in addition to physiotherapy versus physiotherapy, Outcome 3 Depression (short term).

Comparison 13 Behavioural treatment in addition to physiotherapy versus physiotherapy, Outcome 4 Depression (intermediate term).

Comparison 13 Behavioural treatment in addition to physiotherapy versus physiotherapy, Outcome 5 Functional status (short term).

Comparison 13 Behavioural treatment in addition to physiotherapy versus physiotherapy, Outcome 6 Functional status (intermediate term).

Comparison 14 Behavioural treatment in addition to inpatient rehabilitation versus inpatient rehabilitation, Outcome 1 Pain intensity (short term).
| Behavioural treatment compared with waiting list control for chronic low‐back pain | |||||
| Patient or population: adults with chronic low‐back pain Settings: primary and secondary health care centres Intervention: behavioural treatment (respondent, cognitive, and operant therapy, or a combination) Comparison: waiting list control | |||||
| Outcomes | Illustrative means (95% CI) | No of Participants | Quality of the evidence | Comments | |
| Control group | Intervention group | ||||
| Waiting list control | Respondent therapy (progressive relaxation) | ||||
| Pain intensity VAS scale (0‐100) short‐term follow‐up | The mean pain intensity ranged across control groups from | The mean pain intensity in the intervention groups was 19.77 points lower (34.34 to 5.2 lower) | 74 | ++OO | |
| Functional status (generic) various scales short‐term follow‐up | The mean generic functional status in the intervention groups was 0.88 standard deviations lower (1.36 to 0.39 lower) | 74 | ++OO | SMD ‐0.88 (‐1.36 to ‐0.39) | |
| Depression Beck Depression Inventory (0‐63) short‐term follow‐up | The mean depression ranged across control groups from | The mean depression in the intervention groups was 6.8 points lower (19.73 lower to 6.12 higher) | 58 | +OOO | |
| Waiting list control | Respondent therapy (EMG biofeedback) | ||||
| Pain intensity various scales short‐term follow‐up | The mean pain intensity in the intervention groups was 0.8 standard deviations lower (1.32 to 0.28 lower) | 64 | ++OO | SMD ‐0.8 (‐1.32 to ‐0.28) | |
| Functional status (generic) various scales short‐term follow‐up | The mean functional status in the intervention groups was 0.17 standard deviations lower (1.56 lower to 1.22 higher) | 44 | +OOO | SMD ‐0.17 (‐1.56 to 1.22) | |
| Waiting list control | Operant therapy | ||||
| Pain intensity various scales short‐term follow‐up | The mean pain intensity in the intervention groups was 0.43 standard deviations lower (0.75 to 0.11 lower) | 153 | +++O | SMD ‐0.43 (‐0.75 to ‐0.11) | |
| Functional status (generic) Sickness Impact Profile (0‐136) short‐term follow‐up | The mean generic functional status ranged across control groups from | The mean functional status in the intervention groups was 1.18 points lower (3.53 lower to 1.18 higher) | 87 | ++OO | |
| Depression various scales short‐term follow‐up | The mean depression in the intervention groups was 0.11 standard deviations lower (0.67 lower to 0.44 higher) | 103 | ++OO | SMD ‐0.11 (‐0.67 to 0.44) | |
| Waiting list control | Cognitive therapy | ||||
| Pain intensity various scales short‐term follow‐up | The mean pain intensity in the intervention groups was 0.27 standard deviations lower (0.75 lower to 0.22 higher) | 68 | ++OO | SMD ‐0.27 (‐0.75 to 0.22) | |
| Functional status (generic) various scales short‐term follow‐up | The mean functional status in the intervention groups was 0.15 standard deviations lower (0.64 lower to 0.33 higher) | 68 | ++OO | SMD ‐0.15 (‐0.64 to 0.33) | |
| Waiting list control | Combined behavioural therapy | ||||
| Pain intensity various scales short‐term follow‐up | The mean pain intensity in the intervention groups was 0.60 standard deviations lower (0.97 to 0.22 lower) | 239 | ++OO | SMD ‐0.60 (‐0.97 to ‐0.22) | |
| Functional status (generic) various scales short‐term follow‐up | The mean functional status in the intervention groups was 0.37 standard deviations lower (0.87 lower to 0.13 higher) | 134 | ++OO | SMD ‐0.37 (‐0.87 to 0.13) | |
| Depression Beck Depression Inventory (0‐63) short‐term follow‐up | The mean depression ranged across control groups from | The mean depression in the intervention groups was 1.92 points lower (6.16 lower to 2.32 higher) | 194 | +OOO | |
| CI: Confidence interval | |||||
| GRADE Working Group grades of evidence | |||||
| 1 Serious limitations in study design (i.e. >25% of participants from studies with high risk of bias) 2 Serious inconsistency of results (i.e. opposite direction of effects and/or significant statistical heterogeneity) 3 Serious imprecision (i.e. total number of participants <300 for each outcome) | |||||
| Comparisons among behavioural treatments for chronic low‐back pain | |||||
| Patient or population: adults with chronic low‐back pain Settings: primary and secondary health care centres Intervention: behavioural treatments (respondent, cognitive, and operant therapy, or a combination) Comparison: behavioural treatments (respondent, cognitive, and operant therapy, or a combination) | |||||
| Outcomes | Illustrative means (95% CI) | No of Participants | Quality of the evidence | Comments | |
| Control group | Intervention group | ||||
| Operant therapy | Cognitive therapy | ||||
| Pain intensity various scales short‐term follow‐up | The mean pain intensity in the intervention groups was 0.41 standard deviations higher (0.63 lower to 1.45 higher) | 93 | +++O | SMD 0.41 (‐0.63 to 1.45) | |
| Pain intensity various scales intermediate‐term follow‐up | The mean pain intensity in the intervention groups was 0.35 standard deviations higher (0.64 lower to 1.35 higher) | 82 | +++O | SMD 0.35 (‐0.64 to 1.35) | |
| Cognitive therapy | Combined behavioural therapy | ||||
| Pain intensity various scales short‐term follow‐up | The mean pain intensity in the intervention groups was 0.24 standard deviations lower (1.36 lower to 0.87 higher) | 61 | +OOO | SMD ‐0.24 (‐1.36 to 0.87) | |
| Pain intensity various scales intermediate‐term follow‐up | The mean pain intensity in the intervention groups was 0.3 standard deviations lower (2.59 lower to 1.98 higher) | 44 | +OOO | SMD ‐0.3 (‐2.59 to 1.98) | |
| Pain intensity various scales long‐term follow‐up | The mean pain intensity in the intervention groups was 0.89 standard deviations lower (3.64 lower to 1.87 higher) | 48 | +OOO | SMD ‐0.89 (‐3.64 to 1.87) | |
| Functional status (generic) Sickness Impact Profile (0‐136) short‐term follow‐up | The mean generic functional status ranged across control groups from | The mean functional status in the intervention groups was 2.01 points lower (10.02 lower to 5.99 higher) | 61 | ++OO | |
| Functional status (generic) Sickness Impact Profile (0‐136) intermediate‐term follow‐up | The mean generic functional status ranged across control groups from | The mean functional status in the intervention groups was 3.2 points lower (16.44 lower to 10.04 higher) | 47 | +OOO | |
| Functional status (generic) Sickness Impact Profile (0‐136) long‐term follow‐up | The mean generic functional status ranged across control groups from | The mean functional status in the intervention groups was 2.23 points lower (12.59 lower to 8.13 higher) | 51 | +OOO | |
| Depression Beck Depression Inventory (0‐63) short‐term follow‐up | The mean depression ranged across control groups from | The mean depression in the intervention groups was 3.1 points lower (11.43 lower to 5.23 higher) | 61 | +OOO | |
| Depression Beck Depression Inventory (0‐63) intermediate‐term follow‐up | The mean depression ranged across control groups from | The mean depression in the intervention groups was 4.66 points lower (10.94 lower to 1.61 higher) | 47 | ++OO | |
| Depression Beck Depression Inventory (0‐63) long‐term follow‐up | The mean depression ranged across control groups from | The mean depression in the intervention groups was 0.64 points lower (4.61 lower to 3.32 higher) | 51 | ++OO | |
| Operant therapy | Combined behavioural therapy | ||||
| Pain intensity various scales short‐term follow‐up | The mean pain intensity in the intervention groups was 0.15 standard deviations lower (0.46 lower to 0.16 higher) | 161 | +++O | SMD ‐0.15 (‐0.46 to 0.16) | |
| Pain intensity various scales intermediate‐term follow‐up | The mean pain intensity in the intervention groups was 0.23 standard deviations lower (0.57 lower to 0.11 higher) | 139 | +++O | SMD ‐0.23 (‐0.57 to 0.11) | |
| Pain intensity various scales long‐term follow‐up | The mean pain intensity in the intervention groups was 0.31 standard deviations lower (0.65 lower to 0.03 higher) | 140 | +++O | SMD ‐0.31 (‐0.65 to 0.03) | |
| Functional status (generic) various scales short‐term follow‐up | The mean functional status in the intervention groups was 0.21 standard deviations higher (0.24 lower to 0.67 higher) | 77 | ++OO | SMD 0.21 (‐0.24 to 0.67) | |
| Functional status (generic) various scales intermediate‐term follow‐up | The mean functional status in the intervention groups was 0.23 standard deviations lower (1.01 lower to 0.55 higher) | 61 | ++OO | SMD ‐0.23 (‐1.01 to 0.55) | |
| Functional status (generic) various scales long‐term follow‐up | The mean functional status in the intervention groups was 0.50 standard deviations lower (1.56 lower to 0.56 higher) | 66 | ++OO | SMD ‐0.50 (‐1.56 to 0.56) | |
| Respondent therapy | Combined behavioural therapy | ||||
| Pain intensity various scales short‐term follow‐up | The mean pain intensity in the intervention groups was 0.09 standard deviations higher (0.31 lower to 0.5 higher) | 97 | ++OO | SMD 0.09 (‐0.31 to 0.5) | |
| Pain intensity various scales intermediate‐term follow‐up | The mean pain intensity in the intervention groups was 0.47 standard deviations higher (0.42 lower to 1.35 higher) | 62 | ++OO | SMD 0.47 (‐0.42 to 1.35) | |
| Functional status (generic) various scales short‐term follow‐up | The mean functional status in the intervention groups was 0.38 standard deviations higher (0.02 lower to 0.78 higher) | 97 | ++OO | SMD 0.38 (‐0.02 to 0.78) | |
| Functional status (generic) various scales intermediate‐term follow‐up | The mean functional status in the intervention groups was 0.13 standard deviations higher (0.81 lower to 1.07 higher) | 62 | ++OO | SMD 0.13 (‐0.81 to 1.07) | |
| Depression Beck Depression Inventory (0‐63) short‐term follow‐up | The mean depression ranged across control groups from | The mean depression in the intervention groups was 2.89 points higher (0.55 to 5.24 higher) | 97 | ++OO | |
| Depression Beck Depression Inventory (0‐63) intermediate‐term follow‐up | The mean depression ranged across control groups from | The mean depression in the intervention groups was 1.84 points lower (0.43 lower to 4.11 higher) | 62 | ++OO | |
| CI: Confidence interval | |||||
| GRADE Working Group grades of evidence | |||||
| 1 Serious limitations in study design (i.e. >25% of participants from studies with high risk of bias) 2 Serious inconsistency of results (i.e. opposite direction of effects and/or significant statistical heterogeneity) 3 Serious imprecision (i.e. total number of participants <300 for each outcome) | |||||
| Behavioural treatment compared with other treatments for chronic low‐back pain | |||||
| Patient or population: adults with chronic low‐back pain Settings: primary or secondary health care settings Intervention: behavioural treatment (respondent, cognitive, and operant therapy, or a combination) Comparison: other chronic low‐back pain treatments (i.e. usual care, exercise, surgery) | |||||
| Outcomes | Illustrative means (95% CI) | No of Participants | Quality of the evidence | Comments | |
| Control group | Intervention group | ||||
| Usual care | Behavioural treatment | ||||
| Pain intensity VAS (0‐100) short‐term follow‐up | The mean pain intensity ranged across control groups from | The mean pain intensity in the intervention groups was 5.18 points lower (9.79 to 0.57 lower) | 330 | +++O | |
| Pain intensity VAS (0‐100) intermediate‐term follow‐up | The mean pain intensity ranged across control groups from | The mean pain intensity in the intervention groups was 4.29 points lower (9.28 lower to 0.69 higher) | 319 | +++O | |
| Functional status (back‐specific) various scales short‐term follow‐up | The mean back‐specific functional status in the intervention groups was 0.2 standard deviations lower (0.41 lower to 0.02 higher) | 330 | +++O | SMD ‐0.2 (‐0.41 to 0.02) | |
| Functional status (back‐specific) various scales intermediate‐term follow‐up | The mean back‐specific functional status in the intervention groups was 0.12 standard deviations lower (0.34 lower to 0.1 higher) | 319 | +++O | SMD ‐0.12 (‐0.34 to 0.1) | |
| Exercise | Behavioural treatment | ||||
| Pain intensity Pain Rating Index (0‐45) short‐term follow‐up | The mean pain intensity ranged across control groups from | The mean pain intensity in the intervention groups was 2.31 points lower (6.33 lower to 1.7 higher) | 146 | ++OO | |
| Pain intensity Pain Rating Index (0‐45) intermediate‐term follow‐up | The mean pain intensity ranged across control groups from | The mean pain intensity in the intervention groups was 1.18 points higher (3.16 lower to 5.53 higher) | 137 | +++O | |
| Pain intensity Pain Rating Index (0‐45) long‐term follow‐up | The mean pain intensity ranged across control groups from | The mean pain intensity in the intervention groups was 0.14 points higher (4.4 lower to 4.67 higher) | 136 | +++O | |
| Depression various scales short‐term follow‐up | The mean depression in the intervention groups was 0.25 standard deviations higher (0.07 lower to 0.58 higher) | 146 | ++OO | SMD 0.25 (‐0.07 to 0.58) | |
| Depression various scales intermediate‐term follow‐up | The mean depression in the intervention groups was 0.02 standard deviations higher (0.32 lower to 0.35 higher) | 137 | +++O | SMD 0.02 (‐0.32 to 0.35) | |
| Depression various scales long‐term follow‐up | The mean depression in the intervention groups was 0.07 standard deviations higher (0.27 lower to 0.41 higher) | 136 | +++O | SMD 0.07 (‐0.27 to 0.41) | |
| Surgery | Behavioural treatment | ||||
| Functional status (back specific) Oswestry Disability Index (0‐100) long‐term follow‐up | The mean back‐specific functional status ranged across control groups from | The mean back‐specific functional status in the intervention groups was 2.36 points higher (1.94 lower to 6.66 higher) | 345 | ++OO | |
| CI: Confidence interval | |||||
| GRADE Working Group grades of evidence | |||||
| 1 Serious limitations in study design (i.e. >25% of participants from studies with high risk of bias) 2 Serious inconsistency of results (i.e. opposite direction of effects and/or significant statistical heterogeneity) 3 Serious imprecision (i.e. total number of participants <300 for each outcome) 4 Serious indirectness (i.e. not directly applicable to all patients with chronic low‐back pain) | |||||
| Behavioural treatment in addition to other treatments for chronic low‐back pain | |||||
| Patient or population: adults with chronic low‐back pain Settings: primary, secondary, or tertiary health care settings Intervention: behavioural treatment (respondent, cognitive, and operant therapy, or a combination) in addition to another treatment Comparison: the other treatment alone | |||||
| Outcomes | Illustrative means (95% CI) | No of Participants | Quality of the evidence | Comments | |
| Control group | Intervention group | ||||
| Physiotherapy | Behavioural treatment + physiotherapy | ||||
| Pain intensity 5‐point scale short‐term follow‐up | The mean pain intensity ranged across control groups from | The mean pain intensity in the intervention groups was 0.13 points lower (1.01 lower to 0.75 higher) | 59 | ++OO | |
| Pain intensity 5‐point scale intermediate‐term follow‐up | The mean pain intensity ranged across control groups from | The mean pain intensity in the intervention groups was 0.11 points lower (0.67 lower to 0.44 higher) | 45 | ++OO | |
| Depression Beck Depression Inventory (0‐63) short‐term follow‐up | The mean depression ranged across control groups from | The mean depression in the intervention groups was 1.56 points higher (1.71 lower to 4.83 higher) | 59 | ++OO | |
| Depression Beck Depression Inventory (0‐63) intermediate‐term follow‐up | The mean depression ranged across control groups from | The mean depression in the intervention groups was 0.17 points higher (6.85 lower to 7.19 higher) | 50 | ++OO | |
| Functional status (generic) Sickness Impact Profile (0‐136) short‐term follow‐up | The mean generic functional status ranged across control groups from | The mean generic functional status in the intervention groups was 6.26 points lower (12.71 to 0.19 lower) | 59 | ++OO | |
| Functional status (generic) Sickness Impact Profile (0‐136) intermediate‐term follow‐up | The mean generic functional status ranged across control groups from | The mean generic functional status in the intervention groups was 0.93 points lower (6.71 lower to 4.84 higher) | 51 | ++OO | |
| Inpatient rehabilitation | Behavioural treatment + inpatient rehabilitation | ||||
| Pain intensity various scales short‐term follow‐up | The mean pain intensity in the intervention groups was 0.14 standard deviations lower (0.34 lower to 0.05 higher) | 405 | +++O | SMD ‐0.14 (‐0.34 to 0.05) | |
| CI: Confidence interval | |||||
| GRADE Working Group grades of evidence | |||||
| 1 Serious limitations in study design (i.e. >25% of participants from studies with high risk of bias) 2 Serious imprecision (i.e. total number of participants <300 for each outcome) | |||||
| Study | Patients | Interventions | Relevant outcomes | Size of effect | Benefit/Harms |
| Y | N | Y | N | ? | |
| Y | Y | Y | N | ? | |
| Y | Y | Y | N | ? | |
| Y | Y | Y | ? | ? | |
| Y | Y | N | ? | ? | |
| Y | Y | N | N | ? | |
| Y | Y | Y | ? | ? | |
| Y | Y | Y | Y | ? | |
| Y | Y | N | ? | ? | |
| Y | Y | Y | N | ? | |
| N | Y | Y | ? | ? | |
| Y | N | Y | N | ? | |
| N | Y | Y | ? | ? | |
| Y | Y | Y | ? | ? | |
| Y | Y | Y | N | ? | |
| Y | Y | Y | N | ? | |
| Y | Y | N | ? | ? | |
| Y | Y | Y | N | ? | |
| N | N | Y | N | ? | |
| Y | Y | Y | N | ? | |
| Y | Y | Y | Y | ? | |
| Y | Y | Y | ? | ? | |
| N | Y | Y | ? | ? | |
| Y | Y | Y | ? | ? | |
| Y | Y | Y | ? | ? | |
| Y | Y | Y | ? | ? | |
| Y | Y | Y | ? | ? | |
| Y | Y | Y | ? | ? | |
| Y | Y | Y | ? | Y | |
| Y | Y | Y | N | ? |
| Outcome or subgroup title | No. of studies | No. of participants | Statistical method | Effect size |
| 1 Pain (short‐term) Show forest plot | 3 | 74 | Mean Difference (IV, Random, 95% CI) | ‐19.77 [‐34.34, ‐5.20] |
| 2 Functional status (short term) Show forest plot | 3 | 74 | Std. Mean Difference (IV, Fixed, 95% CI) | ‐0.88 [‐1.36, ‐0.39] |
| 3 Depression (short term) Show forest plot | 2 | 58 | Mean Difference (IV, Random, 95% CI) | ‐6.80 [‐19.73, 6.12] |
| Outcome or subgroup title | No. of studies | No. of participants | Statistical method | Effect size |
| 1 Pain (short term) Show forest plot | 3 | 64 | Std. Mean Difference (IV, Fixed, 95% CI) | ‐0.80 [‐1.32, ‐0.28] |
| 2 Functional status (short term) Show forest plot | 2 | 44 | Std. Mean Difference (IV, Random, 95% CI) | ‐0.17 [‐1.56, 1.22] |
| Outcome or subgroup title | No. of studies | No. of participants | Statistical method | Effect size |
| 1 Pain (short term) Show forest plot | 3 | 153 | Std. Mean Difference (IV, Fixed, 95% CI) | ‐0.43 [‐0.75, ‐0.11] |
| 2 Functional status (short term) Show forest plot | 2 | 87 | Mean Difference (IV, Fixed, 95% CI) | ‐1.18 [‐3.53, 1.18] |
| 3 Depression (short term) Show forest plot | 2 | 103 | Std. Mean Difference (IV, Random, 95% CI) | ‐0.11 [‐0.67, 0.44] |
| Outcome or subgroup title | No. of studies | No. of participants | Statistical method | Effect size |
| 1 Pain (short term) Show forest plot | 2 | 68 | Std. Mean Difference (IV, Fixed, 95% CI) | ‐0.27 [‐0.75, 0.22] |
| 2 Functional status (short term) Show forest plot | 2 | 68 | Std. Mean Difference (IV, Fixed, 95% CI) | ‐0.15 [‐0.64, 0.33] |
| Outcome or subgroup title | No. of studies | No. of participants | Statistical method | Effect size |
| 1 Pain (short term) Show forest plot | 5 | 239 | Std. Mean Difference (IV, Random, 95% CI) | ‐0.60 [‐0.97, ‐0.22] |
| 2 Functional status (short term) Show forest plot | 4 | 134 | Std. Mean Difference (IV, Random, 95% CI) | ‐0.37 [‐0.87, 0.13] |
| 3 Depression (short term) Show forest plot | 4 | 194 | Mean Difference (IV, Random, 95% CI) | ‐1.92 [‐6.16, 2.32] |
| Outcome or subgroup title | No. of studies | No. of participants | Statistical method | Effect size |
| 1 Pain (short term) Show forest plot | 2 | 93 | Std. Mean Difference (IV, Random, 95% CI) | 0.41 [‐0.63, 1.45] |
| 2 Pain (intermediate term) Show forest plot | 2 | 82 | Std. Mean Difference (IV, Random, 95% CI) | 0.35 [‐0.64, 1.35] |
| Outcome or subgroup title | No. of studies | No. of participants | Statistical method | Effect size |
| 1 Pain (short‐term) Show forest plot | 2 | 61 | Std. Mean Difference (IV, Random, 95% CI) | ‐0.24 [‐1.36, 0.87] |
| 2 Pain (intermediate‐term) Show forest plot | 2 | 44 | Std. Mean Difference (IV, Random, 95% CI) | ‐0.30 [‐2.59, 1.98] |
| 3 Pain (long‐term) Show forest plot | 2 | 48 | Std. Mean Difference (IV, Random, 95% CI) | ‐0.89 [‐3.64, 1.87] |
| 4 Functional status (short‐term) Show forest plot | 2 | 61 | Mean Difference (IV, Random, 95% CI) | ‐2.01 [‐10.02, 5.99] |
| 5 Functional status (intermediate‐term) Show forest plot | 2 | 47 | Mean Difference (IV, Random, 95% CI) | ‐3.20 [‐16.44, 10.04] |
| 6 Functional status (long‐term) Show forest plot | 2 | 51 | Mean Difference (IV, Random, 95% CI) | ‐2.23 [‐12.59, 8.13] |
| 7 Depression (short‐term) Show forest plot | 2 | 61 | Mean Difference (IV, Random, 95% CI) | ‐3.10 [‐11.43, 5.23] |
| 8 Depression (intermediate‐term) Show forest plot | 2 | 47 | Mean Difference (IV, Random, 95% CI) | ‐4.66 [‐10.94, 1.61] |
| 9 Depression (long‐term) Show forest plot | 2 | 51 | Mean Difference (IV, Fixed, 95% CI) | ‐0.64 [‐4.61, 3.32] |
| Outcome or subgroup title | No. of studies | No. of participants | Statistical method | Effect size |
| 1 Pain (short‐term) Show forest plot | 3 | 161 | Std. Mean Difference (IV, Fixed, 95% CI) | ‐0.15 [‐0.46, 0.16] |
| 2 Pain (intermediate‐term) Show forest plot | 3 | 139 | Std. Mean Difference (IV, Fixed, 95% CI) | ‐0.23 [‐0.57, 0.11] |
| 3 Pain (long‐term) Show forest plot | 3 | 140 | Std. Mean Difference (IV, Fixed, 95% CI) | ‐0.31 [‐0.65, 0.03] |
| 4 Functional status (short‐term) Show forest plot | 2 | 77 | Std. Mean Difference (IV, Fixed, 95% CI) | 0.21 [‐0.24, 0.67] |
| 5 Functional status (intermediate‐term) Show forest plot | 2 | 61 | Std. Mean Difference (IV, Random, 95% CI) | ‐0.23 [‐1.01, 0.55] |
| 6 Functional status (long‐term) Show forest plot | 2 | 66 | Std. Mean Difference (IV, Random, 95% CI) | ‐0.50 [‐1.56, 0.56] |
| Outcome or subgroup title | No. of studies | No. of participants | Statistical method | Effect size |
| 1 Pain (short term) Show forest plot | 3 | 97 | Std. Mean Difference (IV, Fixed, 95% CI) | 0.09 [‐0.31, 0.50] |
| 2 Pain (intermediate term) Show forest plot | 2 | 62 | Std. Mean Difference (IV, Random, 95% CI) | 0.47 [‐0.42, 1.35] |
| 3 Functional status (short term) Show forest plot | 3 | 97 | Std. Mean Difference (IV, Fixed, 95% CI) | 0.38 [‐0.02, 0.78] |
| 4 Functional status (intermediate term) Show forest plot | 2 | 62 | Std. Mean Difference (IV, Random, 95% CI) | 0.13 [‐0.81, 1.07] |
| 5 Depression (short term) Show forest plot | 3 | 97 | Mean Difference (IV, Fixed, 95% CI) | 2.89 [0.55, 5.24] |
| 6 Depression (intermediate term) Show forest plot | 2 | 62 | Mean Difference (IV, Fixed, 95% CI) | 1.84 [‐0.43, 4.11] |
| Outcome or subgroup title | No. of studies | No. of participants | Statistical method | Effect size |
| 1 Pain (short term) Show forest plot | 2 | 330 | Mean Difference (IV, Fixed, 95% CI) | ‐5.18 [‐9.79, ‐0.57] |
| 2 Pain (intermediate term) Show forest plot | 2 | 319 | Mean Difference (IV, Fixed, 95% CI) | ‐4.29 [‐9.28, 0.69] |
| 3 Back specific functional status (short term) Show forest plot | 2 | 330 | Std. Mean Difference (IV, Fixed, 95% CI) | ‐0.20 [‐0.41, 0.02] |
| 4 Back specific functional status (intermediate term) Show forest plot | 2 | 319 | Std. Mean Difference (IV, Fixed, 95% CI) | ‐0.12 [‐0.34, 0.10] |
| Outcome or subgroup title | No. of studies | No. of participants | Statistical method | Effect size |
| 1 Pain (short term) Show forest plot | 2 | 146 | Mean Difference (IV, Fixed, 95% CI) | ‐2.31 [‐6.33, 1.70] |
| 2 Pain (intermediate term) Show forest plot | 2 | 137 | Mean Difference (IV, Fixed, 95% CI) | 1.18 [‐3.16, 5.53] |
| 3 Pain (long term) Show forest plot | 2 | 136 | Mean Difference (IV, Fixed, 95% CI) | 0.14 [‐4.40, 4.67] |
| 4 Depression (short term) Show forest plot | 2 | 146 | Std. Mean Difference (IV, Fixed, 95% CI) | 0.25 [‐0.07, 0.58] |
| 5 Depression (intermediate term) Show forest plot | 2 | 137 | Std. Mean Difference (IV, Fixed, 95% CI) | 0.02 [‐0.32, 0.35] |
| 6 Depression (long term) Show forest plot | 2 | 136 | Std. Mean Difference (IV, Fixed, 95% CI) | 0.07 [‐0.27, 0.41] |
| Outcome or subgroup title | No. of studies | No. of participants | Statistical method | Effect size |
| 1 Back specific functional status (long term) Show forest plot | 2 | 345 | Mean Difference (IV, Fixed, 95% CI) | 2.36 [‐1.94, 6.66] |
| Outcome or subgroup title | No. of studies | No. of participants | Statistical method | Effect size |
| 1 Pain intensity (short term) Show forest plot | 2 | 59 | Mean Difference (IV, Random, 95% CI) | ‐0.13 [‐1.01, 0.75] |
| 2 Pain Intensity (intermediate term) Show forest plot | 2 | 45 | Mean Difference (IV, Fixed, 95% CI) | ‐0.11 [‐0.67, 0.44] |
| 3 Depression (short term) Show forest plot | 2 | 59 | Mean Difference (IV, Fixed, 95% CI) | 1.56 [‐1.71, 4.83] |
| 4 Depression (intermediate term) Show forest plot | 2 | 50 | Mean Difference (IV, Random, 95% CI) | 0.17 [‐6.85, 7.19] |
| 5 Functional status (short term) Show forest plot | 2 | 59 | Mean Difference (IV, Fixed, 95% CI) | ‐6.26 [‐12.71, 0.19] |
| 6 Functional status (intermediate term) Show forest plot | 2 | 51 | Mean Difference (IV, Fixed, 95% CI) | ‐0.93 [‐6.71, 4.84] |
| Outcome or subgroup title | No. of studies | No. of participants | Statistical method | Effect size |
| 1 Pain intensity (short term) Show forest plot | 2 | 405 | Std. Mean Difference (IV, Fixed, 95% CI) | ‐0.14 [‐0.34, 0.05] |