Cribado del cáncer de pulmón
Información
- DOI:
- https://doi.org/10.1002/14651858.CD001991.pub3Copiar DOI

- Base de datos:
-
- Cochrane Database of Systematic Reviews
- Versión publicada:
-
- 21 junio 2013see what's new
- Tipo:
-
- Intervention
- Etapa:
-
- Review
- Grupo Editorial Cochrane:
-
Grupo Cochrane de Cáncer de pulmón
- Copyright:
-
- Copyright © 2013 The Cochrane Collaboration. Published by John Wiley & Sons, Ltd.
Cifras del artículo
Altmetric:
Citado por:
Autores
Contributions of authors
2001 and 2004 versions of the review
Renée Manser initiated the review and helped to write the protocol. She also carried out the literature search, reviewed abstracts and full text studies for inclusion, participated in the quality assessments, data extraction, analysis and writing of the review.
Christine Stone helped with the assessment of studies (full text) for inclusion in the review, undertook data extraction of the main results and helped with writing of the review.
Graham Byrnes provided statistical advice regarding the analysis and statistical issues relevant to the quality assessment of included studies. He also helped to revise and write the final version.
Lou Irving helped with the writing of the protocol, assessment of methodological quality of included studies and revisions of the final version.
Michael Abramson participated in the protocol development, quality assessments and revision and writing of the final version.
Donald Campbell reviewed abstracts from the initial search for inclusion in the review and assisted with revisions and writing of the final version.
2008 update
Anne Lethaby undertook the update of the review in 2008. She selected studies for inclusion, extracted data (only one publication identified: longer follow‐up of a study already included) and assessed all the included studies for risk of bias according to the new 'Risk of bias' tool. She also added to the Discussion section of the review.
Renée Manser selected studies for inclusion and commented on the updated Discussion section of the review.
2012 update
Renée Manser updated the review in 2012. Anne Lethaby and Renée Manser searched the abstracts and selected studies for inclusion in the review after reviewing the full text of the relevant studies. Anne Lethaby and Renée Manser extracted the data for inclusion in the review and assessed the quality of included studies. Renée Manser rewrote the abstract, introduction, results and discussion and Anne Lethaby wrote the summary of findings tables and assisted with editing and revision of the results and discussion and approved the final version of the review. The final version of the review was approved by Don Campbell, Louis Irving, Michael Abramson and Graham Byrnes.
Declarations of interest
None known. The authors of this review were not involved in any of the primary studies included in the review.
Acknowledgements
We wish to thank the Iberoamerican Cochrane Centre, Carol Roberts, and Ivan Solà, Trials Search Co‐ordinator of the Cochrane Lung Cancer Group for assistance with database searches. We would also like to thank Dr Consol Serra and Jordi Pardo (previous Managing Editors of the Cochrane Lung Cancer Group) for assistance with protocol development, general advice and editing of the review. We would like to acknowledge the help provided by authors of primary studies who have responded to our correspondence and provided additional information (Dr Robert Fontana, Dr Myron Melamed). We are also grateful to Russell McGowan, who reviewed and commented on the protocol from the consumer perspective. We would like to acknowledge the valuable comments provided by Frances Hanks, who reviewed the final original review from the consumer perspective. We are grateful to Dr Sera Tort, the current Joint Co‐ordinating Editor for the Cochrane Lung Cancer Review Group, for editorial input and general advice.
Version history
| Published | Title | Stage | Authors | Version |
| 2013 Jun 21 | Screening for lung cancer | Review | Renée Manser, Anne Lethaby, Louis B Irving, Christine Stone, Graham Byrnes, Michael J Abramson, Don Campbell | |
| 2004 Jan 26 | Screening for lung cancer | Review | Renée Manser, Louis B Irving, Christine Stone, Graham Byrnes, Michael J Abramson, Donald Campbell | |
| 1999 Sep 06 | Screening for lung cancer | Review | Manser, RL, Lou Irving, Christine Stone, Graham Byrnes, Michael J Abramson, Donald Campbell, Renée Manser | |
Keywords
MeSH
Medical Subject Headings (MeSH) Keywords
Medical Subject Headings Check Words
Adult; Female; Humans; Male;
PICO

Risk of bias graph: review authors' judgements about each risk of bias item presented as percentages across all included studies.

Risk of bias summary: review authors' judgements about each risk of bias item for each included study.

Comparison 1 Lung cancer screening with chest radiography +/‐ sputum cytology versus less intense screening, Outcome 1 Lung cancer mortality.
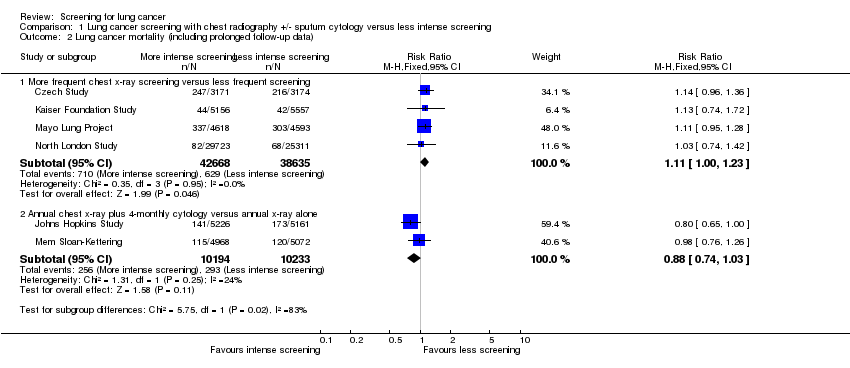
Comparison 1 Lung cancer screening with chest radiography +/‐ sputum cytology versus less intense screening, Outcome 2 Lung cancer mortality (including prolonged follow‐up data).

Comparison 1 Lung cancer screening with chest radiography +/‐ sputum cytology versus less intense screening, Outcome 3 All‐cause mortality.

Comparison 1 Lung cancer screening with chest radiography +/‐ sputum cytology versus less intense screening, Outcome 4 Lung cancer 5‐year survival.
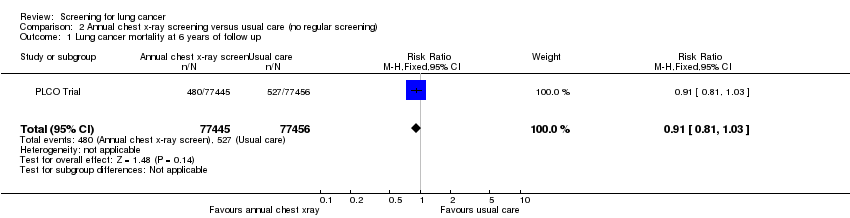
Comparison 2 Annual chest x‐ray screening versus usual care (no regular screening), Outcome 1 Lung cancer mortality at 6 years of follow up.

Comparison 2 Annual chest x‐ray screening versus usual care (no regular screening), Outcome 2 Lung cancer mortality at 13 years of follow up.
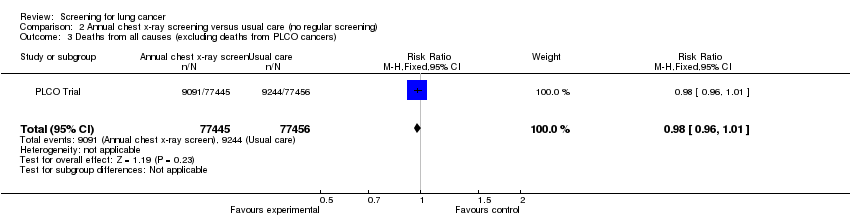
Comparison 2 Annual chest x‐ray screening versus usual care (no regular screening), Outcome 3 Deaths from all causes (excluding deaths from PLCO cancers).

Comparison 3 Annual low dose CT screening versus annual chest x‐ray, Outcome 1 Lung cancer mortality.

Comparison 3 Annual low dose CT screening versus annual chest x‐ray, Outcome 2 All‐cause mortality.
| L ung cancer screening with chest radiography +/‐ sputum cytology versus less intense screening for lung cancer | ||||||
| Patient or population: Patients with lung cancer | ||||||
| Outcomes | Illustrative comparative risks* (95% CI) | Relative effect | No of Participants | Quality of the evidence | Comments | |
| Assumed risk | Corresponding risk | |||||
| Control | Lung cancer screening with chest radiography +/‐ sputum cytology versus less intense screening | |||||
| Lung cancer mortality ‐ More frequent chest x‐ray screening versus less frequent screening | 7 per 1000 | 8 per 1000 | RR 1.11 | 81303 | ⊕⊕⊕⊝ | |
| Lung cancer mortality ‐ Annual chest x‐ray plus 4‐monthly cytology versus annual x‐ray alone | 29 per 1000 | 25 per 1000 | RR 0.88 | 20427 | ⊕⊕⊕⊕ | |
| All‐cause mortality ‐ More frequent chest x‐ray screening versus less frequent screening | 83 per 1000 | 84 per 1000 | RR 1.01 | 170149 | ⊕⊕⊝⊝ | |
| All‐cause mortality ‐ Annual chest x‐ray plus 4‐monthly cytology versus annual x‐ray alone | 97 per 1000 | 100 per 1000 | RR 1.03 | 10040 | ⊕⊕⊕⊕ | |
| Lung cancer 5‐year survival ‐ More frequent chest x‐ray screening versus less frequent screening | 902 per 1000 | 820 per 1000 | RR 0.91 | 1775 | ⊕⊕⊝⊝ | |
| Lung cancer 5‐year survival ‐ Annual chest x‐ray plus 4‐monthly cytology versus annual x‐ray alone | 700 per 1000 | 581 per 1000 | RR 0.83 | 837 | ⊕⊕⊕⊝ | |
| *The basis for the assumed risk (e.g. the median control group risk across studies) is provided in footnotes. The corresponding risk (and its 95% confidence interval) is based on the assumed risk in the comparison group and the relative effect of the intervention (and its 95% CI). | ||||||
| GRADE Working Group grades of evidence | ||||||
| 1 No trials had evidence of adequate allocation concealment and only half had adequate description of drop‐outs. | ||||||
| Annual chest x‐ray screening versus usual care (no regular screening) for lung cancer | ||||||
| Patient or population: Patients with lung cancer | ||||||
| Outcomes | Illustrative comparative risks* (95% CI) | Relative effect | No of Participants | Quality of the evidence | Comments | |
| Assumed risk | Corresponding risk | |||||
| Control | Annual chest x‐ray screening versus usual care (no regular screening) | |||||
| Lung cancer mortality at 6 years of follow‐up | 7 per 1000 | 6 per 1000 | RR 0.91 | 154901 | ⊕⊕⊕⊕ | |
| Lung cancer mortality at 13 years of follow‐up | 16 per 1000 | 16 per 1000 | RR 0.99 | 154901 | ⊕⊕⊕⊕ | |
| Deaths from all causes (excluding deaths from PLCO cancers) | 119 per 1000 | 117 per 1000 | RR 0.98 | 154901 | ⊕⊕⊕⊕ | |
| *The basis for the assumed risk (e.g. the median control group risk across studies) is provided in footnotes. The corresponding risk (and its 95% confidence interval) is based on the assumed risk in the comparison group and the relative effect of the intervention (and its 95% CI). | ||||||
| GRADE Working Group grades of evidence | ||||||
| Annual low dose CT screening versus annual chest x‐ray for lung cancer | ||||||
| Patient or population: Patients with lung cancer | ||||||
| Outcomes | Illustrative comparative risks* (95% CI) | Relative effect | No of Participants | Quality of the evidence | Comments | |
| Assumed risk | Corresponding risk | |||||
| Control | Annual low‐dose CT screening versus annual chest x‐ray | |||||
| Lung cancer mortality | 17 per 1000 | 13 per 1000 | RR 0.8 | 53454 | ⊕⊕⊕⊕ | |
| All‐cause mortality | 75 per 1000 | 70 per 1000 | RR 0.94 | 53454 | ⊕⊕⊕⊕ | |
| *The basis for the assumed risk (e.g. the median control group risk across studies) is provided in footnotes. The corresponding risk (and its 95% confidence interval) is based on the assumed risk in the comparison group and the relative effect of the intervention (and its 95% CI). | ||||||
| GRADE Working Group grades of evidence | ||||||
| Study | Intervention n (%) | Intervention N | Control n(%) | Control N | Relative risk |
| 108 (3.4%) | 3171 | 82 (2.6%) | 3174 | 1.33 (0.99,1.75) | |
| 374 (0.9%) | 41532 | 667 (0.7%) | 102348 | 1.38 (1.22,1.57) | |
| 585 (12.7%) | 4618 | 500 (10.9%) | 4593 | 1.16 (1.04,1.3) | |
| 132 (0.44%) | 29723 | 97 (0.38%) | 25311 | 1.16 (0.89,1.51) | |
| 238 (4.6%) | 5226 | 246 (4.8%) | 5161 | 0.95 (0.8,1.14) | |
| 176 (3.5%) | 4968 | 178 (3.5%) | 5072 | 1.01 (0.82,1.24) | |
| 1696 (2.2%) | 77445 | 1620 (2.1%) | 77456 | 1.05 (0.98, 1.12) | |
| 1060 (4.0%) | 26722 | 941 (3.5%) | 26732 | 1.13 (1.03, 1.23) | |
| *Data from prolonged period of follow‐up reported post‐study. | |||||
| Outcome or subgroup title | No. of studies | No. of participants | Statistical method | Effect size |
| 1 Lung cancer mortality Show forest plot | 6 | Risk Ratio (M‐H, Fixed, 95% CI) | Subtotals only | |
| 1.1 More frequent chest x‐ray screening versus less frequent screening | 4 | 81303 | Risk Ratio (M‐H, Fixed, 95% CI) | 1.11 [0.95, 1.31] |
| 1.2 Annual chest x‐ray plus 4‐monthly cytology versus annual x‐ray alone | 2 | 20427 | Risk Ratio (M‐H, Fixed, 95% CI) | 0.88 [0.74, 1.03] |
| 2 Lung cancer mortality (including prolonged follow‐up data) Show forest plot | 6 | Risk Ratio (M‐H, Fixed, 95% CI) | Subtotals only | |
| 2.1 More frequent chest x‐ray screening versus less frequent screening | 4 | 81303 | Risk Ratio (M‐H, Fixed, 95% CI) | 1.11 [1.00, 1.23] |
| 2.2 Annual chest x‐ray plus 4‐monthly cytology versus annual x‐ray alone | 2 | 20427 | Risk Ratio (M‐H, Fixed, 95% CI) | 0.88 [0.74, 1.03] |
| 3 All‐cause mortality Show forest plot | 5 | Risk Ratio (M‐H, Random, 95% CI) | Subtotals only | |
| 3.1 More frequent chest x‐ray screening versus less frequent screening | 4 | 170149 | Risk Ratio (M‐H, Random, 95% CI) | 1.01 [0.94, 1.08] |
| 3.2 Annual chest x‐ray plus 4‐monthly cytology versus annual x‐ray alone | 1 | 10040 | Risk Ratio (M‐H, Random, 95% CI) | 1.03 [0.91, 1.15] |
| 4 Lung cancer 5‐year survival Show forest plot | 5 | Risk Ratio (M‐H, Random, 95% CI) | Subtotals only | |
| 4.1 More frequent chest x‐ray screening versus less frequent screening | 4 | 1775 | Risk Ratio (M‐H, Random, 95% CI) | 0.91 [0.84, 0.99] |
| 4.2 Annual chest x‐ray plus 4‐monthly cytology versus annual x‐ray alone | 1 | 837 | Risk Ratio (M‐H, Random, 95% CI) | 0.83 [0.75, 0.92] |
| Outcome or subgroup title | No. of studies | No. of participants | Statistical method | Effect size |
| 1 Lung cancer mortality at 6 years of follow up Show forest plot | 1 | 154901 | Risk Ratio (M‐H, Fixed, 95% CI) | 0.91 [0.81, 1.03] |
| 2 Lung cancer mortality at 13 years of follow up Show forest plot | 1 | 154901 | Risk Ratio (M‐H, Fixed, 95% CI) | 0.99 [0.91, 1.07] |
| 3 Deaths from all causes (excluding deaths from PLCO cancers) Show forest plot | 1 | 154901 | Risk Ratio (M‐H, Fixed, 95% CI) | 0.98 [0.96, 1.01] |
| Outcome or subgroup title | No. of studies | No. of participants | Statistical method | Effect size |
| 1 Lung cancer mortality Show forest plot | 1 | 53454 | Risk Ratio (M‐H, Fixed, 95% CI) | 0.80 [0.70, 0.92] |
| 2 All‐cause mortality Show forest plot | 1 | 53454 | Risk Ratio (M‐H, Fixed, 95% CI) | 0.94 [0.88, 1.00] |