Ventilación mecánica nocturna para la hipoventilación crónica en pacientes con trastornos neuromusculares y de la pared torácica
Referencias
Referencias de los estudios incluidos en esta revisión
Referencias de los estudios excluidos de esta revisión
Referencias adicionales
Characteristics of studies
Characteristics of included studies [ordered by study ID]
Ir a:
| Methods | Single centre open study on parallel groups ‐ at least 1‐year follow‐up period. | |
| Participants | n = 41 amyotrophic lateral sclerosis with or without bulbar features ‐ definite diagnostic criteria ‐ orthopnoea with inspiratory maximal pressure less than 60% of predicted or symptomatic daytime hypercapnia. | |
| Interventions | Control = standard care. | |
| Outcomes | Survival time ‐ quality of life SF36 mental component summary and sleep apnoea quality of life index symptoms domain. | |
| Notes | ||
| Risk of bias | ||
| Bias | Authors' judgement | Support for judgement |
| Allocation concealment? | Low risk | A ‐ Adequate |
| Methods | Single centre open crossover study. | |
| Participants | n = 5 ‐ spinal muscular atrophy, muscular dystrophy, poliomyelitis, myelitis ‐ chronic stable hypercapnic respiratory failure. | |
| Interventions | Control = no respiratory support. | |
| Outcomes | Short‐term (24 hour) evaluation of nocturnal hypoventilation related symptoms ‐ arterial blood gases ‐ respiratory function tests ‐ sleep studies. | |
| Notes | ||
| Risk of bias | ||
| Bias | Authors' judgement | Support for judgement |
| Allocation concealment? | High risk | C ‐ Inadequate |
| Methods | Single centre open crossover study. | |
| Participants | n = 10. | |
| Interventions | Control = spontaneous ventilation. | |
| Outcomes | 1‐month improvement in sleep parameters, clinical symptoms and arterial blood gas. | |
| Notes | ||
| Risk of bias | ||
| Bias | Authors' judgement | Support for judgement |
| Allocation concealment? | Unclear risk | B ‐ Unclear |
| Methods | Single centre open study on parallel groups ‐ 3‐year follow‐up period. | |
| Participants | n = 20 ‐ amyotrophic lateral sclerosis with bulbar features ‐ definite diagnostic criteria ‐ chronic hypercapnic respiratory failure. | |
| Interventions | Control = oxygen, bronchodilatators and other palliative measures. | |
| Outcomes | Mortality at 1 and 3 years ‐ survival time ‐ bulbar and spinal Norris scores ‐ quality of life ‐ modified Barthel score ‐ arterial blood gases and respiratory function tests. | |
| Notes | ||
| Risk of bias | ||
| Bias | Authors' judgement | Support for judgement |
| Allocation concealment? | High risk | C ‐ Inadequate |
| Methods | Multicentre (17 centres in France) open study on parallel groups ‐ Randomisation was done centrally (phone) and stratified for centre ‐ 5‐year inclusion period. | |
| Participants | Individual data were available from the coordinating centre ‐ Children and adults with Duchenne muscular dystrophy ‐ | |
| Interventions | Control group = combination of antibiotic and physiotherapy, if needed. | |
| Outcomes | Short‐term (24 hours) arterial blood gases long‐term (6 months to 1 year) symptoms of nocturnal hypoventilation, death, number of unplanned hospitalisation, arterial blood gases and forced vital capacity. | |
| Notes | ||
| Risk of bias | ||
| Bias | Authors' judgement | Support for judgement |
| Allocation concealment? | Low risk | A ‐ Adequate |
| Methods | Single centre crossover open study ‐ allocation concealment by sealed envelopes. | |
| Participants | n = 7‐ stable chronic hypercapnic respiratory failure ‐ mixed populations ‐ separate data available for neuromuscular patients (polio and post polio syndrome, muscular dystrophy, phrenic nerve paralysis, kyphoscoliosis and thoracoplasty) ‐ none of the participants living in institution ‐ all participants had symptoms of nocturnal hypoventilation and daytime hypercapnia. | |
| Interventions | Control treatment = no ventilatory support. | |
| Outcomes | Short‐term assessment of 10 cm visual analogue scale for evaluation of nocturnal hypoventilation related symptoms ‐ daytime arterial blood gases ‐ mean nocturnal SaO2 ‐ median time spent under 90% SaO2. | |
| Notes | ||
| Risk of bias | ||
| Bias | Authors' judgement | Support for judgement |
| Allocation concealment? | Low risk | A ‐ Adequate |
| Methods | Single centre open study on parallel groups ‐ 2‐year follow‐up period. | |
| Participants | n = 26. | |
| Interventions | Control = spontaneous ventilation. | |
| Outcomes | Peak transcutaneous arterial CO2 tension. | |
| Notes | ||
| Risk of bias | ||
| Bias | Authors' judgement | Support for judgement |
| Allocation concealment? | Unclear risk | B ‐ Unclear |
| Methods | Single centre crossover open study. | |
| Participants | n = 16. | |
| Interventions | Control = nocturnal ventilation with bi‐level airway pressure using nasal mask. | |
| Outcomes | Short‐term (1 night treatment) effects on sleep parameters. | |
| Notes | ||
| Risk of bias | ||
| Bias | Authors' judgement | Support for judgement |
| Allocation concealment? | Unclear risk | B ‐ Unclear |
Characteristics of excluded studies [ordered by study ID]
Ir a:
| Study | Reason for exclusion |
| Non‐randomised open study. | |
| Mechanical ventilation was implemented for one hour run during daytime. No data are available for nocturnal ventilation effects. | |
| Non‐randomised open study | |
| Participants in an unstable condition, i.e. acute respiratory failure. | |
| Mixed population, i.e. COPD and only four participants with chest wall disorders ‐ mechanical ventilation was implemented for five minute courses during daytime. No data were available for night time ventilation effects. | |
| Non‐randomised open study | |
| Mixed population, i.e. COPD and only three participants with neuromuscular or chest wall disorders ‐ mechanical ventilation was implemented for a two hour course during daytime. No data were available for nocturnal ventilation effects. | |
| Non‐randomised open study ‐ participants in unstable condition, i.e. acute respiratory failure. |
Data and analyses
| Outcome or subgroup title | No. of studies | No. of participants | Statistical method | Effect size |
| 1 No improvement of hypoventilation symptoms Show forest plot | 1 | 10 | Risk Ratio (M‐H, Fixed, 95% CI) | 0.09 [0.01, 1.31] |
| Analysis 1.1  Comparison 1 Short‐term: nocturnal ventilation versus no ventilation, Outcome 1 No improvement of hypoventilation symptoms. | ||||
| 2 No improvement of daytime hypercapnia Show forest plot | 3 | 43 | Risk Ratio (M‐H, Fixed, 95% CI) | 0.37 [0.20, 0.65] |
| Analysis 1.2  Comparison 1 Short‐term: nocturnal ventilation versus no ventilation, Outcome 2 No improvement of daytime hypercapnia. | ||||
| 3 Daytime PaCO2 Show forest plot | 2 | 24 | Mean Difference (IV, Fixed, 95% CI) | ‐0.32 [‐0.84, 0.20] |
| Analysis 1.3  Comparison 1 Short‐term: nocturnal ventilation versus no ventilation, Outcome 3 Daytime PaCO2. | ||||
| 4 Mean nocturnal SaO2 Show forest plot | 2 | 24 | Mean Difference (IV, Fixed, 95% CI) | 5.45 [1.47, 9.44] |
| Analysis 1.4  Comparison 1 Short‐term: nocturnal ventilation versus no ventilation, Outcome 4 Mean nocturnal SaO2. | ||||
| Outcome or subgroup title | No. of studies | No. of participants | Statistical method | Effect size |
| 1 Unplanned admission to hospital Show forest plot | 1 | 19 | Risk Ratio (M‐H, Fixed, 95% CI) | 0.13 [0.01, 2.22] |
| Analysis 2.1  Comparison 2 Long‐term: nocturnal ventilation versus no ventilation, Outcome 1 Unplanned admission to hospital. | ||||
| 2 Death Show forest plot | 3 | 80 | Risk Ratio (M‐H, Fixed, 95% CI) | 0.62 [0.42, 0.91] |
| Analysis 2.2  Comparison 2 Long‐term: nocturnal ventilation versus no ventilation, Outcome 2 Death. | ||||
| 3 No improvement of hypoventilation symptoms Show forest plot | 1 | 19 | Risk Ratio (M‐H, Fixed, 95% CI) | 0.51 [0.22, 1.19] |
| Analysis 2.3  Comparison 2 Long‐term: nocturnal ventilation versus no ventilation, Outcome 3 No improvement of hypoventilation symptoms. | ||||
| 4 No improvement of daytime hypercapnia Show forest plot | 1 | 20 | Risk Ratio (M‐H, Fixed, 95% CI) | 0.0 [0.0, 0.0] |
| Analysis 2.4  Comparison 2 Long‐term: nocturnal ventilation versus no ventilation, Outcome 4 No improvement of daytime hypercapnia. | ||||
| 5 Daytime PaCO2 Show forest plot | 3 | 60 | Mean Difference (IV, Fixed, 95% CI) | ‐0.26 [‐0.61, 0.09] |
| Analysis 2.5  Comparison 2 Long‐term: nocturnal ventilation versus no ventilation, Outcome 5 Daytime PaCO2. | ||||
| 6 Forced vital capacity Show forest plot | 2 | 28 | Mean Difference (IV, Fixed, 95% CI) | 158.50 [‐84.43, 401.43] |
| Analysis 2.6  Comparison 2 Long‐term: nocturnal ventilation versus no ventilation, Outcome 6 Forced vital capacity. | ||||
| 7 Respiratory muscle strength Show forest plot | 1 | 28 | Mean Difference (IV, Fixed, 95% CI) | ‐5.72 [‐13.87, 2.43] |
| Analysis 2.7  Comparison 2 Long‐term: nocturnal ventilation versus no ventilation, Outcome 7 Respiratory muscle strength. | ||||
| 7.1 mean improvement in maximal inspiratory pressure | 1 | 2 | Mean Difference (IV, Fixed, 95% CI) | 0.0 [0.0, 0.0] |
| 7.2 mean improvement in SNIP | 1 | 26 | Mean Difference (IV, Fixed, 95% CI) | ‐5.72 [‐13.87, 2.43] |
| 8 Mean nocturnal SaO2 Show forest plot | 1 | 26 | Mean Difference (IV, Fixed, 95% CI) | 3.00 [1.85, 4.15] |
| Analysis 2.8  Comparison 2 Long‐term: nocturnal ventilation versus no ventilation, Outcome 8 Mean nocturnal SaO2. | ||||
| Outcome or subgroup title | No. of studies | No. of participants | Statistical method | Effect size |
| 1 No improvement of hypoventilation symptoms Show forest plot | 1 | 14 | Risk Ratio (M‐H, Fixed, 95% CI) | 0.0 [0.0, 0.0] |
| Analysis 3.1  Comparison 3 Short‐term: volume‐cycled ventilation versus pressure‐cycled ventilation, Outcome 1 No improvement of hypoventilation symptoms. | ||||
| 2 No improvement of daytime hypercapnia Show forest plot | 1 | 14 | Risk Ratio (M‐H, Fixed, 95% CI) | 1.33 [0.46, 3.88] |
| Analysis 3.2  Comparison 3 Short‐term: volume‐cycled ventilation versus pressure‐cycled ventilation, Outcome 2 No improvement of daytime hypercapnia. | ||||
| 3 Daytime PaCO2 Show forest plot | 1 | 14 | Mean Difference (IV, Fixed, 95% CI) | 0.24 [‐0.38, 0.86] |
| Analysis 3.3  Comparison 3 Short‐term: volume‐cycled ventilation versus pressure‐cycled ventilation, Outcome 3 Daytime PaCO2. | ||||
| 4 Mean nocturnal SaO2 Show forest plot | 1 | 14 | Mean Difference (IV, Fixed, 95% CI) | ‐0.49 [‐3.28, 2.30] |
| Analysis 3.4  Comparison 3 Short‐term: volume‐cycled ventilation versus pressure‐cycled ventilation, Outcome 4 Mean nocturnal SaO2. | ||||
| Outcome or subgroup title | No. of studies | No. of participants | Statistical method | Effect size |
| 1 No improvement of daytime hypercapnia Show forest plot | 1 | 20 | Risk Ratio (M‐H, Fixed, 95% CI) | 1.0 [0.49, 2.05] |
| Analysis 4.1  Comparison 4 Long‐term: volume‐cycled ventilation versus pressure‐cycled ventilation, Outcome 1 No improvement of daytime hypercapnia. | ||||
| 2 Daytime PaCO2 Show forest plot | 1 | 20 | Mean Difference (IV, Fixed, 95% CI) | ‐0.21 [‐0.69, 0.27] |
| Analysis 4.2  Comparison 4 Long‐term: volume‐cycled ventilation versus pressure‐cycled ventilation, Outcome 2 Daytime PaCO2. | ||||
| 3 Apnea‐hypopnea index Show forest plot | 1 | 20 | Mean Difference (IV, Fixed, 95% CI) | 2.5 [‐0.60, 5.60] |
| Analysis 4.3  Comparison 4 Long‐term: volume‐cycled ventilation versus pressure‐cycled ventilation, Outcome 3 Apnea‐hypopnea index. | ||||
| 4 Mean nocturnal SaO2 Show forest plot | 1 | 2 | Mean Difference (IV, Fixed, 95% CI) | 0.0 [0.0, 0.0] |
| Analysis 4.4  Comparison 4 Long‐term: volume‐cycled ventilation versus pressure‐cycled ventilation, Outcome 4 Mean nocturnal SaO2. | ||||
| 5 Time spent with an SaO2 below 90% Show forest plot | 1 | 20 | Mean Difference (IV, Fixed, 95% CI) | 2.0 [‐42.74, 46.74] |
| Analysis 4.5  Comparison 4 Long‐term: volume‐cycled ventilation versus pressure‐cycled ventilation, Outcome 5 Time spent with an SaO2 below 90%. | ||||
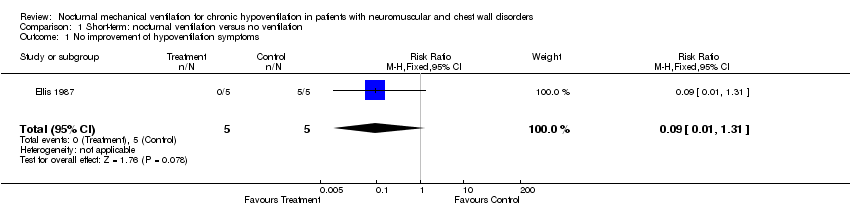
Comparison 1 Short‐term: nocturnal ventilation versus no ventilation, Outcome 1 No improvement of hypoventilation symptoms.

Comparison 1 Short‐term: nocturnal ventilation versus no ventilation, Outcome 2 No improvement of daytime hypercapnia.

Comparison 1 Short‐term: nocturnal ventilation versus no ventilation, Outcome 3 Daytime PaCO2.
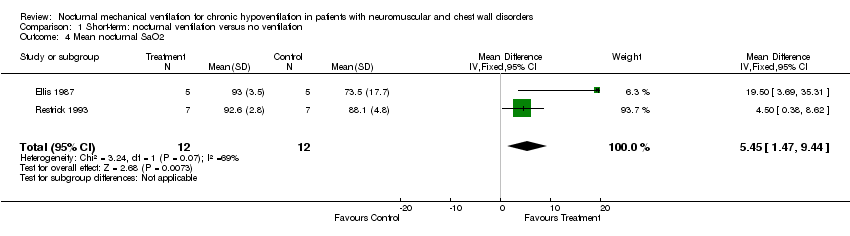
Comparison 1 Short‐term: nocturnal ventilation versus no ventilation, Outcome 4 Mean nocturnal SaO2.
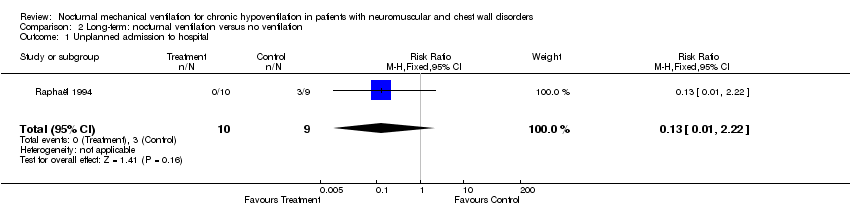
Comparison 2 Long‐term: nocturnal ventilation versus no ventilation, Outcome 1 Unplanned admission to hospital.

Comparison 2 Long‐term: nocturnal ventilation versus no ventilation, Outcome 2 Death.
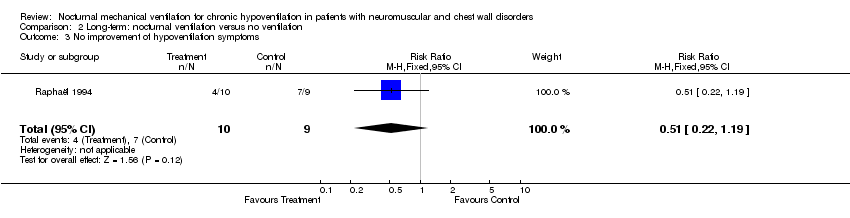
Comparison 2 Long‐term: nocturnal ventilation versus no ventilation, Outcome 3 No improvement of hypoventilation symptoms.
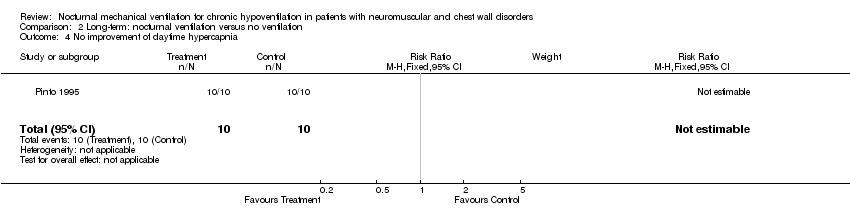
Comparison 2 Long‐term: nocturnal ventilation versus no ventilation, Outcome 4 No improvement of daytime hypercapnia.
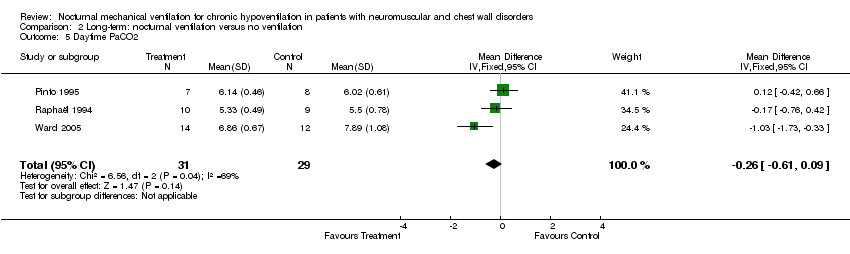
Comparison 2 Long‐term: nocturnal ventilation versus no ventilation, Outcome 5 Daytime PaCO2.

Comparison 2 Long‐term: nocturnal ventilation versus no ventilation, Outcome 6 Forced vital capacity.

Comparison 2 Long‐term: nocturnal ventilation versus no ventilation, Outcome 7 Respiratory muscle strength.
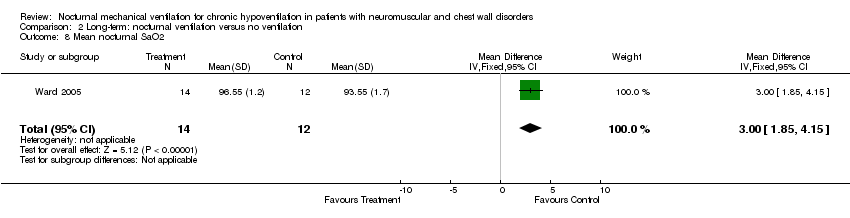
Comparison 2 Long‐term: nocturnal ventilation versus no ventilation, Outcome 8 Mean nocturnal SaO2.

Comparison 3 Short‐term: volume‐cycled ventilation versus pressure‐cycled ventilation, Outcome 1 No improvement of hypoventilation symptoms.

Comparison 3 Short‐term: volume‐cycled ventilation versus pressure‐cycled ventilation, Outcome 2 No improvement of daytime hypercapnia.

Comparison 3 Short‐term: volume‐cycled ventilation versus pressure‐cycled ventilation, Outcome 3 Daytime PaCO2.

Comparison 3 Short‐term: volume‐cycled ventilation versus pressure‐cycled ventilation, Outcome 4 Mean nocturnal SaO2.
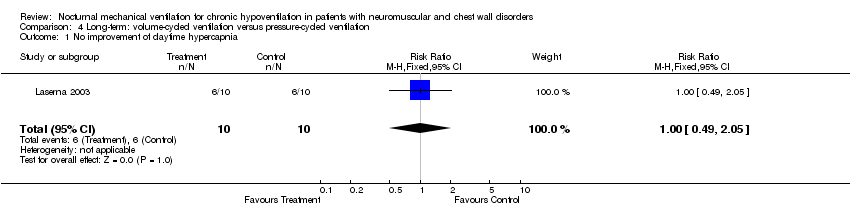
Comparison 4 Long‐term: volume‐cycled ventilation versus pressure‐cycled ventilation, Outcome 1 No improvement of daytime hypercapnia.

Comparison 4 Long‐term: volume‐cycled ventilation versus pressure‐cycled ventilation, Outcome 2 Daytime PaCO2.

Comparison 4 Long‐term: volume‐cycled ventilation versus pressure‐cycled ventilation, Outcome 3 Apnea‐hypopnea index.

Comparison 4 Long‐term: volume‐cycled ventilation versus pressure‐cycled ventilation, Outcome 4 Mean nocturnal SaO2.

Comparison 4 Long‐term: volume‐cycled ventilation versus pressure‐cycled ventilation, Outcome 5 Time spent with an SaO2 below 90%.
| Study ID | Allocation | Observer | Explicit | Explicit | Baseline | Completeness |
| Ellis 1987 | C | C | B | A | B | A |
| Pinto 1995 | C | C | A | A | A | A |
| Raphaël 1994 | A | C | A | A | A | A |
| Restrick 1993 | A | C | B | B | A | A |
| Laserna 2003 | C | C | A | A | A | A |
| Wilson 2004 | C | C | A | A | A | A |
| Ward 2005 | C | C | A | A | A | B |
| Bourke 2006 | A | C | A | A | A | A |
| Outcome or subgroup title | No. of studies | No. of participants | Statistical method | Effect size |
| 1 No improvement of hypoventilation symptoms Show forest plot | 1 | 10 | Risk Ratio (M‐H, Fixed, 95% CI) | 0.09 [0.01, 1.31] |
| 2 No improvement of daytime hypercapnia Show forest plot | 3 | 43 | Risk Ratio (M‐H, Fixed, 95% CI) | 0.37 [0.20, 0.65] |
| 3 Daytime PaCO2 Show forest plot | 2 | 24 | Mean Difference (IV, Fixed, 95% CI) | ‐0.32 [‐0.84, 0.20] |
| 4 Mean nocturnal SaO2 Show forest plot | 2 | 24 | Mean Difference (IV, Fixed, 95% CI) | 5.45 [1.47, 9.44] |
| Outcome or subgroup title | No. of studies | No. of participants | Statistical method | Effect size |
| 1 Unplanned admission to hospital Show forest plot | 1 | 19 | Risk Ratio (M‐H, Fixed, 95% CI) | 0.13 [0.01, 2.22] |
| 2 Death Show forest plot | 3 | 80 | Risk Ratio (M‐H, Fixed, 95% CI) | 0.62 [0.42, 0.91] |
| 3 No improvement of hypoventilation symptoms Show forest plot | 1 | 19 | Risk Ratio (M‐H, Fixed, 95% CI) | 0.51 [0.22, 1.19] |
| 4 No improvement of daytime hypercapnia Show forest plot | 1 | 20 | Risk Ratio (M‐H, Fixed, 95% CI) | 0.0 [0.0, 0.0] |
| 5 Daytime PaCO2 Show forest plot | 3 | 60 | Mean Difference (IV, Fixed, 95% CI) | ‐0.26 [‐0.61, 0.09] |
| 6 Forced vital capacity Show forest plot | 2 | 28 | Mean Difference (IV, Fixed, 95% CI) | 158.50 [‐84.43, 401.43] |
| 7 Respiratory muscle strength Show forest plot | 1 | 28 | Mean Difference (IV, Fixed, 95% CI) | ‐5.72 [‐13.87, 2.43] |
| 7.1 mean improvement in maximal inspiratory pressure | 1 | 2 | Mean Difference (IV, Fixed, 95% CI) | 0.0 [0.0, 0.0] |
| 7.2 mean improvement in SNIP | 1 | 26 | Mean Difference (IV, Fixed, 95% CI) | ‐5.72 [‐13.87, 2.43] |
| 8 Mean nocturnal SaO2 Show forest plot | 1 | 26 | Mean Difference (IV, Fixed, 95% CI) | 3.00 [1.85, 4.15] |
| Outcome or subgroup title | No. of studies | No. of participants | Statistical method | Effect size |
| 1 No improvement of hypoventilation symptoms Show forest plot | 1 | 14 | Risk Ratio (M‐H, Fixed, 95% CI) | 0.0 [0.0, 0.0] |
| 2 No improvement of daytime hypercapnia Show forest plot | 1 | 14 | Risk Ratio (M‐H, Fixed, 95% CI) | 1.33 [0.46, 3.88] |
| 3 Daytime PaCO2 Show forest plot | 1 | 14 | Mean Difference (IV, Fixed, 95% CI) | 0.24 [‐0.38, 0.86] |
| 4 Mean nocturnal SaO2 Show forest plot | 1 | 14 | Mean Difference (IV, Fixed, 95% CI) | ‐0.49 [‐3.28, 2.30] |
| Outcome or subgroup title | No. of studies | No. of participants | Statistical method | Effect size |
| 1 No improvement of daytime hypercapnia Show forest plot | 1 | 20 | Risk Ratio (M‐H, Fixed, 95% CI) | 1.0 [0.49, 2.05] |
| 2 Daytime PaCO2 Show forest plot | 1 | 20 | Mean Difference (IV, Fixed, 95% CI) | ‐0.21 [‐0.69, 0.27] |
| 3 Apnea‐hypopnea index Show forest plot | 1 | 20 | Mean Difference (IV, Fixed, 95% CI) | 2.5 [‐0.60, 5.60] |
| 4 Mean nocturnal SaO2 Show forest plot | 1 | 2 | Mean Difference (IV, Fixed, 95% CI) | 0.0 [0.0, 0.0] |
| 5 Time spent with an SaO2 below 90% Show forest plot | 1 | 20 | Mean Difference (IV, Fixed, 95% CI) | 2.0 [‐42.74, 46.74] |