Profilaxis con antibióticos antiestafilocócicos para la fibrosis quística
Información
- DOI:
- https://doi.org/10.1002/14651858.CD001912.pub4Copiar DOI

- Base de datos:
-
- Cochrane Database of Systematic Reviews
- Versión publicada:
-
- 18 abril 2017see what's new
- Tipo:
-
- Intervention
- Etapa:
-
- Review
- Grupo Editorial Cochrane:
-
Grupo Cochrane de Fibrosis quística y enfermedades genéticas
- Copyright:
-
- Copyright © 2020 The Cochrane Collaboration. Published by John Wiley & Sons, Ltd.
Cifras del artículo
Altmetric:
Citado por:
Autores
Contributions of authors
Original review and updates up to and including 2014
Both AS and SW evaluated which studies should be included in the review. AS analysed the data. AS and SW both interpreted the results. AS liaised with the authors of the studies included in this review to obtain additional data.
AS completed the updates with additional comments from SW and he acts as guarantor for this review.
From 2016
Both AS and MR evaluated studies identified as potentially eligible for inclusion in the review. AS completed the updates with MR. Both AS and MR wrote the manuscript. AS acts as guarantor for this review.
Sources of support
Internal sources
-
No sources of support supplied
External sources
-
National Institute for Health Research, UK.
This systematic review was supported by the National Institute for Health Research, via Cochrane Infrastructure funding to the Cochrane Cystic Fibrosis and Genetic Disorders Group.
Declarations of interest
ARS declares relevant activities of membership of a MPEX steering committee, advisory board member (Vertex, Gilead and MPEX), lectures paid for by Gilead and Novartis.
MR declares no known conflict of interest.
Clarification statement added from Alan Smyth, Co‐ordinating Editor on 19 February 2020: This review was found by the Cochrane Funding Arbiters, post‐publication, to be noncompliant with the Cochrane conflict of interest policy, which includes the relevant parts of the Cochrane Commercial Sponsorship Policy. It will be updated by February 2021. The update will have a majority of authors and lead author free of conflicts.
Acknowledgements
We acknowledge the help of Dr Harris Stutman, who provided data from the cephalexin study (Stutman 2002). Dr Henry Ryley supplied individual patient data from the Chatfield study (Chatfield 1991). Prof Lawrence Weaver and Dr Michael Green, provided data from the Weaver study (Weaver 1994).
The current author team would also like to acknowledge the previous contributions of Dr Sarah Walters who stepped down from the review in 2016.
This project was supported by the National Institute for Health Research, via Cochrane Infrastructure funding to the Cochrane Cystic Fibrosis and Genetic Disorders Group. The views and opinions expressed therein are those of the authors and do not necessarily reflect those of the Systematic Reviews Programme, NIHR, NHS or the Department of Health.
Version history
| Published | Title | Stage | Authors | Version |
| 2020 Sep 30 | Prophylactic anti‐staphylococcal antibiotics for cystic fibrosis | Review | Margaret Rosenfeld, Oli Rayner, Alan R Smyth | |
| 2017 Apr 18 | Prophylactic anti‐staphylococcal antibiotics for cystic fibrosis | Review | Alan R Smyth, Margaret Rosenfeld | |
| 2014 Nov 24 | Prophylactic anti‐staphylococcal antibiotics for cystic fibrosis | Review | Alan R Smyth, Sarah Walters | |
| 2012 Dec 12 | Prophylactic anti‐staphylococcal antibiotics for cystic fibrosis | Review | Alan R Smyth, Sarah Walters | |
| 2003 Jul 21 | Prophylactic anti‐staphylococcal antibiotics for cystic fibrosis | Review | Alan R Smyth, Sarah Walters | |
Differences between protocol and review
We included a further outcome after the protocol was published: Clinical and radiological scoring. Although this was not an a priori hypothesis of this review, data from the Chatfield study are available for Shwachman and Chrispin‐Norman scores at three years (Chatfield 1991). The Shwachman score is a clinical score which includes symptoms, clinical examination findings, nutrition and radiology (Shwachman 1958). The Chrispin‐Norman score is an objective chest radiograph score (Chrispin 1974).
Keywords
MeSH
Medical Subject Headings (MeSH) Keywords
- *Antibiotic Prophylaxis;
- *Staphylococcus aureus [isolation & purification];
- Cystic Fibrosis [*microbiology];
- Drug Resistance, Bacterial;
- Forced Expiratory Volume;
- Pseudomonas aeruginosa [isolation & purification];
- Randomized Controlled Trials as Topic;
- Respiratory Tract Infections [*prevention & control];
- Staphylococcal Infections [*prevention & control];
Medical Subject Headings Check Words
Child; Child, Preschool; Humans; Infant; Infant, Newborn;
PICO
Comparison 1 Anti‐staphylococcal prophylaxis versus 'as required' treatment, Outcome 1 Lung function (% predicted).

Comparison 1 Anti‐staphylococcal prophylaxis versus 'as required' treatment, Outcome 2 Number of children from whom S aureus isolated at least once.
Comparison 1 Anti‐staphylococcal prophylaxis versus 'as required' treatment, Outcome 3 Z score weight.

Comparison 1 Anti‐staphylococcal prophylaxis versus 'as required' treatment, Outcome 4 Z score length.

Comparison 1 Anti‐staphylococcal prophylaxis versus 'as required' treatment, Outcome 5 Number of children requiring admission (annualised rates).

Comparison 1 Anti‐staphylococcal prophylaxis versus 'as required' treatment, Outcome 6 Days in hospital (annualised rates).
Comparison 1 Anti‐staphylococcal prophylaxis versus 'as required' treatment, Outcome 7 Number of children receiving additional antibiotics.
Comparison 1 Anti‐staphylococcal prophylaxis versus 'as required' treatment, Outcome 8 Days of additional antibiotics.

Comparison 1 Anti‐staphylococcal prophylaxis versus 'as required' treatment, Outcome 9 Number of children from whom H influenzae isolated at least once.

Comparison 1 Anti‐staphylococcal prophylaxis versus 'as required' treatment, Outcome 10 Number of children from whom P aeruginosa isolated at least once.

Comparison 1 Anti‐staphylococcal prophylaxis versus 'as required' treatment, Outcome 11 Adverse effects: mean number of days experiencing adverse effect.
Comparison 1 Anti‐staphylococcal prophylaxis versus 'as required' treatment, Outcome 12 Shwachman score.

Comparison 1 Anti‐staphylococcal prophylaxis versus 'as required' treatment, Outcome 13 Chrispin‐Norman Score.
| Prophylactic compared with 'as required' anti‐staphylococcal antibiotics for cystic fibrosis | ||||||
| Patient or population: children with cystic fibrosis Settings: outpatients Intervention: prophylactic anti‐staphylococcal antibiotics (prophylaxis) Comparison: anti‐staphylococcal antibiotics 'as required' | ||||||
| Outcomes | Illustrative comparative risks* (95% CI) | Relative effect | No of participants | Quality of the evidence | Comments | |
| Assumed risk | Corresponding risk | |||||
| 'As required' | Prophylaxis | |||||
| FEV₁ (% predicted (Knudson 1983)) Follow up: 6 years | The mean FEV₁ was 1.1 % predicted in the 'as required' group. | The mean FEV₁ was 0% predicted higher (0.08 % lower to 0.08 % higher) in the prophylaxis group. | NA | 119 (1 study) | ⊕⊕⊕⊝ | |
| Number of people with one or more isolates of S aureus (sensitive strains) Follow up: 2 years | 541 per 1000. | 114 per 1000 | OR 0.21 (95% CI 0.13 to 0.35). | 315 | ⊕⊕⊝⊝ | Significant advantages to prophylaxis antibiotics were also shown at the following time points. 1 year: OR 0.27 (95% CI 0.15 to 0.48). 3 years: OR 0.22 (95% CI 0.13 to 0.38). 4 years: OR 0.10 (95% CI 0.04 to 0.25). 5 years: OR 0.09 (95% CI 0.03 to 0.26). 6 years: OR 0.11 (95% CI 0.03 to 0.46). |
| Number of people with one or more isolates of P aeruginosa Follow up: 2 years | 346 per 1000. | 256 per 1000 (156 to 426). | OR 0.74 (95% CI 0.45 to 1.23). | 312 (3 studies) | ⊕⊕⊝⊝ | Trend towards more P aeruginosa in the intervention group at 4, 5 and 6 years. |
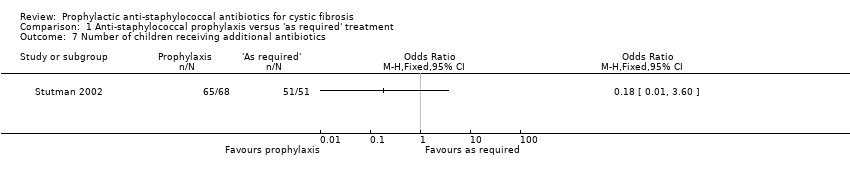
| Number of people needing additional antibiotics Follow up: up to 7 years | 1000 per 1000. | 180 per 1000 (10 to 1000). | OR 0.18 (95% CI 0.01 to 3.60). | 119 (1 study) | ⊕⊕⊝⊝ | |
| Weight (z score) Follow up: 2 years | The mean z score for weight ranged from ‐0.25 to ‐0.69 in the 'as required' group. | The mean z score for weight was 0.06 higher (0.03 lower to 0.45 higher) in the prophylaxis group. | NA | 140 (2 studies) | ⊕⊕⊝⊝ | There was also no significant difference between treatment groups at the following time points. 6 months: MD 0.30 (95% CI ‐0.54 to 1.14). 1 year: MD ‐0.12 (95% CI ‐0.50 to 0.26). 3 years: MD ‐0.14 (95% CI ‐0.58 to 0.30). |
| Acquisition of multiply‐resistant S aureus Follow up: NA | Outcome not reported | NA | ||||
| Adverse events of treatment Follow up: up to 7 years | See comment. | See comment. | NA | 119 (1 study) | ⊕⊕⊕⊝ | There were no significant differences between treatment groups in terms of generalised rash, nappy rash and increased stool frequency. |
| *The basis for the assumed risk is the control group risk (mean risk or event rate depending on type of outcome data) across studies. The corresponding risk (and its 95% confidence interval) is based on the assumed risk in the comparison group and the relative effect of the intervention (and its 95% CI). | ||||||
| GRADE Working Group grades of evidence | ||||||
| 1. Downgraded once due to incomplete outcome data: outcomes were measured only in the children completing treatment per protocol (Stutman 2002). | ||||||
| Measurement* | Baseline | At 1 year | ||
| Prophylaxis | As required | Prophylaxis | As required | |
| TGV (thoracic gas volume) | 0.05 | 0.98 | ‐0.22 | 0.09 |
| Gaw (airway conductance) | 1.16 | 0.00 | ‐1.79 | ‐1.13 |
| Vmax FRC (maximum flow at functional residual capacity) | ‐0.69 | ‐0.75 | ‐0.61 | ‐0.85 |
| *All lung function values expressed as standard error scores | ||||
| Outcome or subgroup title | No. of studies | No. of participants | Statistical method | Effect size |
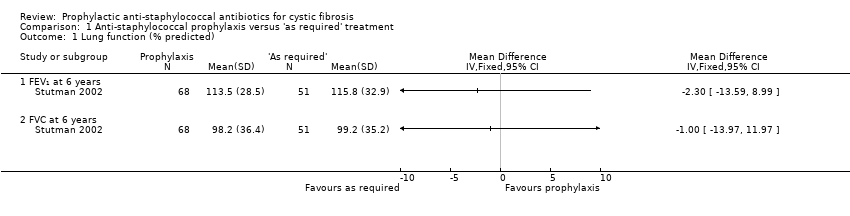
| 1 Lung function (% predicted) Show forest plot | 1 | Mean Difference (IV, Fixed, 95% CI) | Totals not selected | |
| 1.1 FEV₁ at 6 years | 1 | Mean Difference (IV, Fixed, 95% CI) | 0.0 [0.0, 0.0] | |
| 1.2 FVC at 6 years | 1 | Mean Difference (IV, Fixed, 95% CI) | 0.0 [0.0, 0.0] | |
| 2 Number of children from whom S aureus isolated at least once Show forest plot | 3 | Odds Ratio (M‐H, Fixed, 95% CI) | Subtotals only | |
| 2.1 1 year | 2 | 248 | Odds Ratio (M‐H, Fixed, 95% CI) | 0.27 [0.15, 0.48] |
| 2.2 2 years | 3 | 315 | Odds Ratio (M‐H, Fixed, 95% CI) | 0.21 [0.13, 0.35] |
| 2.3 3 years | 2 | 260 | Odds Ratio (M‐H, Fixed, 95% CI) | 0.22 [0.13, 0.38] |
| 2.4 4 years | 1 | 127 | Odds Ratio (M‐H, Fixed, 95% CI) | 0.10 [0.04, 0.25] |
| 2.5 5 years | 1 | 98 | Odds Ratio (M‐H, Fixed, 95% CI) | 0.09 [0.03, 0.26] |
| 2.6 6 years | 1 | 43 | Odds Ratio (M‐H, Fixed, 95% CI) | 0.11 [0.03, 0.46] |
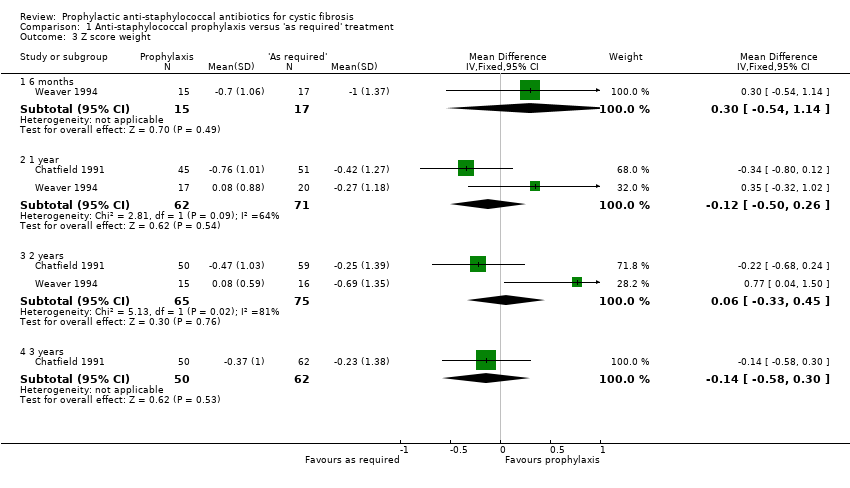
| 3 Z score weight Show forest plot | 2 | Mean Difference (IV, Fixed, 95% CI) | Subtotals only | |
| 3.1 6 months | 1 | 32 | Mean Difference (IV, Fixed, 95% CI) | 0.30 [‐0.54, 1.14] |
| 3.2 1 year | 2 | 133 | Mean Difference (IV, Fixed, 95% CI) | ‐0.12 [‐0.50, 0.26] |
| 3.3 2 years | 2 | 140 | Mean Difference (IV, Fixed, 95% CI) | 0.06 [‐0.33, 0.45] |
| 3.4 3 years | 1 | 112 | Mean Difference (IV, Fixed, 95% CI) | ‐0.14 [‐0.58, 0.30] |
| 4 Z score length Show forest plot | 2 | Mean Difference (IV, Fixed, 95% CI) | Subtotals only | |
| 4.1 6 months | 1 | 23 | Mean Difference (IV, Fixed, 95% CI) | 0.52 [‐0.36, 1.40] |
| 4.2 1 year | 2 | 127 | Mean Difference (IV, Fixed, 95% CI) | 0.06 [‐0.36, 0.48] |
| 4.3 2 years | 2 | 134 | Mean Difference (IV, Fixed, 95% CI) | ‐0.23 [‐0.65, 0.19] |
| 4.4 3 years | 1 | 112 | Mean Difference (IV, Fixed, 95% CI) | ‐0.07 [‐0.50, 0.36] |
| 5 Number of children requiring admission (annualised rates) Show forest plot | 3 | 243 | Odds Ratio (M‐H, Fixed, 95% CI) | 0.96 [0.50, 1.86] |
| 6 Days in hospital (annualised rates) Show forest plot | 3 | 242 | Mean Difference (IV, Fixed, 95% CI) | 0.88 [‐1.35, 3.10] |
| 7 Number of children receiving additional antibiotics Show forest plot | 1 | Odds Ratio (M‐H, Fixed, 95% CI) | Totals not selected | |
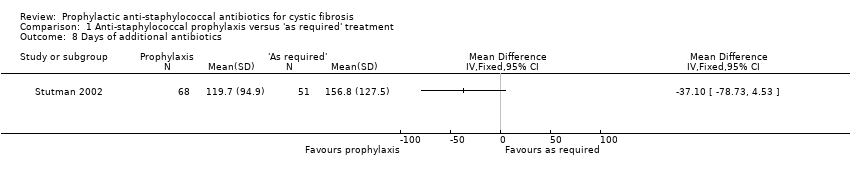
| 8 Days of additional antibiotics Show forest plot | 1 | Mean Difference (IV, Fixed, 95% CI) | Totals not selected | |
| 9 Number of children from whom H influenzae isolated at least once Show forest plot | 1 | Odds Ratio (M‐H, Fixed, 95% CI) | Totals not selected | |
| 9.1 2 years | 1 | Odds Ratio (M‐H, Fixed, 95% CI) | 0.0 [0.0, 0.0] | |
| 10 Number of children from whom P aeruginosa isolated at least once Show forest plot | 3 | Odds Ratio (M‐H, Fixed, 95% CI) | Subtotals only | |
| 10.1 1 year | 2 | 247 | Odds Ratio (M‐H, Fixed, 95% CI) | 1.42 [0.77, 2.60] |
| 10.2 2 years | 3 | 315 | Odds Ratio (M‐H, Fixed, 95% CI) | 0.74 [0.45, 1.23] |
| 10.3 3 years | 2 | 261 | Odds Ratio (M‐H, Fixed, 95% CI) | 0.88 [0.51, 1.51] |
| 10.4 4 years | 1 | 127 | Odds Ratio (M‐H, Fixed, 95% CI) | 1.28 [0.62, 2.64] |
| 10.5 5 years | 1 | 98 | Odds Ratio (M‐H, Fixed, 95% CI) | 1.97 [0.85, 4.58] |
| 10.6 6 years | 1 | 43 | Odds Ratio (M‐H, Fixed, 95% CI) | 3.67 [0.77, 17.35] |
| 11 Adverse effects: mean number of days experiencing adverse effect Show forest plot | 1 | Mean Difference (IV, Fixed, 95% CI) | Totals not selected | |
| 11.1 Generalised rash | 1 | Mean Difference (IV, Fixed, 95% CI) | 0.0 [0.0, 0.0] | |
| 11.2 Nappy rash | 1 | Mean Difference (IV, Fixed, 95% CI) | 0.0 [0.0, 0.0] | |
| 11.3 Increased stool frequency | 1 | Mean Difference (IV, Fixed, 95% CI) | 0.0 [0.0, 0.0] | |
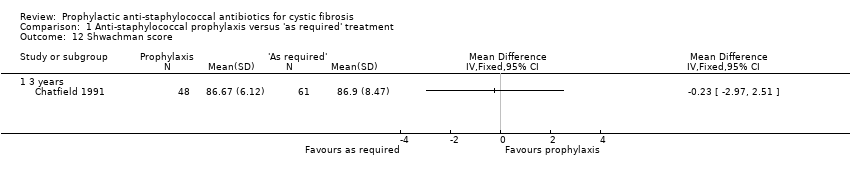
| 12 Shwachman score Show forest plot | 1 | Mean Difference (IV, Fixed, 95% CI) | Totals not selected | |
| 12.1 3 years | 1 | Mean Difference (IV, Fixed, 95% CI) | 0.0 [0.0, 0.0] | |
| 13 Chrispin‐Norman Score Show forest plot | 1 | Mean Difference (IV, Fixed, 95% CI) | Totals not selected | |
| 13.1 3 years | 1 | Mean Difference (IV, Fixed, 95% CI) | 0.0 [0.0, 0.0] | |