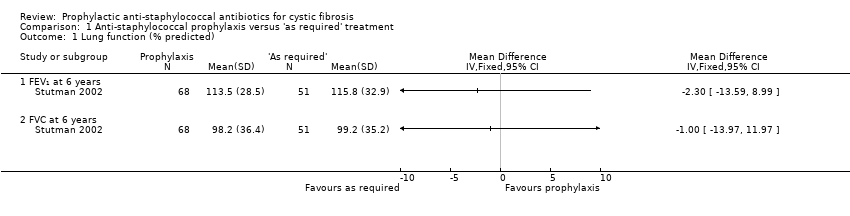
| 1 Lung function (% predicted) Show forest plot | 1 | | Mean Difference (IV, Fixed, 95% CI) | Totals not selected |
|
| 1.1 FEV₁ at 6 years | 1 | | Mean Difference (IV, Fixed, 95% CI) | 0.0 [0.0, 0.0] |
| 1.2 FVC at 6 years | 1 | | Mean Difference (IV, Fixed, 95% CI) | 0.0 [0.0, 0.0] |
| 2 Number of children from whom S aureus isolated at least once Show forest plot | 3 | | Odds Ratio (M‐H, Fixed, 95% CI) | Subtotals only |
|
| 2.1 1 year | 2 | 248 | Odds Ratio (M‐H, Fixed, 95% CI) | 0.27 [0.15, 0.48] |
| 2.2 2 years | 3 | 315 | Odds Ratio (M‐H, Fixed, 95% CI) | 0.21 [0.13, 0.35] |
| 2.3 3 years | 2 | 260 | Odds Ratio (M‐H, Fixed, 95% CI) | 0.22 [0.13, 0.38] |
| 2.4 4 years | 1 | 127 | Odds Ratio (M‐H, Fixed, 95% CI) | 0.10 [0.04, 0.25] |
| 2.5 5 years | 1 | 98 | Odds Ratio (M‐H, Fixed, 95% CI) | 0.09 [0.03, 0.26] |
| 2.6 6 years | 1 | 43 | Odds Ratio (M‐H, Fixed, 95% CI) | 0.11 [0.03, 0.46] |
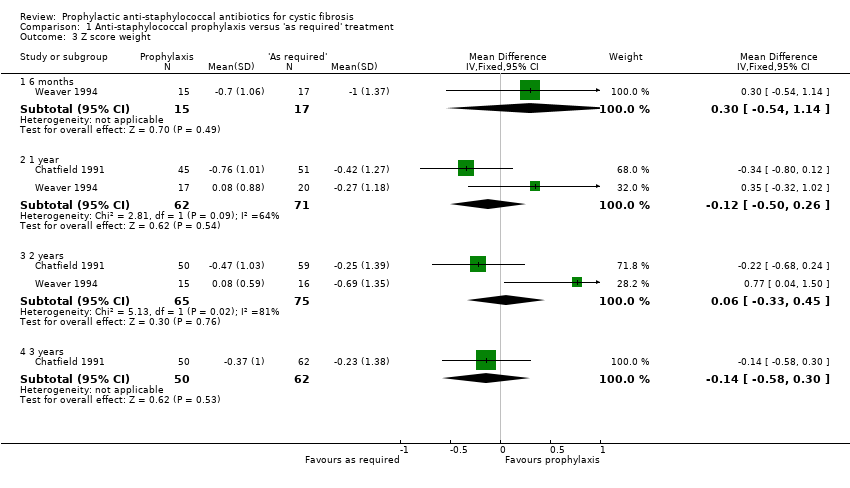
| 3 Z score weight Show forest plot | 2 | | Mean Difference (IV, Fixed, 95% CI) | Subtotals only |
|
| 3.1 6 months | 1 | 32 | Mean Difference (IV, Fixed, 95% CI) | 0.30 [‐0.54, 1.14] |
| 3.2 1 year | 2 | 133 | Mean Difference (IV, Fixed, 95% CI) | ‐0.12 [‐0.50, 0.26] |
| 3.3 2 years | 2 | 140 | Mean Difference (IV, Fixed, 95% CI) | 0.06 [‐0.33, 0.45] |
| 3.4 3 years | 1 | 112 | Mean Difference (IV, Fixed, 95% CI) | ‐0.14 [‐0.58, 0.30] |
| 4 Z score length Show forest plot | 2 | | Mean Difference (IV, Fixed, 95% CI) | Subtotals only |
|
| 4.1 6 months | 1 | 23 | Mean Difference (IV, Fixed, 95% CI) | 0.52 [‐0.36, 1.40] |
| 4.2 1 year | 2 | 127 | Mean Difference (IV, Fixed, 95% CI) | 0.06 [‐0.36, 0.48] |
| 4.3 2 years | 2 | 134 | Mean Difference (IV, Fixed, 95% CI) | ‐0.23 [‐0.65, 0.19] |
| 4.4 3 years | 1 | 112 | Mean Difference (IV, Fixed, 95% CI) | ‐0.07 [‐0.50, 0.36] |
| 5 Number of children requiring admission (annualised rates) Show forest plot | 3 | 243 | Odds Ratio (M‐H, Fixed, 95% CI) | 0.96 [0.50, 1.86] |
|
| 6 Days in hospital (annualised rates) Show forest plot | 3 | 242 | Mean Difference (IV, Fixed, 95% CI) | 0.88 [‐1.35, 3.10] |
|
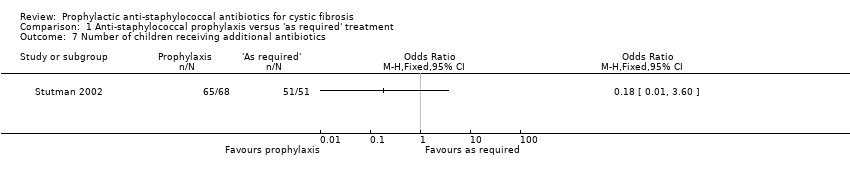
| 7 Number of children receiving additional antibiotics Show forest plot | 1 | | Odds Ratio (M‐H, Fixed, 95% CI) | Totals not selected |
|
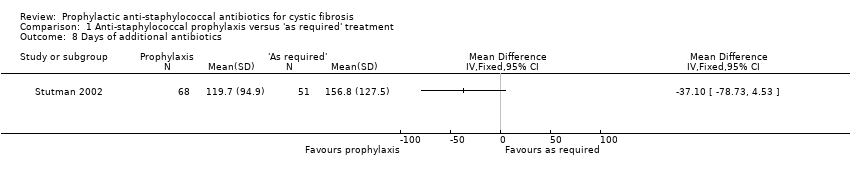
| 8 Days of additional antibiotics Show forest plot | 1 | | Mean Difference (IV, Fixed, 95% CI) | Totals not selected |
|
| 9 Number of children from whom H influenzae isolated at least once Show forest plot | 1 | | Odds Ratio (M‐H, Fixed, 95% CI) | Totals not selected |
|
| 9.1 2 years | 1 | | Odds Ratio (M‐H, Fixed, 95% CI) | 0.0 [0.0, 0.0] |
| 10 Number of children from whom P aeruginosa isolated at least once Show forest plot | 3 | | Odds Ratio (M‐H, Fixed, 95% CI) | Subtotals only |
|
| 10.1 1 year | 2 | 247 | Odds Ratio (M‐H, Fixed, 95% CI) | 1.42 [0.77, 2.60] |
| 10.2 2 years | 3 | 315 | Odds Ratio (M‐H, Fixed, 95% CI) | 0.74 [0.45, 1.23] |
| 10.3 3 years | 2 | 261 | Odds Ratio (M‐H, Fixed, 95% CI) | 0.88 [0.51, 1.51] |
| 10.4 4 years | 1 | 127 | Odds Ratio (M‐H, Fixed, 95% CI) | 1.28 [0.62, 2.64] |
| 10.5 5 years | 1 | 98 | Odds Ratio (M‐H, Fixed, 95% CI) | 1.97 [0.85, 4.58] |
| 10.6 6 years | 1 | 43 | Odds Ratio (M‐H, Fixed, 95% CI) | 3.67 [0.77, 17.35] |
| 11 Adverse effects: mean number of days experiencing adverse effect Show forest plot | 1 | | Mean Difference (IV, Fixed, 95% CI) | Totals not selected |
|
| 11.1 Generalised rash | 1 | | Mean Difference (IV, Fixed, 95% CI) | 0.0 [0.0, 0.0] |
| 11.2 Nappy rash | 1 | | Mean Difference (IV, Fixed, 95% CI) | 0.0 [0.0, 0.0] |
| 11.3 Increased stool frequency | 1 | | Mean Difference (IV, Fixed, 95% CI) | 0.0 [0.0, 0.0] |
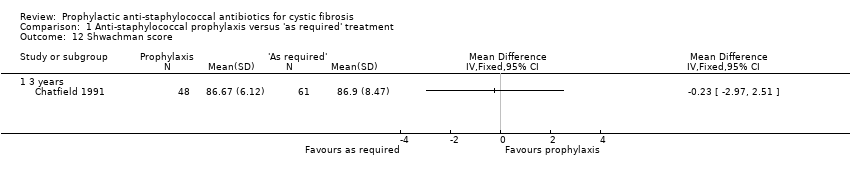
| 12 Shwachman score Show forest plot | 1 | | Mean Difference (IV, Fixed, 95% CI) | Totals not selected |
|
| 12.1 3 years | 1 | | Mean Difference (IV, Fixed, 95% CI) | 0.0 [0.0, 0.0] |
| 13 Chrispin‐Norman Score Show forest plot | 1 | | Mean Difference (IV, Fixed, 95% CI) | Totals not selected |
|
| 13.1 3 years | 1 | | Mean Difference (IV, Fixed, 95% CI) | 0.0 [0.0, 0.0] |