Prophylactic anti‐staphylococcal antibiotics for cystic fibrosis
Información
- DOI:
- https://doi.org/10.1002/14651858.CD001912.pub3Copiar DOI

- Base de datos:
-
- Cochrane Database of Systematic Reviews
- Versión publicada:
-
- 24 noviembre 2014see what's new
- Tipo:
-
- Intervention
- Etapa:
-
- Review
- Grupo Editorial Cochrane:
-
Grupo Cochrane de Fibrosis quística y enfermedades genéticas
- Copyright:
-
- Copyright © 2014 The Cochrane Collaboration. Published by John Wiley & Sons, Ltd.
Cifras del artículo
Altmetric:
Citado por:
Autores
Contributions of authors
Both AS and SW evaluated which studies should be included in the review. AS analysed the data. AS and SW both interpreted the results. AS liaised with the authors of the studies included in this review to obtain additional data.
AS completed the updates with additional comments from SW and he acts as guarantor for this review.
Declarations of interest
ARS declares relevant activities of membership of a MPEX steering committee, advisory board member (Vertex, Gilead and MPEX), lecture paid for by Gilead.
SW declares no known potential conflict of interest.
Acknowledgements
The authors acknowledge the help of Dr Harris Stutman, who provided data from the cephalexin study that has made this updated review possible (Stutman 2002). Dr Henry Ryley supplied individual patient data from the Chatfield study (Chatfield 1991). Prof Lawrence Weaver and Dr Michael Green, provided data from the Weaver study (Weaver 1994).
Version history
| Published | Title | Stage | Authors | Version |
| 2020 Sep 30 | Prophylactic anti‐staphylococcal antibiotics for cystic fibrosis | Review | Margaret Rosenfeld, Oli Rayner, Alan R Smyth | |
| 2017 Apr 18 | Prophylactic anti‐staphylococcal antibiotics for cystic fibrosis | Review | Alan R Smyth, Margaret Rosenfeld | |
| 2014 Nov 24 | Prophylactic anti‐staphylococcal antibiotics for cystic fibrosis | Review | Alan R Smyth, Sarah Walters | |
| 2012 Dec 12 | Prophylactic anti‐staphylococcal antibiotics for cystic fibrosis | Review | Alan R Smyth, Sarah Walters | |
| 2003 Jul 21 | Prophylactic anti‐staphylococcal antibiotics for cystic fibrosis | Review | Alan R Smyth, Sarah Walters | |
Differences between protocol and review
The authors included a further outcome after the protocol was published: Clinical and radiological scoring. Although this was not an a priori hypothesis of this review, data from the Chatfield study are available for Shwachman and Chrispin‐Norman scores at three years (Chatfield 1991). The Shwachman score is a clinical score which includes symptoms, clinical examination findings, nutrition and radiology (Shwachman 1958). The Chrispin‐Norman score is an objective chest radiograph score (Chrispin 1974).
Keywords
MeSH
Medical Subject Headings (MeSH) Keywords
- *Antibiotic Prophylaxis;
- *Staphylococcus aureus [isolation & purification];
- Cystic Fibrosis [*microbiology];
- Drug Resistance, Bacterial;
- Forced Expiratory Volume;
- Pseudomonas aeruginosa [isolation & purification];
- Randomized Controlled Trials as Topic;
- Respiratory Tract Infections [*prevention & control];
- Staphylococcal Infections [*prevention & control];
Medical Subject Headings Check Words
Child; Child, Preschool; Humans; Infant; Infant, Newborn;
PICO

Comparison 1 Continuous, oral, anti‐staphylococcal antibiotic prophylaxis, Outcome 1 Lung function.

Comparison 1 Continuous, oral, anti‐staphylococcal antibiotic prophylaxis, Outcome 2 Number of children from whom S. aureus isolated at least once.

Comparison 1 Continuous, oral, anti‐staphylococcal antibiotic prophylaxis, Outcome 3 Z score weight (6 months to 3 years).

Comparison 1 Continuous, oral, anti‐staphylococcal antibiotic prophylaxis, Outcome 4 Z score length (6 months to 3 years).

Comparison 1 Continuous, oral, anti‐staphylococcal antibiotic prophylaxis, Outcome 5 Number of children requiring admission (annualised rates).
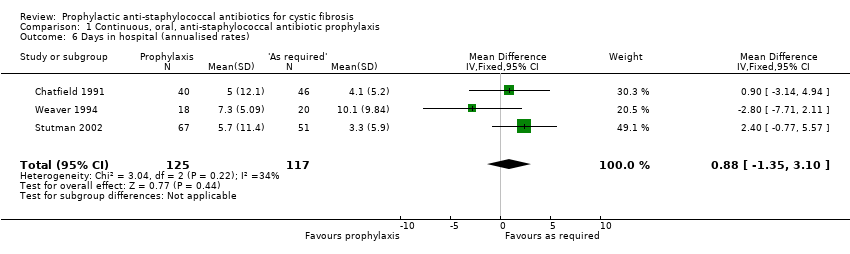
Comparison 1 Continuous, oral, anti‐staphylococcal antibiotic prophylaxis, Outcome 6 Days in hospital (annualised rates).

Comparison 1 Continuous, oral, anti‐staphylococcal antibiotic prophylaxis, Outcome 7 Number of children receiving additional antibiotics.

Comparison 1 Continuous, oral, anti‐staphylococcal antibiotic prophylaxis, Outcome 8 Days of additional antibiotics.

Comparison 1 Continuous, oral, anti‐staphylococcal antibiotic prophylaxis, Outcome 9 Number of children from whom H. influenzae isolated at least once.

Comparison 1 Continuous, oral, anti‐staphylococcal antibiotic prophylaxis, Outcome 10 Number of children from whom P. aeruginosa isolated at least once.

Comparison 1 Continuous, oral, anti‐staphylococcal antibiotic prophylaxis, Outcome 11 Adverse effects.

Comparison 1 Continuous, oral, anti‐staphylococcal antibiotic prophylaxis, Outcome 12 Shwachman score.

Comparison 1 Continuous, oral, anti‐staphylococcal antibiotic prophylaxis, Outcome 13 Chrispin‐Norman Score.
| Measurement | Prophylaxis (start) | As required (start) | Prophylaxis (1 year) | As required (1 year) |
| TGV (thoracic gas volume) | 0.05 | 0.98 | ‐0.22 | 0.09 |
| Gaw (airway conductance) | 1.16 | 0.00 | ‐1.79 | ‐1.13 |
| Vmax FRC (maximum flow at functional residual capacity) | ‐0.69 | ‐0.75 | ‐0.61 | ‐0.85 |
| (All lung function values expressed as standard error scores) |
| Outcome or subgroup title | No. of studies | No. of participants | Statistical method | Effect size |
| 1 Lung function Show forest plot | 1 | Mean Difference (IV, Fixed, 95% CI) | Totals not selected | |
| 1.1 FEV1 at 6 years | 1 | Mean Difference (IV, Fixed, 95% CI) | 0.0 [0.0, 0.0] | |
| 1.2 FVC at 6 years | 1 | Mean Difference (IV, Fixed, 95% CI) | 0.0 [0.0, 0.0] | |
| 2 Number of children from whom S. aureus isolated at least once Show forest plot | 3 | Odds Ratio (M‐H, Fixed, 95% CI) | Subtotals only | |
| 2.1 1 year | 2 | 248 | Odds Ratio (M‐H, Fixed, 95% CI) | 0.27 [0.15, 0.48] |
| 2.2 2 years | 3 | 315 | Odds Ratio (M‐H, Fixed, 95% CI) | 0.21 [0.13, 0.35] |
| 2.3 3 years | 2 | 260 | Odds Ratio (M‐H, Fixed, 95% CI) | 0.22 [0.13, 0.38] |
| 2.4 4 years | 1 | 127 | Odds Ratio (M‐H, Fixed, 95% CI) | 0.10 [0.04, 0.25] |
| 2.5 5 years | 1 | 98 | Odds Ratio (M‐H, Fixed, 95% CI) | 0.09 [0.03, 0.26] |
| 2.6 6 years | 1 | 43 | Odds Ratio (M‐H, Fixed, 95% CI) | 0.11 [0.03, 0.46] |
| 3 Z score weight (6 months to 3 years) Show forest plot | 2 | Mean Difference (IV, Fixed, 95% CI) | Subtotals only | |
| 3.1 6 months | 1 | 32 | Mean Difference (IV, Fixed, 95% CI) | 0.30 [‐0.54, 1.14] |
| 3.2 1 year | 2 | 133 | Mean Difference (IV, Fixed, 95% CI) | ‐0.12 [‐0.50, 0.26] |
| 3.3 2 years | 2 | 140 | Mean Difference (IV, Fixed, 95% CI) | 0.06 [‐0.33, 0.45] |
| 3.4 3 years | 1 | 112 | Mean Difference (IV, Fixed, 95% CI) | ‐0.14 [‐0.58, 0.30] |
| 4 Z score length (6 months to 3 years) Show forest plot | 2 | Mean Difference (IV, Fixed, 95% CI) | Subtotals only | |
| 4.1 6 months | 1 | 23 | Mean Difference (IV, Fixed, 95% CI) | 0.52 [‐0.36, 1.40] |
| 4.2 1 year | 2 | 127 | Mean Difference (IV, Fixed, 95% CI) | 0.06 [‐0.36, 0.48] |
| 4.3 2 years | 2 | 134 | Mean Difference (IV, Fixed, 95% CI) | ‐0.23 [‐0.65, 0.19] |
| 4.4 3 years | 1 | 112 | Mean Difference (IV, Fixed, 95% CI) | ‐0.07 [‐0.50, 0.36] |
| 5 Number of children requiring admission (annualised rates) Show forest plot | 3 | 243 | Odds Ratio (M‐H, Fixed, 95% CI) | 0.96 [0.50, 1.86] |
| 6 Days in hospital (annualised rates) Show forest plot | 3 | 242 | Mean Difference (IV, Fixed, 95% CI) | 0.88 [‐1.35, 3.10] |
| 7 Number of children receiving additional antibiotics Show forest plot | 1 | Odds Ratio (M‐H, Fixed, 95% CI) | Totals not selected | |
| 8 Days of additional antibiotics Show forest plot | 1 | Mean Difference (IV, Fixed, 95% CI) | Totals not selected | |
| 9 Number of children from whom H. influenzae isolated at least once Show forest plot | 1 | Odds Ratio (M‐H, Fixed, 95% CI) | Totals not selected | |
| 9.1 2 years | 1 | Odds Ratio (M‐H, Fixed, 95% CI) | 0.0 [0.0, 0.0] | |
| 10 Number of children from whom P. aeruginosa isolated at least once Show forest plot | 3 | Odds Ratio (M‐H, Fixed, 95% CI) | Subtotals only | |
| 10.1 1 year | 2 | 247 | Odds Ratio (M‐H, Fixed, 95% CI) | 1.42 [0.77, 2.60] |
| 10.2 2 years | 3 | 315 | Odds Ratio (M‐H, Fixed, 95% CI) | 0.74 [0.45, 1.23] |
| 10.3 3 years | 2 | 261 | Odds Ratio (M‐H, Fixed, 95% CI) | 0.88 [0.51, 1.51] |
| 10.4 4 years | 1 | 127 | Odds Ratio (M‐H, Fixed, 95% CI) | 1.28 [0.62, 2.64] |
| 10.5 5 years | 1 | 98 | Odds Ratio (M‐H, Fixed, 95% CI) | 1.97 [0.85, 4.58] |
| 10.6 6 years | 1 | 43 | Odds Ratio (M‐H, Fixed, 95% CI) | 3.67 [0.77, 17.35] |
| 11 Adverse effects Show forest plot | 1 | Mean Difference (IV, Fixed, 95% CI) | Subtotals only | |
| 11.1 Generalised rash | 1 | 119 | Mean Difference (IV, Fixed, 95% CI) | 0.40 [‐0.07, 0.87] |
| 11.2 Nappy rash | 1 | 119 | Mean Difference (IV, Fixed, 95% CI) | 0.90 [‐1.06, 2.86] |
| 11.3 Increased stool frequency | 1 | 119 | Mean Difference (IV, Fixed, 95% CI) | 0.20 [‐2.18, 2.58] |
| 12 Shwachman score Show forest plot | 1 | Mean Difference (IV, Fixed, 95% CI) | Totals not selected | |
| 12.1 3 years | 1 | Mean Difference (IV, Fixed, 95% CI) | 0.0 [0.0, 0.0] | |
| 13 Chrispin‐Norman Score Show forest plot | 1 | Mean Difference (IV, Fixed, 95% CI) | Totals not selected | |
| 13.1 3 years | 1 | Mean Difference (IV, Fixed, 95% CI) | 0.0 [0.0, 0.0] | |