Scolaris Content Display Scolaris Content Display

Comparison 1 live births, Outcome 1 per woman randomised, following this set of cycles.
Figuras y tablas -
Analysis 1.1

Comparison 1 live births, Outcome 1 per woman randomised, following this set of cycles.

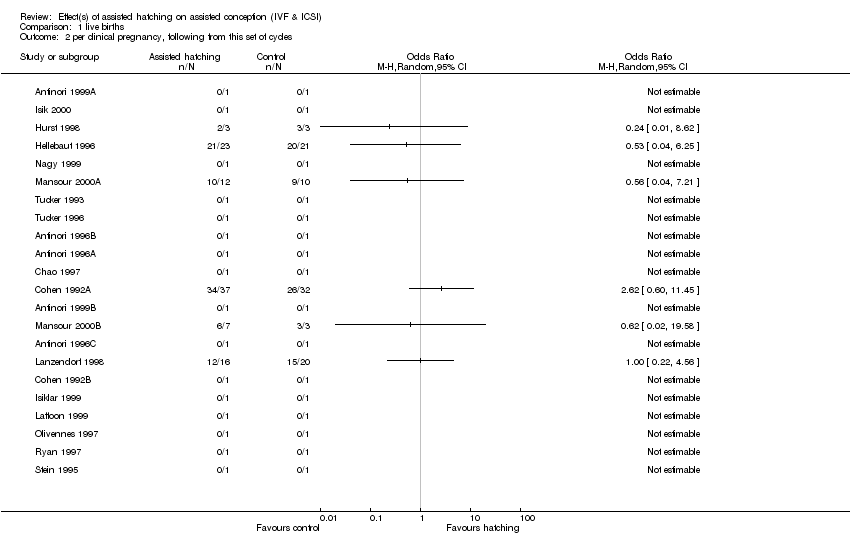
Comparison 1 live births, Outcome 2 per clinical pregnancy, following from this set of cycles.
Figuras y tablas -
Analysis 1.2

Comparison 1 live births, Outcome 2 per clinical pregnancy, following from this set of cycles.

Comparison 2 clinical pregnancy, Outcome 1 rate per woman randomised.
Figuras y tablas -
Analysis 2.1

Comparison 2 clinical pregnancy, Outcome 1 rate per woman randomised.

Comparison 2 clinical pregnancy, Outcome 2 Subgrouping according to first or repeat IVF attempt.
Figuras y tablas -
Analysis 2.2

Comparison 2 clinical pregnancy, Outcome 2 Subgrouping according to first or repeat IVF attempt.

Comparison 3 miscarriages, Outcome 1 per clinical pregnancy.
Figuras y tablas -
Analysis 3.1

Comparison 3 miscarriages, Outcome 1 per clinical pregnancy.

Table 1. Mean age of participants in assisted hatching and control groups

Study

n, mean age (sd) AH

n, mean age (sd) con

WMD (95% CI)

Antinori 1996A

104, 34.60 (5.20)

104, 34.80 (5.10)

‐0.20 (‐1.60 to 1.20)

Antinori 1996B

104, 34.40 (5.10)

121, 34.60 (5.20)

‐0.20 (‐1.55 to 1.15)

Antinori 1996C

72, 38.2 (1.32)

98, 37.80 (1.48)

0.40 (‐0.02 to 0.82)

Baruffi 2000

51, 31.80 (3.60)

52, 31.40 (3.60)

0.40 (‐0.99 to 1.79)

Chao 1997

33, 36.50 (5.20)

31, 34.00 (3.90)

2.50 (0.26 TO 4.74)

Cohen 1992A

39, 36.50 (3.30)

68, 36.70 (3.70)

‐0.20 (‐1.37 to 0.97)

Hellebaut 1996

60, 30.90 (4.30)

60, 30.80 (3.90)

0.10 (‐1.37 to 1.57)

Hurst 1998

13, 30.00 (0.90)

7, 30.00 (0.80)

0.00 (‐0.77 to 0.77)

Isik 2000

24, 30.50 (5.20)

22, 29.10 (3.60)

1.40 (‐1.17 to 3.97)

Lanzendorf 1998

41, 38.30 (0.31)

48, 38.50 (0.26)

‐0.20 (‐0.32 to ‐0.08)

Mansour 2000A

27, 32.10 (2.50)

25, 33.20 (1.40)

‐1.10 (‐2.19 to ‐0.01)

Mansour 2000B

30, 37.30 (5.60)

41, 36.30 (5.20)

1.00 (‐1.56 to 3.56)

Nagy 1999

20, 32.00 (4.00)

20, 31.40 (3.70)

0.60 (‐1.79 to 2.99)

Tucker 1993

110, 34.10 (4.80)

108, 34.20 (4.10)

‐0.10 (‐1.28 to 1.08)

Tucker 1996

50, 35.30 (4.20)

50, 33.50 (4.30)

1.80 (0.13 to 3.47)

Figuras y tablas -
Table 1. Mean age of participants in assisted hatching and control groups
Table 2. Meta‐analysis, subgrouping and sensitivity analysis results

Outcome

Analysis type

Description

No. of studies

OR (random effects)

95% CI

heterogeneity p

Live births, per woman randomised

Overall meta‐analysis

6

1.21

1.82 to 1.78

0.43

Live births, per woman randomised

Sensitivity analysis

Allocation concealment

0

Live births, per woman randomised

Sensitivity analysis

Method of randomisation

4

1.13

0.72 to 1.76

0.37

Live births, per woman randomised

Sensitivity analysis

Unbalanced or unreported age

4

1.31

0.71 to 2.43

0.23

Clinical pregnancy, per woman randomised

Overall meta‐analysis

19

1.63

1.27 to 2.09

0.05

Clinical pregnancy, per woman randomised

Sensitivity analysis

Allocation concealment

0

Clinical pregnancy, per woman randomised

Sensitivity analysis

Method of randomisation

7

1.34

0.79 to 2.26

0.03

Clinical pregnancy, per woman randomised

Sensitivity analysis

Unbalanced or unreported age

10

1.81

1.23 to 2.66

0.02

Clinical pregnancy, per woman randomised

Sub‐grouping

First IVF attempt

4

1.40

0.77 to 2.53

0.05

Clinical pregnancy, per woman randomised

Sub‐grouping

Repeat IVF attempt

4

2.33

1.63 to 3.34

0.51

Implantations, per woman randomised

Overall meta‐analysis

15

1.97 (incorrect, several implantations may be counted per woman)

1.28 to 3.03

<0.01

Implantations, per woman randomised

Sensitivity analysis

Allocation concealment

0

Implantations, per woman randomised

Sensitivity analysis

Method of randomisation

9

2.10 (incorrect, several implantations may be counted per woman)

1.12 to 3.92

<0.01

Implantations, per woman randomised

Sensitivity analysis

Unbalanced or unreported age

10

2.11 (incorrect, several implantations may be counted per woman)

1.35 to 3.28

<0.01

Implantations, per embryo transferred

Overall meta‐analysis

15

1.52 (incorrect, several implantations may be counted per woman)

1.16 to 2.00 (incorrect, real 95% CI would be wider)!!

<0.01

Miscarriage, per clinical pregnancy

Overall meta‐analysis

11

0.70

0.41 to 1.19 (may be too wide as clinical pregnancies fewer than women randomised)

0.91

Live births, per clinical pregnancy

Overall meta‐analysis

6

1.07

0.46 to 2.52 (may be too wide as clinical pregnancies fewer than women randomised)

0.74

Mean age in AH and control groups

Overall meta‐analysis

15

WMD = 0.09 years

‐0.24 to 0.43

0.05

Figuras y tablas -
Table 2. Meta‐analysis, subgrouping and sensitivity analysis results
Table 3. Metaregression results, effect of assisted hatching on clinical pregnancy

analysis

explanatory variable

slope coefficient

95% CI

p‐value for slope

no. of trials

overall meta‐regression

mean maternal age in intervention group

0.053

‐0.0004 to 0.1054

0.052

19 (some of these are subgroups from within trials)

sensitivity analysis removing age‐unbalanced studies

mean maternal age in intervention group

0.097

‐0.0025 to 0.1970

0.056

10 (some of these are subgroups from within trials)

sensitivity analysis removing studies where randomisation method unclear

mean maternal age in intervention group

0.068

‐0.0168 to 0.1520

0.116

7 (some of these are subgroups from within trials)

Figuras y tablas -
Table 3. Metaregression results, effect of assisted hatching on clinical pregnancy
Table 4. Implantation data

Study

implantations, AH

women rand., AH

embryos trans., AH

imlant., control

women rand., cont.

embryos trans., cont

Antinori 1996A

46

96

376

28

104

381

Antinori 1996B

47

111

397

29

121

411

Antinori 1996C

35

72

218

21

98

407

Baruffi 2000

25

51

141

31

52

149

Chao 1997

17

33

155

5

31

1134

Cohen 1992A

67

69

239

49

68

229

Cohen 1992B

10

15

38

4

15

41

Hellebaut 1996

30

60

168

28

60

162

Hurst 1998

5

13

52

3

7

28

Isik 2000

17

24

71

12

22

63

Isiklar 1999

32

83

13

78

Lanzendorf 1998

20

41

183

24

48

219

Nagy 1999

11

20

65

2

20

52

Tucker 1993

73

110

333

59

108

312

Tucker 1996

16

50

189

25

50

184

Figuras y tablas -
Table 4. Implantation data
Comparison 1. live births

Outcome or subgroup title

No. of studies

No. of participants

Statistical method

Effect size

1 per woman randomised, following this set of cycles Show forest plot

23

523

Odds Ratio (M‐H, Random, 95% CI)

1.21 [0.82, 1.78]

2 per clinical pregnancy, following from this set of cycles Show forest plot

22

Odds Ratio (M‐H, Random, 95% CI)

Totals not selected

Figuras y tablas -
Comparison 1. live births
Comparison 2. clinical pregnancy

Outcome or subgroup title

No. of studies

No. of participants

Statistical method

Effect size

1 rate per woman randomised Show forest plot

19

2175

Odds Ratio (M‐H, Random, 95% CI)

1.63 [1.27, 2.09]

2 Subgrouping according to first or repeat IVF attempt Show forest plot

8

Odds Ratio (M‐H, Random, 95% CI)

Subtotals only

2.1 First attempt at IVF or ICSI

4

586

Odds Ratio (M‐H, Random, 95% CI)

1.40 [0.77, 2.53]

2.2 Repeat attempt at IVF or ICSI

4

666

Odds Ratio (M‐H, Random, 95% CI)

2.33 [1.63, 3.34]

Figuras y tablas -
Comparison 2. clinical pregnancy
Comparison 3. miscarriages

Outcome or subgroup title

No. of studies

No. of participants

Statistical method

Effect size

1 per clinical pregnancy Show forest plot

11

Odds Ratio (M‐H, Random, 95% CI)

Totals not selected

Figuras y tablas -
Comparison 3. miscarriages