Anestésicos locales epidurales versus regímenes analgésicos con opiáceos para la parálisis gastrointestinal, los vómitos y el dolor después de la cirugía abdominal
Información
- DOI:
- https://doi.org/10.1002/14651858.CD001893.pub2Copiar DOI

- Base de datos:
-
- Cochrane Database of Systematic Reviews
- Versión publicada:
-
- 15 julio 2016see what's new
- Tipo:
-
- Intervention
- Etapa:
-
- Review
- Grupo Editorial Cochrane:
-
Grupo Cochrane de Anestesia
- Copyright:
-
- Copyright © 2017 The Cochrane Collaboration. Published by John Wiley & Sons, Ltd.
Cifras del artículo
Altmetric:
Citado por:
Autores
Contributions of authors
Conceiving of the review: Joanne Guay (JG) and Sandra Kopp (SK).
Co‐ordinating the review: JG.
Screening search results: JG.
Screening retrieved papers against inclusion criteria: JG and Mina Nishimori (MN).
Appraising the quality of papers: JG and MN.
Abstracting data from papers: JG and MN.
Managing data for the review: JG.
Entering data into Review Manager: JG.
Analysing RevMan statistical data: JG.
Performing other statistical analysis not using RevMan: JG.
Interpreting data: JG, MN and SK.
Making statistical inferences: JG.
Writing the review: JG, MN and SK.
Securing funding for the review: departmental resources only.
Performing previous work that was the foundation of the present study: JG and SK.
Serving as guarantor for the review: JG.
Taking responsibility for reading and checking the review before submission: JG, MN and SK.
Sources of support
Internal sources
-
University of Quebec en Abitibi Temiscamingue (UQAT), Canada.
UQAT provided the articles (in part)
-
University of Montreal, Canada.
University of Montreal provided access to databases and some of the articles
External sources
-
No sources of support supplied
Declarations of interest
Joanne Guay: I have had no direct relationship with any pharmaceutical company or equipment manufacturer in the past five years. I have not acted as a witness expert in the past five years. I am not an author of any of the included or excluded studies. I do not hold stock other than mutual funds. I am the editor of a multi‐author textbook on anaesthesia (including notions on general and regional anaesthesia). I receive fees for a course on airway management at University of Quebec, in Abitibi‐Temiscamingue.
Mina Nishimori: no conflicts of interest.
Sandra Kopp: no conflicts of interest.
Acknowledgements
The review authors wish to thank the University of Quebec in Abitibi Temiscamingue, the University of Sherbrooke and the University of Montreal for providing access to electronic databases and medical journals. We also wish to thank Dat Nhut Nguyen, who participated in data extraction and gradation of the level of evidence but preferred to withdraw from the review on May 28, 2015, because of lack of academic time. We also thank Jia Jiang for the translation of Chinese studies (Cai 2007; Han 2005; Hu 2006; Liu 2005; Wang 2010; Zeng 2003). We extend our thanks to Honario T Benzon (Benzon 1994), Joergen B. Dahl (Bisgaard 1990), Joel Katz (Boylan 1998), Franco Carli (Carli 1997; Lugli 2008; Lugli 2010), Enrique Calderón (Calderon 2004), Joergen B Dahl (Dahl 1992), Christian Jayr (Jayr 1998; Motamed 1998), Rainer Kentner (Kentner 1996), Leonidas Grigorakos (Limberi 2003), Luc Massicotte (Mondor 2010), Michael G. Rockemann (Rockemann 1997), Henrik Kehlet (Schulze 1988; Schulze 1992), Roman Schumann (Schumann 2003), Charles Gibson (Steinberg 2002) and S.L. Tsui (Tsui 1997), who provided additional information on their studies or took the time to reply when data were no longer available, and Nesrine El‐Refai (El‐Refai 2003), who graciously provided a copy of his article.
We also wish to thank Mark Neuman (content editor), Cathal Walsh (statistical editor), Paul S. Myles, Fahad Javaid Siddiqui, James Paul (peer reviewers), Shunjie Chua (consumer referee) for their help and editorial advice during the preparation of this updated systematic review.
Version history
| Published | Title | Stage | Authors | Version |
| 2016 Jul 15 | Epidural local anaesthetics versus opioid‐based analgesic regimens for postoperative gastrointestinal paralysis, vomiting and pain after abdominal surgery | Review | Joanne Guay, Mina Nishimori, Sandra Kopp | |
| 2001 Jan 22 | Epidural local anaesthetics versus opioid‐based analgesic regimens for postoperative gastrointestinal paralysis, PONV and pain after abdominal surgery | Review | Henrik Jørgensen, Jørn Wetterslev, Steen Møiniche, Jørgen B Dahl | |
Differences between protocol and review
This is an update. We made the following modifications to the previous version.
Study selection, types of participants: We also included laparoscopic abdominal surgery.
Outcomes:
We limited the total number to seven.
We deleted the following.
Paracetamol absorption test as a measure of gastric emptying.
Passage of barium sulphate through the large intestine.
Nausea.
Surgical complications.
We added the following.
Gastrointestinal anastomotic leak.
Length of stay in hospital.
Cost.
Data collection and analysis
Quality of study: We assessed study quality with the new Cochrane tool as presenting low risk, unclear risk or high risk of bias for randomization, allocation concealment, blinding of participants and personnel, blinding of outcome assessors, incomplete outcome data, selective reporting and other bias.
We presented results for dichotomous outcomes as risk ratios. We provided continuous data measured on different scales or entered as P values as standardized mean differences. When this happened, we provided clinical equivalence. We assessed small‐study effects with Eger's regression intercept and publication bias with Duval and Tweedie's trim and fill analysis. We calculated the number needed for an additional beneficial or harmful outcome when appropriate. We calculated optimal information size when appropriate. We added meta‐regressions for exploration of heterogeneity. We assessed the quality of the body of evidence according to GRADE (Grades of Recommendation, Assessment, Development and Evaluation Working Group) recommendations. We added a 'Summary of findings' table.
Notes
August 2015
To include maximal data with no assumption, we entered data expressed as median and range via another software, using the exact P value and the number of participants included in each group (a function not provided by RevMan). We then transferred data to RevMan as standardized mean difference (SMD) and standard error (SE). For this reason, results provided in the text (exact calculations from www.Meta‐Analysis.com) may sometimes differ by a few decimal places from those noted in the Figures (automatically recalculated in RevMan from SMD and SE entered). Conclusions (effects found or not found) were never affected by these small differences.
Keywords
MeSH
Medical Subject Headings (MeSH) Keywords
- *Anesthesia, Epidural;
- Abdomen [*surgery];
- Analgesics, Opioid [*therapeutic use];
- Anesthetics, Local [*therapeutic use];
- Flatulence;
- Gastrointestinal Diseases [drug therapy, etiology];
- Gastrointestinal Transit [drug effects];
- Pain, Postoperative [drug therapy];
- Paralysis [drug therapy, etiology];
- Postoperative Complications [*drug therapy];
- Postoperative Nausea and Vomiting [drug therapy];
- Randomized Controlled Trials as Topic;
Medical Subject Headings Check Words
Humans;
PICO

Flow diagram. Study selection from the 2014 search. We reran the search in February 2016, and added 16 potential new studies of interest to the list of ‘Studies awaiting classification'. These studies will be incorporated into the formal review findings during the next review update. We also found one ongoing trial.
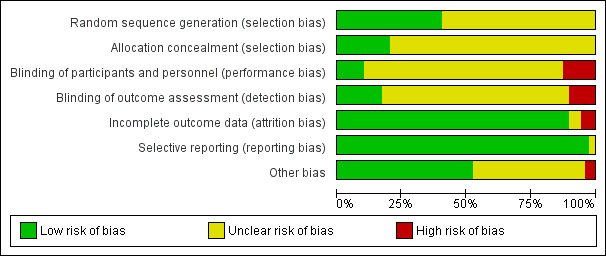
Risk of bias graph: review authors' judgements about each risk of bias item presented as percentages across all included studies.

Risk of bias summary: review authors' judgements about each risk of bias item for each included study.

Meta‐regression of effects of the concentration of local anaesthetic used (mg/mL) after surgery on the standardized mean difference for return of gastrointestinal transit as measured by the time required to obtain first flatus. P value = 0.0008.

Meta‐regression of the effects of mean age of participants included in the study on VAS scores at rest at 48 hours (P value = 0.0002). Older participants benefit more from an epidural containing a local anaesthetic for an abdominal surgery.

Meta‐regression of the effects of mean age of participants included in the study on VAS scores on movement at 48 hours (P value = 0.002). Older participants benefit more from an epidural containing a local anaesthetic for an abdominal surgery.

Comparison 1 Epidural with a local anaesthetic with or without opioids compared with opioid‐based regimen, Outcome 1 Time to first flatus subgrouped by type of surgery.

Comparison 1 Epidural with a local anaesthetic with or without opioids compared with opioid‐based regimen, Outcome 2 Time to first faeces subgrouped according to duration of local anaesthetic administration.

Comparison 1 Epidural with a local anaesthetic with or without opioids compared with opioid‐based regimen, Outcome 3 Pain scores at rest at 6 to 8 hours after surgery subgrouped by type of surgery.

Comparison 1 Epidural with a local anaesthetic with or without opioids compared with opioid‐based regimen, Outcome 4 Pain scores on movement at 6 to 8 hours after surgery subgrouped by type of opioid in the control group.
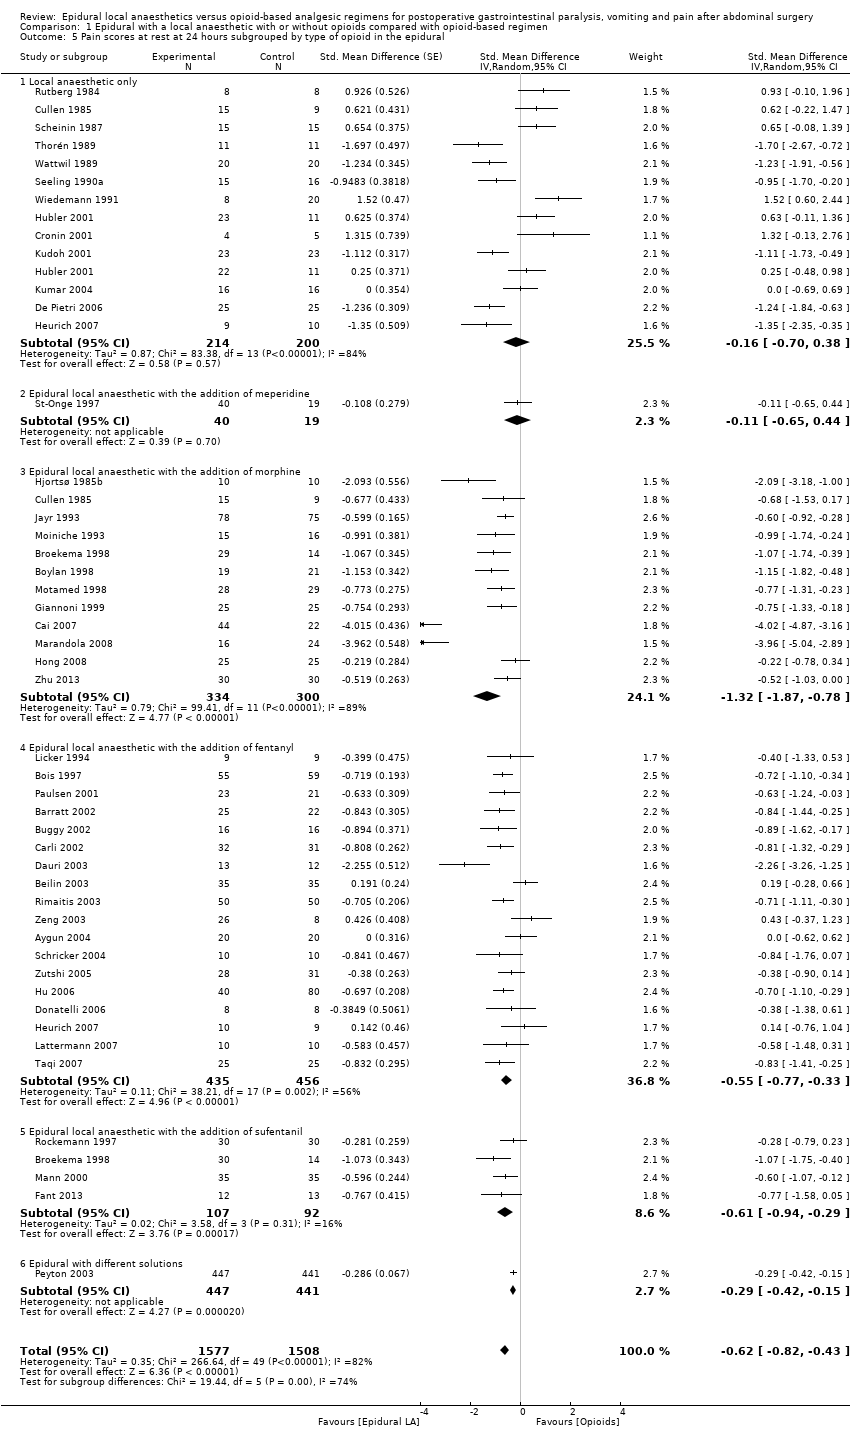
Comparison 1 Epidural with a local anaesthetic with or without opioids compared with opioid‐based regimen, Outcome 5 Pain scores at rest at 24 hours subgrouped by type of opioid in the epidural.
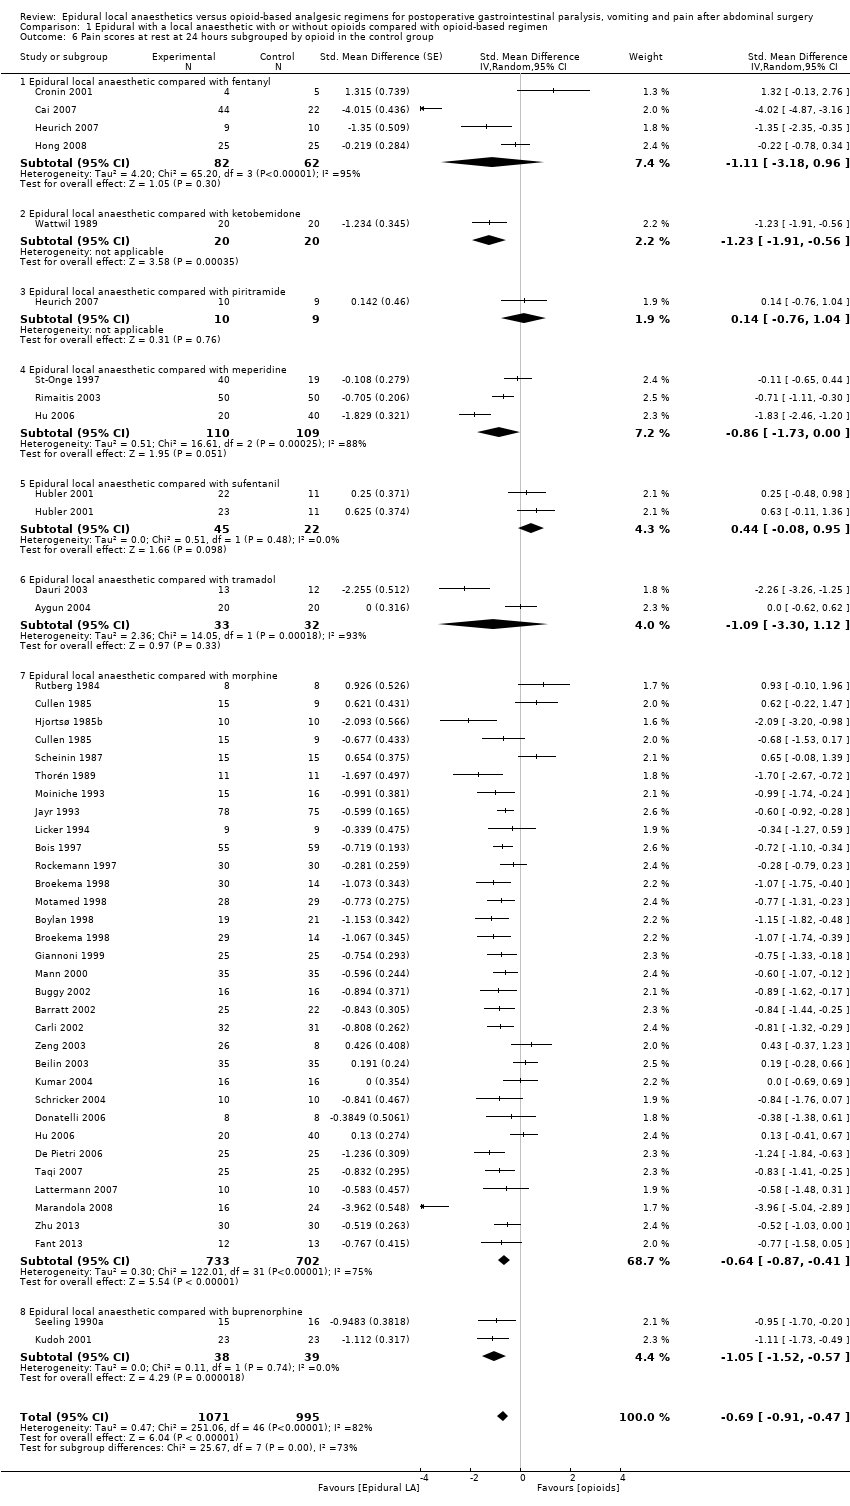
Comparison 1 Epidural with a local anaesthetic with or without opioids compared with opioid‐based regimen, Outcome 6 Pain scores at rest at 24 hours subgrouped by opioid in the control group.
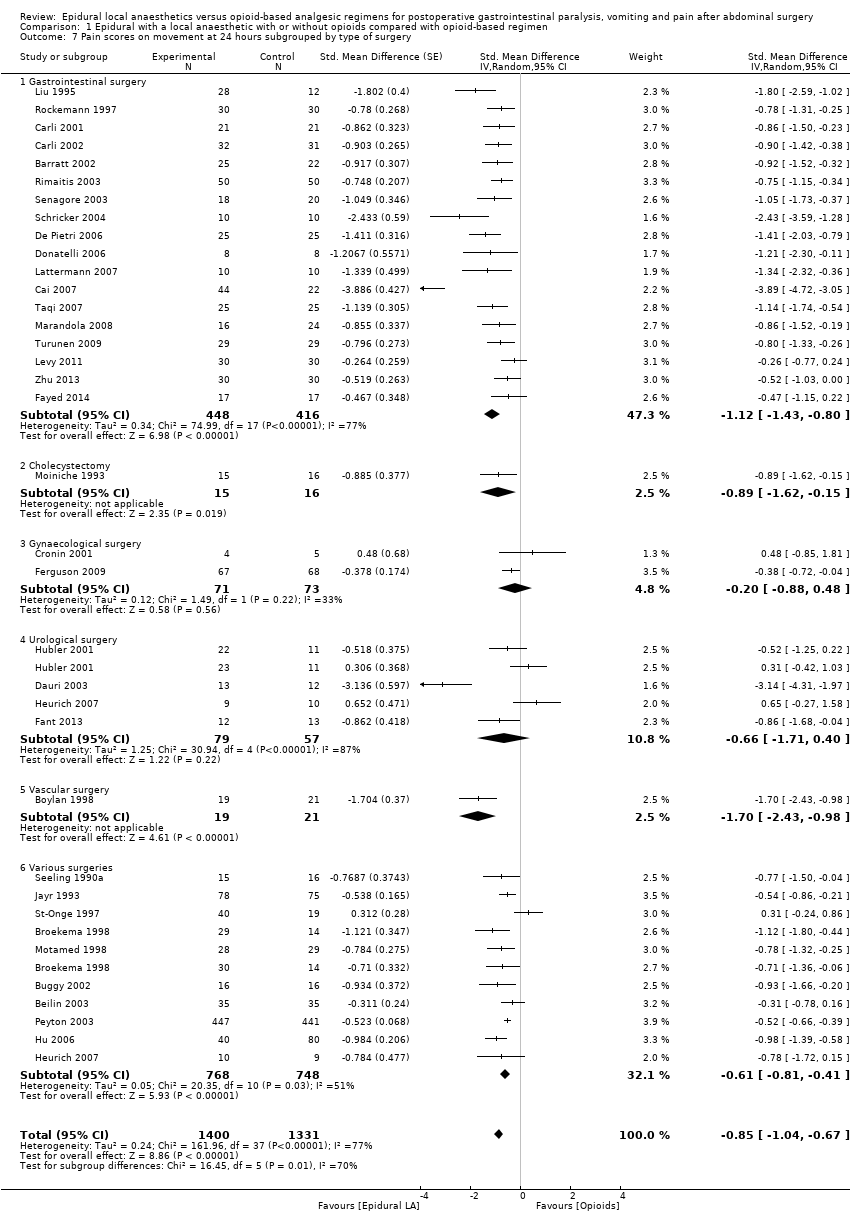
Comparison 1 Epidural with a local anaesthetic with or without opioids compared with opioid‐based regimen, Outcome 7 Pain scores on movement at 24 hours subgrouped by type of surgery.

Comparison 1 Epidural with a local anaesthetic with or without opioids compared with opioid‐based regimen, Outcome 8 Pain scores on movement at 24 hours subgrouped by type of opioid in the epidural.

Comparison 1 Epidural with a local anaesthetic with or without opioids compared with opioid‐based regimen, Outcome 9 Pain scores on movement at 24 hours subgrouped by type of opioids in the control group.

Comparison 1 Epidural with a local anaesthetic with or without opioids compared with opioid‐based regimen, Outcome 10 Pain scores at rest at 48 hours subgrouped by type of solution used.

Comparison 1 Epidural with a local anaesthetic with or without opioids compared with opioid‐based regimen, Outcome 11 Pain scores on movement at 48 hours subgrouped by type of solution in the epidural.
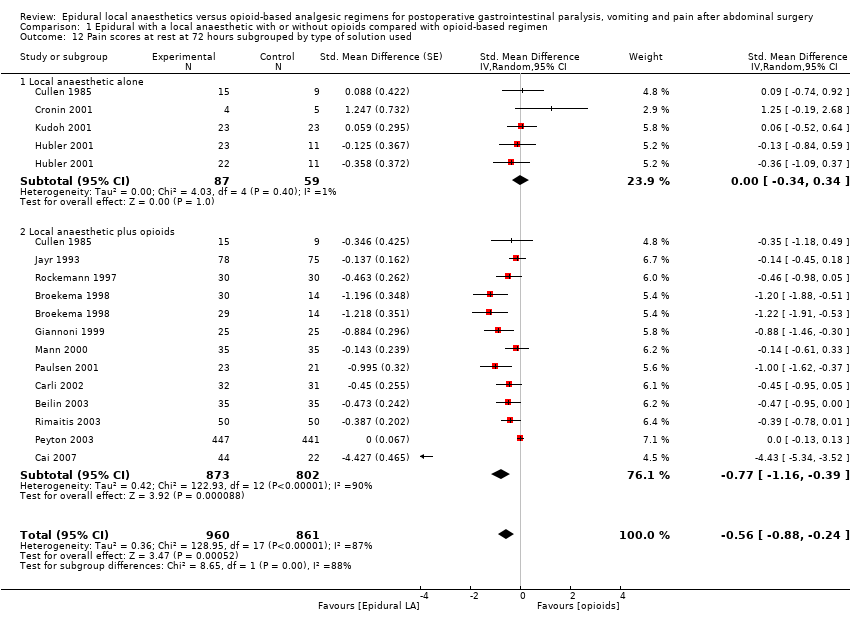
Comparison 1 Epidural with a local anaesthetic with or without opioids compared with opioid‐based regimen, Outcome 12 Pain scores at rest at 72 hours subgrouped by type of solution used.

Comparison 1 Epidural with a local anaesthetic with or without opioids compared with opioid‐based regimen, Outcome 13 Pain scores on movement at 72 hours subgrouped by type of solution used.

Comparison 1 Epidural with a local anaesthetic with or without opioids compared with opioid‐based regimen, Outcome 14 Vomiting.

Comparison 1 Epidural with a local anaesthetic with or without opioids compared with opioid‐based regimen, Outcome 15 Gastrointestinal tract anastomotic leak.
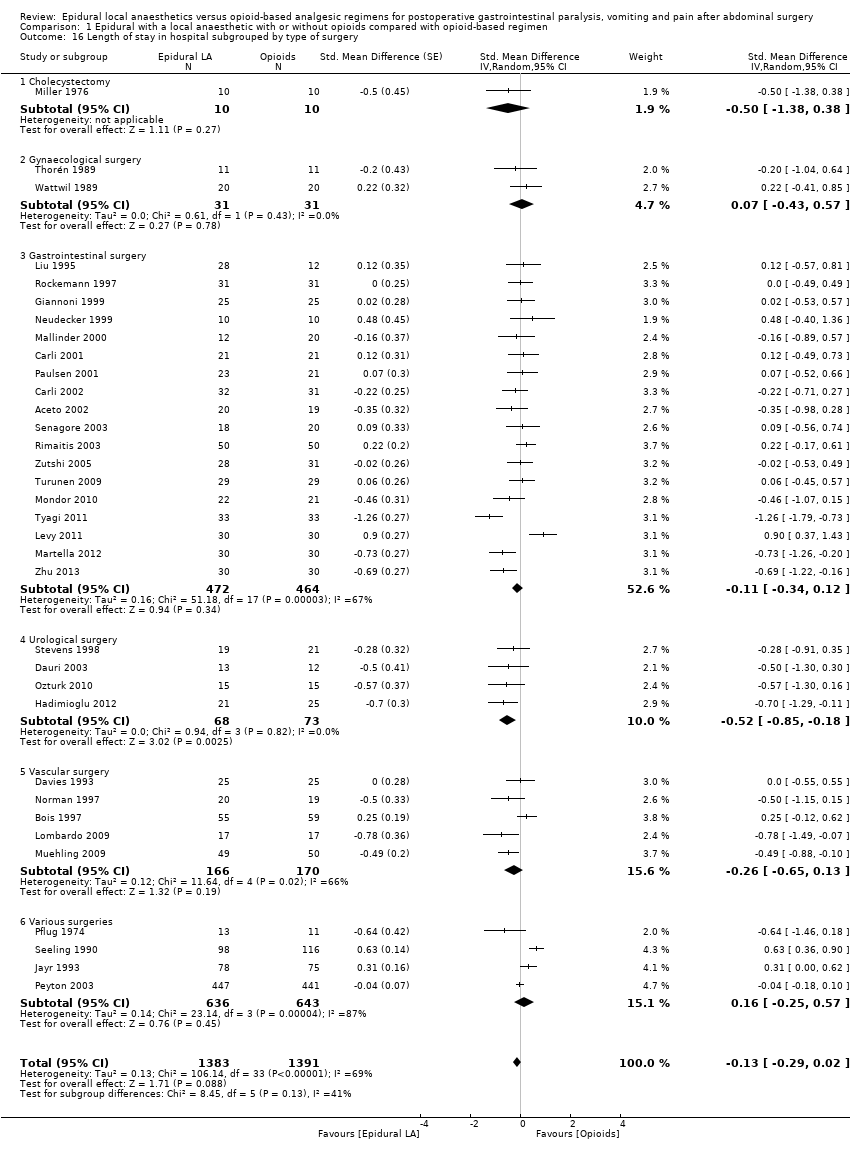
Comparison 1 Epidural with a local anaesthetic with or without opioids compared with opioid‐based regimen, Outcome 16 Length of stay in hospital subgrouped by type of surgery.

Comparison 1 Epidural with a local anaesthetic with or without opioids compared with opioid‐based regimen, Outcome 17 Length of stay in hospital subgrouped by surgical site for open surgery only.
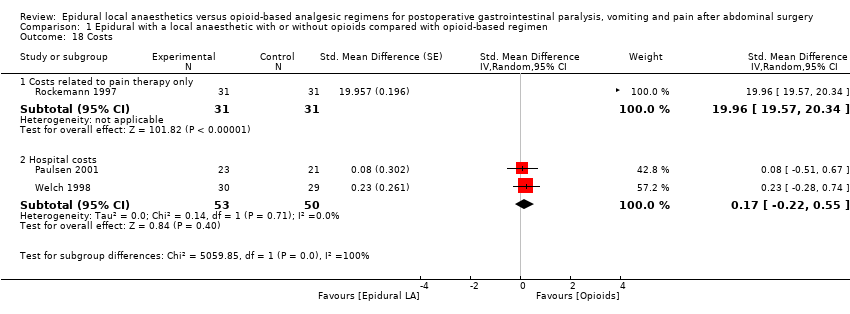
Comparison 1 Epidural with a local anaesthetic with or without opioids compared with opioid‐based regimen, Outcome 18 Costs.
| Epidural local anaesthetic compared with opioid‐based regimen for adults | ||||||
| Patient or population: adults | ||||||
| Outcomes | Illustrative comparative risks* (95% CI) | Relative effect | Number of participants | Quality of the evidence | Comments | |
| Assumed risk | Corresponding risk | |||||
| Opioid‐based regimen | Epidural local anaesthetic | |||||
| Time required to observe first flatus | Mean time required to observe first flatus in the intervention groups was | 1138 | ⊕⊕⊕⊕ | Effect size was proportionate to the | ||
| Time required to observe first faeces | Mean time required to observe first faeces in the intervention groups was | 1559 | ⊕⊕⊝⊝ | Pooled reduction is | ||
| VAS scores on movement at 24 hours | Mean VAS scores on movement at 24 hours in the intervention groups was | 2731 | ⊕⊕⊕⊝ | Pooled reduction | ||
| Vomiting during first 24 hours | Study population | RR 0.84 | 1154 | ⊕⊕⊝⊝ | ||
| 170 per 1000 | 143 per 1000 | |||||
| Low | ||||||
| 50 per 1000 | 42 per 1000 | |||||
| High | ||||||
| 250 per 1000 | 210 per 1000 | |||||
| Anastomotic leak | Study population | RR 0.74 | 848 | ⊕⊕⊝⊝ | ||
| 53 per 1000 | 39 per 1000 | |||||
| Low | ||||||
| 30 per 1000 | 22 per 1000 | |||||
| High | ||||||
| 100 per 1000 | 74 per 1000 | |||||
| Length of hospital stay | Mean length of hospital stay in the intervention groups was | 2598 | ⊕⊝⊝⊝ | Pooled reduction is | ||
| The corresponding risk (and its 95% confidence interval) is based on the assumed risk in the comparison group and the relative effect of the intervention (and its 95% CI) | ||||||
| GRADE Working Group grades of evidence | ||||||
| aAllocation concealment and/or blinding of outcome assessors rated as unclear or high risk for 75% or more of included studies for this outcome | ||||||
| Outcome or subgroup title | No. of studies | No. of participants | Statistical method | Effect size |
| 1 Time to first flatus subgrouped by type of surgery Show forest plot | 22 | 1138 | Std. Mean Difference (Random, 95% CI) | ‐1.28 [‐1.71, ‐0.86] |
| 1.1 Gynaecology | 3 | 122 | Std. Mean Difference (Random, 95% CI) | ‐1.24 [‐1.86, ‐0.62] |
| 1.2 Cholecystectomy | 1 | 27 | Std. Mean Difference (Random, 95% CI) | ‐0.15 [‐0.91, 0.61] |
| 1.3 Gastrointestinal surgery | 14 | 690 | Std. Mean Difference (Random, 95% CI) | ‐1.34 [‐1.82, ‐0.86] |
| 1.4 Urology | 1 | 40 | Std. Mean Difference (Random, 95% CI) | ‐0.83 [‐1.48, ‐0.17] |
| 1.5 Vascular surgery | 1 | 34 | Std. Mean Difference (Random, 95% CI) | ‐12.86 [‐15.98, ‐9.73] |
| 1.6 Various | 2 | 225 | Std. Mean Difference (Random, 95% CI) | ‐0.03 [‐0.29, 0.23] |
| 2 Time to first faeces subgrouped according to duration of local anaesthetic administration Show forest plot | 28 | 1559 | Std. Mean Difference (Random, 95% CI) | ‐0.67 [‐0.86, ‐0.47] |
| 2.1 Epidural local anaesthetic administered during surgery only | 1 | 30 | Std. Mean Difference (Random, 95% CI) | 0.03 [‐0.68, 0.75] |
| 2.2 Epidural local anaesthetic administered postoperatively for < 48 hours | 8 | 363 | Std. Mean Difference (Random, 95% CI) | ‐0.57 [‐1.06, ‐0.07] |
| 2.3 Epidural local anaesthetic administered for ≥ 48 hours after surgery | 19 | 1166 | Std. Mean Difference (Random, 95% CI) | ‐0.73 [‐0.93, ‐0.53] |
| 3 Pain scores at rest at 6 to 8 hours after surgery subgrouped by type of surgery Show forest plot | 20 | 947 | Std. Mean Difference (Random, 95% CI) | ‐0.84 [‐1.08, ‐0.61] |
| 3.1 Cholecystectomy | 1 | 16 | Std. Mean Difference (Random, 95% CI) | 0.33 [‐0.65, 1.32] |
| 3.2 Gastrointestinal surgery | 8 | 387 | Std. Mean Difference (Random, 95% CI) | ‐0.74 [‐1.06, ‐0.42] |
| 3.3 Gynaecology | 2 | 68 | Std. Mean Difference (Random, 95% CI) | ‐0.76 [‐1.70, 0.18] |
| 3.4 Urology | 4 | 136 | Std. Mean Difference (Random, 95% CI) | ‐1.16 [‐1.66, ‐0.67] |
| 3.5 Vascular surgery | 2 | 154 | Std. Mean Difference (Random, 95% CI) | ‐0.63 [‐1.00, ‐0.26] |
| 3.6 Various | 4 | 186 | Std. Mean Difference (Random, 95% CI) | ‐1.24 [‐2.18, ‐0.29] |
| 4 Pain scores on movement at 6 to 8 hours after surgery subgrouped by type of opioid in the control group Show forest plot | 13 | 617 | Std. Mean Difference (Random, 95% CI) | ‐1.05 [‐1.52, ‐0.58] |
| 4.1 Epidural LA compared with IV or epidural fentanyl | 3 | 119 | Std. Mean Difference (Random, 95% CI) | ‐1.15 [‐3.91, 1.61] |
| 4.2 Epidural LA compared with IT (De Pietri 2006) or IV (all others) morphine | 8 | 387 | Std. Mean Difference (Random, 95% CI) | ‐0.93 [‐1.28, ‐0.59] |
| 4.3 Epidural LA with opioids compared with IV piritramide | 1 | 19 | Std. Mean Difference (Random, 95% CI) | ‐0.62 [‐1.54, 0.30] |
| 4.4 Epidural LA alone compared with epidural sufentanil | 1 | 67 | Std. Mean Difference (Random, 95% CI) | ‐0.95 [‐1.78, ‐0.12] |
| 4.5 Epidural LA with opioids compared with IV tramadol | 1 | 25 | Std. Mean Difference (Random, 95% CI) | ‐2.19 [‐3.18, ‐1.20] |
| 5 Pain scores at rest at 24 hours subgrouped by type of opioid in the epidural Show forest plot | 46 | 3085 | Std. Mean Difference (Random, 95% CI) | ‐0.62 [‐0.82, ‐0.43] |
| 5.1 Local anaesthetic only | 13 | 414 | Std. Mean Difference (Random, 95% CI) | ‐0.16 [‐0.70, 0.38] |
| 5.2 Epidural local anaesthetic with the addition of meperidine | 1 | 59 | Std. Mean Difference (Random, 95% CI) | ‐0.11 [‐0.65, 0.44] |
| 5.3 Epidural local anaesthetic with the addition of morphine | 12 | 634 | Std. Mean Difference (Random, 95% CI) | ‐1.32 [‐1.87, ‐0.78] |
| 5.4 Epidural local anaesthetic with the addition of fentanyl | 18 | 891 | Std. Mean Difference (Random, 95% CI) | ‐0.55 [‐0.77, ‐0.33] |
| 5.5 Epidural local anaesthetic with the addition of sufentanil | 4 | 199 | Std. Mean Difference (Random, 95% CI) | ‐0.61 [‐0.94, ‐0.29] |
| 5.6 Epidural with different solutions | 1 | 888 | Std. Mean Difference (Random, 95% CI) | ‐0.29 [‐0.42, ‐0.15] |
| 6 Pain scores at rest at 24 hours subgrouped by opioid in the control group Show forest plot | 42 | 2066 | Std. Mean Difference (Random, 95% CI) | ‐0.69 [‐0.91, ‐0.47] |
| 6.1 Epidural local anaesthetic compared with fentanyl | 4 | 144 | Std. Mean Difference (Random, 95% CI) | ‐1.11 [‐3.18, 0.96] |
| 6.2 Epidural local anaesthetic compared with ketobemidone | 1 | 40 | Std. Mean Difference (Random, 95% CI) | ‐1.23 [‐1.91, ‐0.56] |
| 6.3 Epidural local anaesthetic compared with piritramide | 1 | 19 | Std. Mean Difference (Random, 95% CI) | 0.14 [‐0.76, 1.04] |
| 6.4 Epidural local anaesthetic compared with meperidine | 3 | 219 | Std. Mean Difference (Random, 95% CI) | ‐0.86 [‐1.73, 0.00] |
| 6.5 Epidural local anaesthetic compared with sufentanil | 1 | 67 | Std. Mean Difference (Random, 95% CI) | 0.44 [‐0.08, 0.95] |
| 6.6 Epidural local anaesthetic compared with tramadol | 2 | 65 | Std. Mean Difference (Random, 95% CI) | ‐1.09 [‐3.30, 1.12] |
| 6.7 Epidural local anaesthetic compared with morphine | 30 | 1435 | Std. Mean Difference (Random, 95% CI) | ‐0.64 [‐0.87, ‐0.41] |
| 6.8 Epidural local anaesthetic compared with buprenorphine | 2 | 77 | Std. Mean Difference (Random, 95% CI) | ‐1.05 [‐1.52, ‐0.57] |
| 7 Pain scores on movement at 24 hours subgrouped by type of surgery Show forest plot | 35 | 2731 | Std. Mean Difference (Random, 95% CI) | ‐0.85 [‐1.04, ‐0.67] |
| 7.1 Gastrointestinal surgery | 18 | 864 | Std. Mean Difference (Random, 95% CI) | ‐1.12 [‐1.43, ‐0.80] |
| 7.2 Cholecystectomy | 1 | 31 | Std. Mean Difference (Random, 95% CI) | ‐0.89 [‐1.62, ‐0.15] |
| 7.3 Gynaecological surgery | 2 | 144 | Std. Mean Difference (Random, 95% CI) | ‐0.20 [‐0.88, 0.48] |
| 7.4 Urological surgery | 4 | 136 | Std. Mean Difference (Random, 95% CI) | ‐0.66 [‐1.71, 0.40] |
| 7.5 Vascular surgery | 1 | 40 | Std. Mean Difference (Random, 95% CI) | ‐1.70 [‐2.43, ‐0.98] |
| 7.6 Various surgeries | 10 | 1516 | Std. Mean Difference (Random, 95% CI) | ‐0.61 [‐0.81, ‐0.41] |
| 8 Pain scores on movement at 24 hours subgrouped by type of opioid in the epidural Show forest plot | 34 | 1843 | Std. Mean Difference (Random, 95% CI) | ‐0.88 [‐1.09, ‐0.66] |
| 8.1 Local anaesthetic alone | 6 | 234 | Std. Mean Difference (Random, 95% CI) | ‐0.38 [‐0.93, 0.17] |
| 8.2 Epidural meperidine | 1 | 59 | Std. Mean Difference (Random, 95% CI) | 0.31 [‐0.24, 0.86] |
| 8.3 Epidural fentanyl | 16 | 756 | Std. Mean Difference (Random, 95% CI) | ‐0.95 [‐1.20, ‐0.69] |
| 8.4 Epidural sufentanil | 3 | 129 | Std. Mean Difference (Random, 95% CI) | ‐0.77 [‐1.14, ‐0.41] |
| 8.5 Epidural morphine | 10 | 665 | Std. Mean Difference (Random, 95% CI) | ‐1.19 [‐1.69, ‐0.69] |
| 9 Pain scores on movement at 24 hours subgrouped by type of opioids in the control group Show forest plot | 33 | 1796 | Std. Mean Difference (Random, 95% CI) | ‐0.90 [‐1.15, ‐0.66] |
| 9.1 Compared with IV or epidural fentanyl | 4 | 128 | Std. Mean Difference (Random, 95% CI) | ‐0.83 [‐3.13, 1.47] |
| 9.2 Compared with sufentanil | 1 | 67 | Std. Mean Difference (Random, 95% CI) | ‐0.10 [‐0.91, 0.70] |
| 9.3 Compared with meperidine | 3 | 219 | Std. Mean Difference (Random, 95% CI) | ‐0.64 [‐1.57, 0.29] |
| 9.4 Compared with piritramide | 1 | 19 | Std. Mean Difference (Random, 95% CI) | ‐0.78 [‐1.72, 0.15] |
| 9.5 Compared with morphine | 23 | 1249 | Std. Mean Difference (Random, 95% CI) | ‐0.87 [‐1.05, ‐0.69] |
| 9.6 Compared with oxycodone | 1 | 58 | Std. Mean Difference (Random, 95% CI) | ‐0.80 [‐1.33, ‐0.26] |
| 9.7 Compared with tramadol | 1 | 25 | Std. Mean Difference (Random, 95% CI) | ‐3.14 [‐4.31, ‐1.97] |
| 9.8 Compared to buprenorphine | 1 | 31 | Std. Mean Difference (Random, 95% CI) | ‐0.77 [‐1.50, ‐0.04] |
| 10 Pain scores at rest at 48 hours subgrouped by type of solution used Show forest plot | 30 | 2466 | Std. Mean Difference (Random, 95% CI) | ‐0.47 [‐0.71, ‐0.24] |
| 10.1 Local anaesthetic alone | 7 | 256 | Std. Mean Difference (Random, 95% CI) | 0.38 [‐0.49, 1.25] |
| 10.2 Local anaesthetic with an opioid | 24 | 2210 | Std. Mean Difference (Random, 95% CI) | ‐0.66 [‐0.89, ‐0.43] |
| 11 Pain scores on movement at 48 hours subgrouped by type of solution in the epidural Show forest plot | 27 | 2398 | Std. Mean Difference (Random, 95% CI) | ‐0.85 [‐1.10, ‐0.60] |
| 11.1 Local anaesthetic alone | 4 | 184 | Std. Mean Difference (Random, 95% CI) | ‐0.56 [‐1.71, 0.58] |
| 11.2 Local anaesthetic with an opioid | 23 | 2214 | Std. Mean Difference (Random, 95% CI) | ‐0.88 [‐1.13, ‐0.63] |
| 12 Pain scores at rest at 72 hours subgrouped by type of solution used Show forest plot | 15 | 1821 | Std. Mean Difference (Random, 95% CI) | ‐0.56 [‐0.88, ‐0.24] |
| 12.1 Local anaesthetic alone | 4 | 146 | Std. Mean Difference (Random, 95% CI) | ‐0.00 [‐0.34, 0.34] |
| 12.2 Local anaesthetic plus opioids | 12 | 1675 | Std. Mean Difference (Random, 95% CI) | ‐0.77 [‐1.16, ‐0.39] |
| 13 Pain scores on movement at 72 hours subgrouped by type of solution used Show forest plot | 15 | 1873 | Std. Mean Difference (Random, 95% CI) | ‐0.69 [‐0.99, ‐0.39] |
| 13.1 Local anaesthetic alone | 3 | 135 | Std. Mean Difference (Random, 95% CI) | ‐0.03 [‐0.38, 0.32] |
| 13.2 Local anaesthetic with an opioid | 12 | 1738 | Std. Mean Difference (Random, 95% CI) | ‐0.87 [‐1.22, ‐0.51] |
| 14 Vomiting Show forest plot | 22 | 1154 | Risk Ratio (M‐H, Random, 95% CI) | 0.84 [0.57, 1.23] |
| 14.1 Gynaecological | 4 | 223 | Risk Ratio (M‐H, Random, 95% CI) | 0.29 [0.06, 1.29] |
| 14.2 Gastrointestinal | 12 | 512 | Risk Ratio (M‐H, Random, 95% CI) | 0.80 [0.48, 1.32] |
| 14.3 Various | 6 | 419 | Risk Ratio (M‐H, Random, 95% CI) | 1.02 [0.44, 2.35] |
| 15 Gastrointestinal tract anastomotic leak Show forest plot | 17 | 848 | Risk Ratio (M‐H, Fixed, 95% CI) | 0.74 [0.41, 1.32] |
| 16 Length of stay in hospital subgrouped by type of surgery Show forest plot | 34 | 2774 | Std. Mean Difference (Random, 95% CI) | ‐0.13 [‐0.29, 0.02] |
| 16.1 Cholecystectomy | 1 | 20 | Std. Mean Difference (Random, 95% CI) | ‐0.5 [‐1.38, 0.38] |
| 16.2 Gynaecological surgery | 2 | 62 | Std. Mean Difference (Random, 95% CI) | 0.07 [‐0.43, 0.57] |
| 16.3 Gastrointestinal surgery | 18 | 936 | Std. Mean Difference (Random, 95% CI) | ‐0.11 [‐0.34, 0.12] |
| 16.4 Urological surgery | 4 | 141 | Std. Mean Difference (Random, 95% CI) | ‐0.52 [‐0.85, ‐0.18] |
| 16.5 Vascular surgery | 5 | 336 | Std. Mean Difference (Random, 95% CI) | ‐0.26 [‐0.65, 0.13] |
| 16.6 Various surgeries | 4 | 1279 | Std. Mean Difference (Random, 95% CI) | 0.16 [‐0.25, 0.57] |
| 17 Length of stay in hospital subgrouped by surgical site for open surgery only Show forest plot | 30 | 2598 | Std. Mean Difference (Random, 95% CI) | ‐0.20 [‐0.35, ‐0.04] |
| 17.1 Open vascular surgery | 5 | 336 | Std. Mean Difference (Random, 95% CI) | ‐0.26 [‐0.65, 0.13] |
| 17.2 Open urological surgery | 4 | 141 | Std. Mean Difference (Random, 95% CI) | ‐0.51 [‐0.85, ‐0.18] |
| 17.3 Open cholecystectomy | 1 | 20 | Std. Mean Difference (Random, 95% CI) | ‐0.50 [‐1.39, 0.39] |
| 17.4 Open gynaecological surgery | 2 | 62 | Std. Mean Difference (Random, 95% CI) | 0.07 [‐0.43, 0.57] |
| 17.5 Open gastrointestinal surgery | 14 | 760 | Std. Mean Difference (Random, 95% CI) | ‐0.24 [‐0.47, ‐0.01] |
| 17.6 Open various surgeries | 4 | 1279 | Std. Mean Difference (Random, 95% CI) | 0.15 [‐0.26, 0.57] |
| 18 Costs Show forest plot | 3 | Std. Mean Difference (Random, 95% CI) | Subtotals only | |
| 18.1 Costs related to pain therapy only | 1 | 62 | Std. Mean Difference (Random, 95% CI) | 19.96 [19.57, 20.34] |
| 18.2 Hospital costs | 2 | 103 | Std. Mean Difference (Random, 95% CI) | 0.17 [‐0.22, 0.55] |