| 1 Time to first flatus subgrouped by type of surgery Show forest plot | 22 | 1138 | Std. Mean Difference (Random, 95% CI) | ‐1.28 [‐1.71, ‐0.86] |
|
| 1.1 Gynaecology | 3 | 122 | Std. Mean Difference (Random, 95% CI) | ‐1.24 [‐1.86, ‐0.62] |
| 1.2 Cholecystectomy | 1 | 27 | Std. Mean Difference (Random, 95% CI) | ‐0.15 [‐0.91, 0.61] |
| 1.3 Gastrointestinal surgery | 14 | 690 | Std. Mean Difference (Random, 95% CI) | ‐1.34 [‐1.82, ‐0.86] |
| 1.4 Urology | 1 | 40 | Std. Mean Difference (Random, 95% CI) | ‐0.83 [‐1.48, ‐0.17] |
| 1.5 Vascular surgery | 1 | 34 | Std. Mean Difference (Random, 95% CI) | ‐12.86 [‐15.98, ‐9.73] |
| 1.6 Various | 2 | 225 | Std. Mean Difference (Random, 95% CI) | ‐0.03 [‐0.29, 0.23] |
| 2 Time to first faeces subgrouped according to duration of local anaesthetic administration Show forest plot | 28 | 1559 | Std. Mean Difference (Random, 95% CI) | ‐0.67 [‐0.86, ‐0.47] |
|
| 2.1 Epidural local anaesthetic administered during surgery only | 1 | 30 | Std. Mean Difference (Random, 95% CI) | 0.03 [‐0.68, 0.75] |
| 2.2 Epidural local anaesthetic administered postoperatively for < 48 hours | 8 | 363 | Std. Mean Difference (Random, 95% CI) | ‐0.57 [‐1.06, ‐0.07] |
| 2.3 Epidural local anaesthetic administered for ≥ 48 hours after surgery | 19 | 1166 | Std. Mean Difference (Random, 95% CI) | ‐0.73 [‐0.93, ‐0.53] |
| 3 Pain scores at rest at 6 to 8 hours after surgery subgrouped by type of surgery Show forest plot | 20 | 947 | Std. Mean Difference (Random, 95% CI) | ‐0.84 [‐1.08, ‐0.61] |
|
| 3.1 Cholecystectomy | 1 | 16 | Std. Mean Difference (Random, 95% CI) | 0.33 [‐0.65, 1.32] |
| 3.2 Gastrointestinal surgery | 8 | 387 | Std. Mean Difference (Random, 95% CI) | ‐0.74 [‐1.06, ‐0.42] |
| 3.3 Gynaecology | 2 | 68 | Std. Mean Difference (Random, 95% CI) | ‐0.76 [‐1.70, 0.18] |
| 3.4 Urology | 4 | 136 | Std. Mean Difference (Random, 95% CI) | ‐1.16 [‐1.66, ‐0.67] |
| 3.5 Vascular surgery | 2 | 154 | Std. Mean Difference (Random, 95% CI) | ‐0.63 [‐1.00, ‐0.26] |
| 3.6 Various | 4 | 186 | Std. Mean Difference (Random, 95% CI) | ‐1.24 [‐2.18, ‐0.29] |
| 4 Pain scores on movement at 6 to 8 hours after surgery subgrouped by type of opioid in the control group Show forest plot | 13 | 617 | Std. Mean Difference (Random, 95% CI) | ‐1.05 [‐1.52, ‐0.58] |
|
| 4.1 Epidural LA compared with IV or epidural fentanyl | 3 | 119 | Std. Mean Difference (Random, 95% CI) | ‐1.15 [‐3.91, 1.61] |
| 4.2 Epidural LA compared with IT (De Pietri 2006) or IV (all others) morphine | 8 | 387 | Std. Mean Difference (Random, 95% CI) | ‐0.93 [‐1.28, ‐0.59] |
| 4.3 Epidural LA with opioids compared with IV piritramide | 1 | 19 | Std. Mean Difference (Random, 95% CI) | ‐0.62 [‐1.54, 0.30] |
| 4.4 Epidural LA alone compared with epidural sufentanil | 1 | 67 | Std. Mean Difference (Random, 95% CI) | ‐0.95 [‐1.78, ‐0.12] |
| 4.5 Epidural LA with opioids compared with IV tramadol | 1 | 25 | Std. Mean Difference (Random, 95% CI) | ‐2.19 [‐3.18, ‐1.20] |
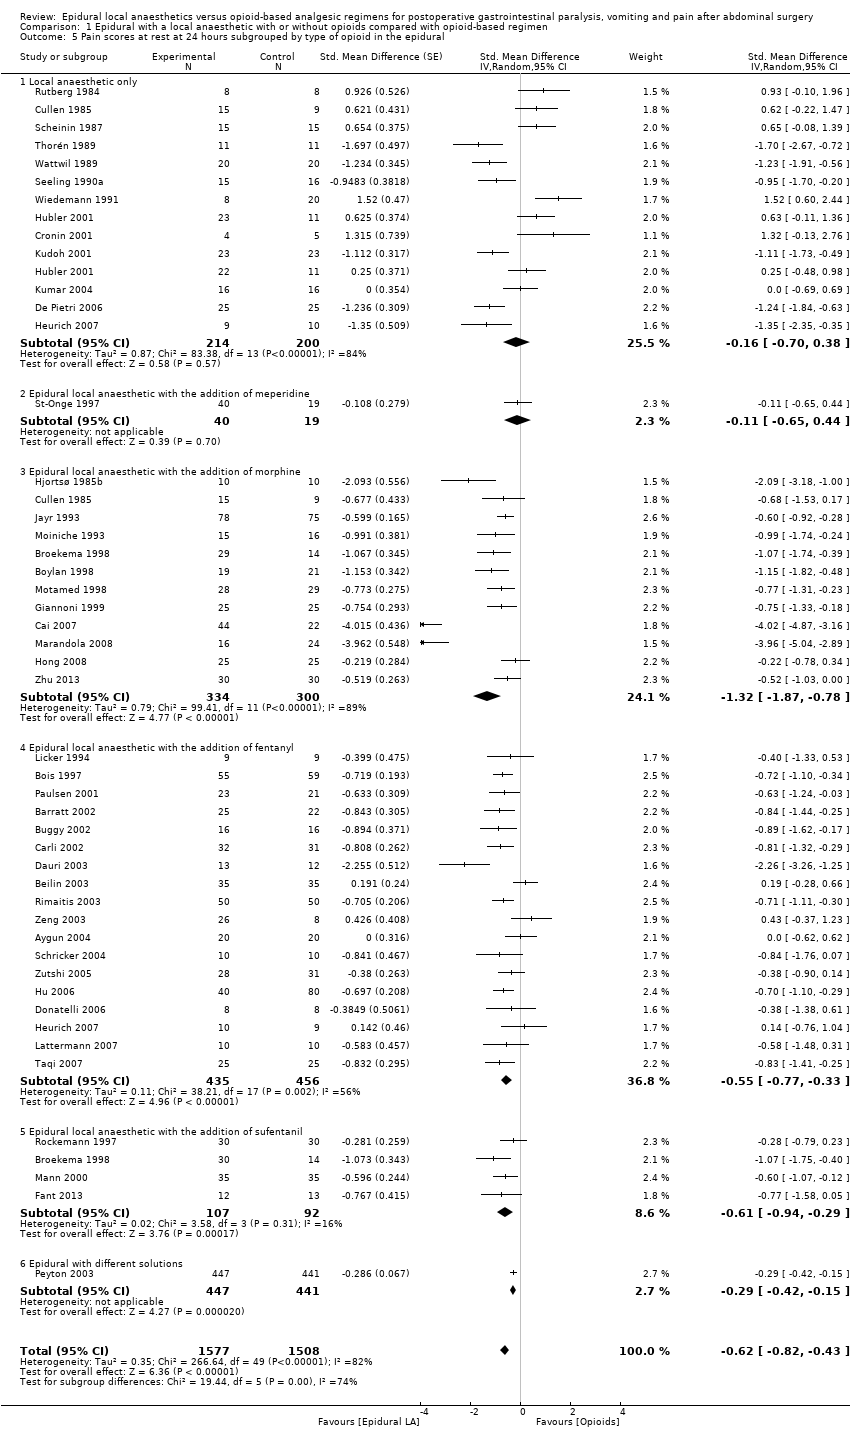
| 5 Pain scores at rest at 24 hours subgrouped by type of opioid in the epidural Show forest plot | 46 | 3085 | Std. Mean Difference (Random, 95% CI) | ‐0.62 [‐0.82, ‐0.43] |
|
| 5.1 Local anaesthetic only | 13 | 414 | Std. Mean Difference (Random, 95% CI) | ‐0.16 [‐0.70, 0.38] |
| 5.2 Epidural local anaesthetic with the addition of meperidine | 1 | 59 | Std. Mean Difference (Random, 95% CI) | ‐0.11 [‐0.65, 0.44] |
| 5.3 Epidural local anaesthetic with the addition of morphine | 12 | 634 | Std. Mean Difference (Random, 95% CI) | ‐1.32 [‐1.87, ‐0.78] |
| 5.4 Epidural local anaesthetic with the addition of fentanyl | 18 | 891 | Std. Mean Difference (Random, 95% CI) | ‐0.55 [‐0.77, ‐0.33] |
| 5.5 Epidural local anaesthetic with the addition of sufentanil | 4 | 199 | Std. Mean Difference (Random, 95% CI) | ‐0.61 [‐0.94, ‐0.29] |
| 5.6 Epidural with different solutions | 1 | 888 | Std. Mean Difference (Random, 95% CI) | ‐0.29 [‐0.42, ‐0.15] |
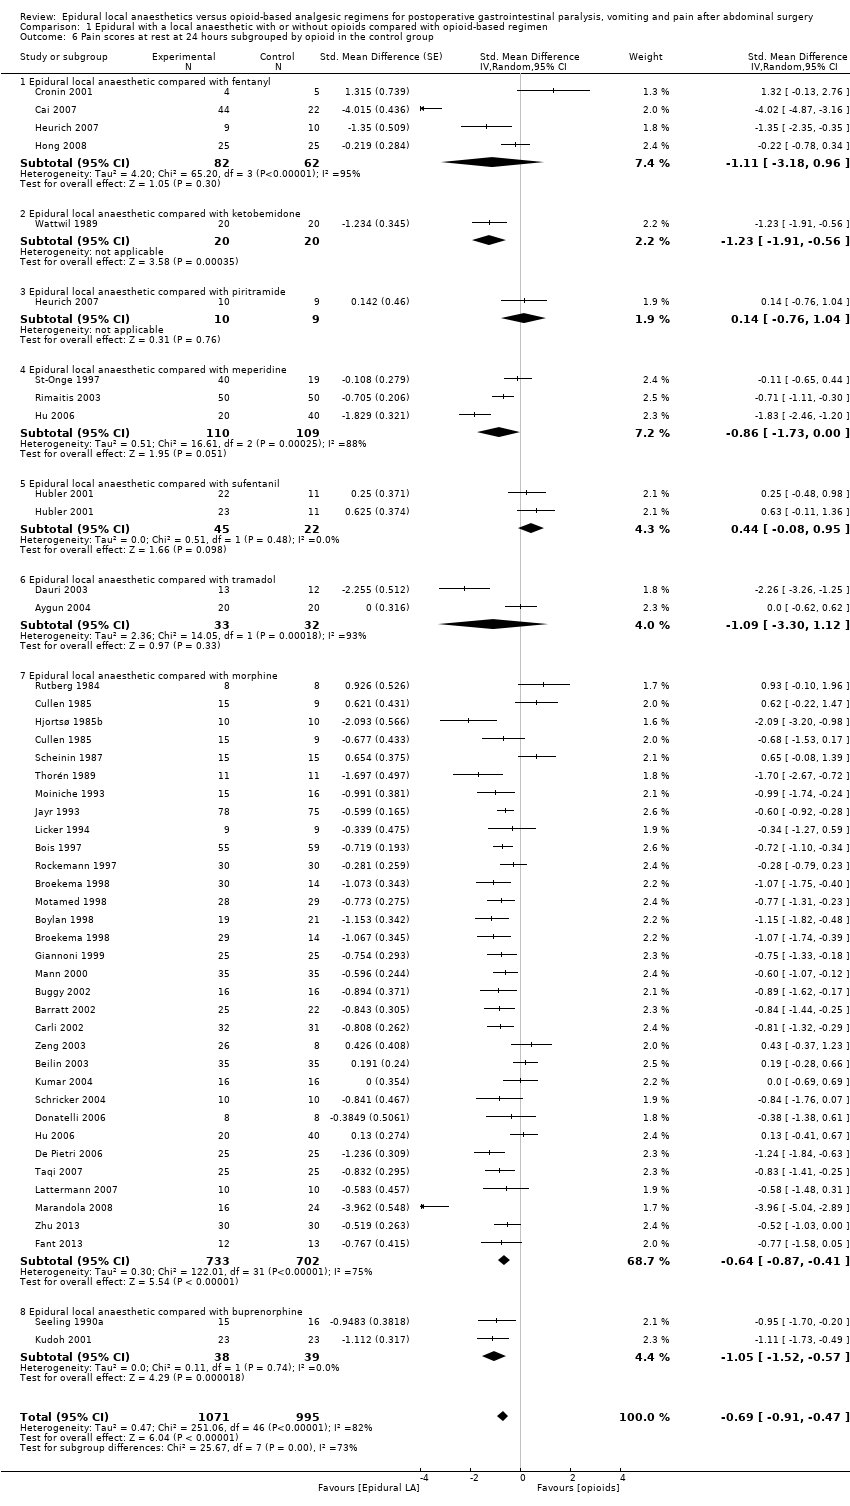
| 6 Pain scores at rest at 24 hours subgrouped by opioid in the control group Show forest plot | 42 | 2066 | Std. Mean Difference (Random, 95% CI) | ‐0.69 [‐0.91, ‐0.47] |
|
| 6.1 Epidural local anaesthetic compared with fentanyl | 4 | 144 | Std. Mean Difference (Random, 95% CI) | ‐1.11 [‐3.18, 0.96] |
| 6.2 Epidural local anaesthetic compared with ketobemidone | 1 | 40 | Std. Mean Difference (Random, 95% CI) | ‐1.23 [‐1.91, ‐0.56] |
| 6.3 Epidural local anaesthetic compared with piritramide | 1 | 19 | Std. Mean Difference (Random, 95% CI) | 0.14 [‐0.76, 1.04] |
| 6.4 Epidural local anaesthetic compared with meperidine | 3 | 219 | Std. Mean Difference (Random, 95% CI) | ‐0.86 [‐1.73, 0.00] |
| 6.5 Epidural local anaesthetic compared with sufentanil | 1 | 67 | Std. Mean Difference (Random, 95% CI) | 0.44 [‐0.08, 0.95] |
| 6.6 Epidural local anaesthetic compared with tramadol | 2 | 65 | Std. Mean Difference (Random, 95% CI) | ‐1.09 [‐3.30, 1.12] |
| 6.7 Epidural local anaesthetic compared with morphine | 30 | 1435 | Std. Mean Difference (Random, 95% CI) | ‐0.64 [‐0.87, ‐0.41] |
| 6.8 Epidural local anaesthetic compared with buprenorphine | 2 | 77 | Std. Mean Difference (Random, 95% CI) | ‐1.05 [‐1.52, ‐0.57] |
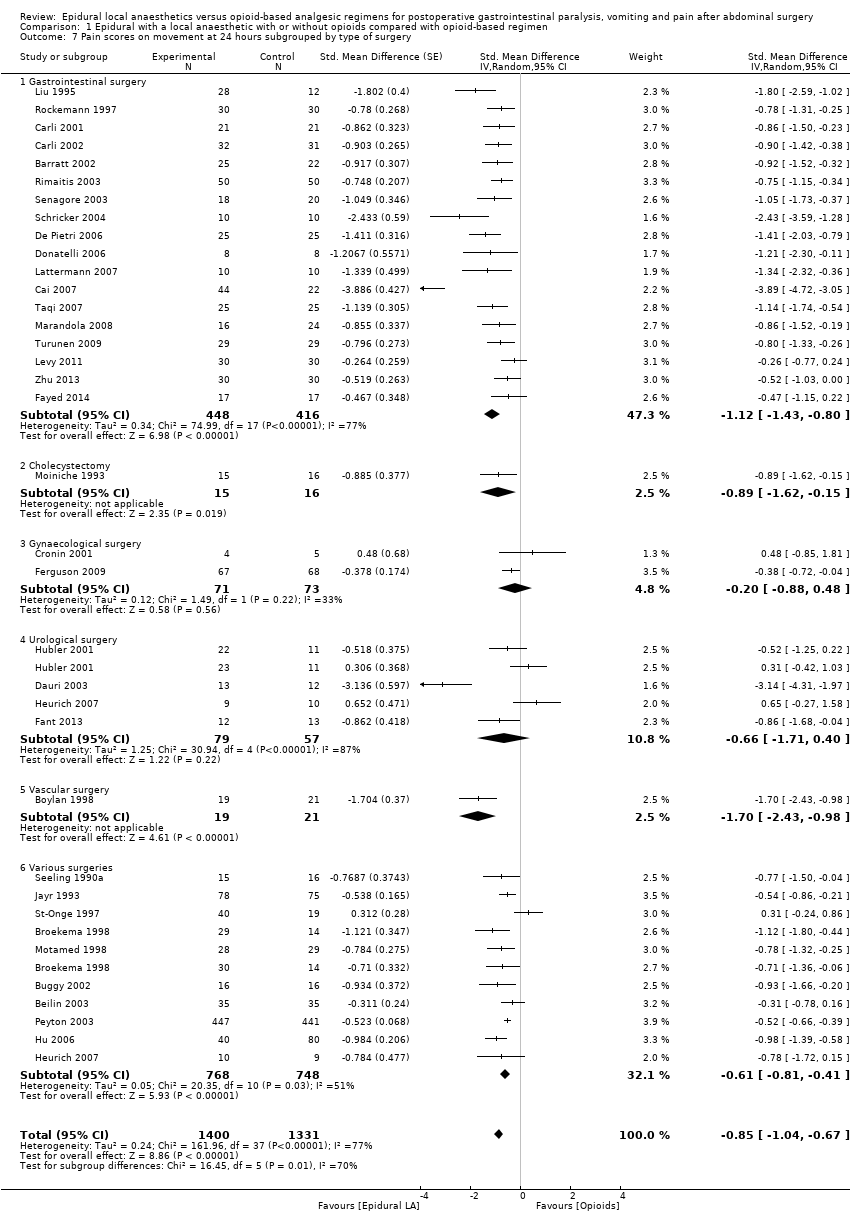
| 7 Pain scores on movement at 24 hours subgrouped by type of surgery Show forest plot | 35 | 2731 | Std. Mean Difference (Random, 95% CI) | ‐0.85 [‐1.04, ‐0.67] |
|
| 7.1 Gastrointestinal surgery | 18 | 864 | Std. Mean Difference (Random, 95% CI) | ‐1.12 [‐1.43, ‐0.80] |
| 7.2 Cholecystectomy | 1 | 31 | Std. Mean Difference (Random, 95% CI) | ‐0.89 [‐1.62, ‐0.15] |
| 7.3 Gynaecological surgery | 2 | 144 | Std. Mean Difference (Random, 95% CI) | ‐0.20 [‐0.88, 0.48] |
| 7.4 Urological surgery | 4 | 136 | Std. Mean Difference (Random, 95% CI) | ‐0.66 [‐1.71, 0.40] |
| 7.5 Vascular surgery | 1 | 40 | Std. Mean Difference (Random, 95% CI) | ‐1.70 [‐2.43, ‐0.98] |
| 7.6 Various surgeries | 10 | 1516 | Std. Mean Difference (Random, 95% CI) | ‐0.61 [‐0.81, ‐0.41] |
| 8 Pain scores on movement at 24 hours subgrouped by type of opioid in the epidural Show forest plot | 34 | 1843 | Std. Mean Difference (Random, 95% CI) | ‐0.88 [‐1.09, ‐0.66] |
|
| 8.1 Local anaesthetic alone | 6 | 234 | Std. Mean Difference (Random, 95% CI) | ‐0.38 [‐0.93, 0.17] |
| 8.2 Epidural meperidine | 1 | 59 | Std. Mean Difference (Random, 95% CI) | 0.31 [‐0.24, 0.86] |
| 8.3 Epidural fentanyl | 16 | 756 | Std. Mean Difference (Random, 95% CI) | ‐0.95 [‐1.20, ‐0.69] |
| 8.4 Epidural sufentanil | 3 | 129 | Std. Mean Difference (Random, 95% CI) | ‐0.77 [‐1.14, ‐0.41] |
| 8.5 Epidural morphine | 10 | 665 | Std. Mean Difference (Random, 95% CI) | ‐1.19 [‐1.69, ‐0.69] |
| 9 Pain scores on movement at 24 hours subgrouped by type of opioids in the control group Show forest plot | 33 | 1796 | Std. Mean Difference (Random, 95% CI) | ‐0.90 [‐1.15, ‐0.66] |
|
| 9.1 Compared with IV or epidural fentanyl | 4 | 128 | Std. Mean Difference (Random, 95% CI) | ‐0.83 [‐3.13, 1.47] |
| 9.2 Compared with sufentanil | 1 | 67 | Std. Mean Difference (Random, 95% CI) | ‐0.10 [‐0.91, 0.70] |
| 9.3 Compared with meperidine | 3 | 219 | Std. Mean Difference (Random, 95% CI) | ‐0.64 [‐1.57, 0.29] |
| 9.4 Compared with piritramide | 1 | 19 | Std. Mean Difference (Random, 95% CI) | ‐0.78 [‐1.72, 0.15] |
| 9.5 Compared with morphine | 23 | 1249 | Std. Mean Difference (Random, 95% CI) | ‐0.87 [‐1.05, ‐0.69] |
| 9.6 Compared with oxycodone | 1 | 58 | Std. Mean Difference (Random, 95% CI) | ‐0.80 [‐1.33, ‐0.26] |
| 9.7 Compared with tramadol | 1 | 25 | Std. Mean Difference (Random, 95% CI) | ‐3.14 [‐4.31, ‐1.97] |
| 9.8 Compared to buprenorphine | 1 | 31 | Std. Mean Difference (Random, 95% CI) | ‐0.77 [‐1.50, ‐0.04] |
| 10 Pain scores at rest at 48 hours subgrouped by type of solution used Show forest plot | 30 | 2466 | Std. Mean Difference (Random, 95% CI) | ‐0.47 [‐0.71, ‐0.24] |
|
| 10.1 Local anaesthetic alone | 7 | 256 | Std. Mean Difference (Random, 95% CI) | 0.38 [‐0.49, 1.25] |
| 10.2 Local anaesthetic with an opioid | 24 | 2210 | Std. Mean Difference (Random, 95% CI) | ‐0.66 [‐0.89, ‐0.43] |
| 11 Pain scores on movement at 48 hours subgrouped by type of solution in the epidural Show forest plot | 27 | 2398 | Std. Mean Difference (Random, 95% CI) | ‐0.85 [‐1.10, ‐0.60] |
|
| 11.1 Local anaesthetic alone | 4 | 184 | Std. Mean Difference (Random, 95% CI) | ‐0.56 [‐1.71, 0.58] |
| 11.2 Local anaesthetic with an opioid | 23 | 2214 | Std. Mean Difference (Random, 95% CI) | ‐0.88 [‐1.13, ‐0.63] |
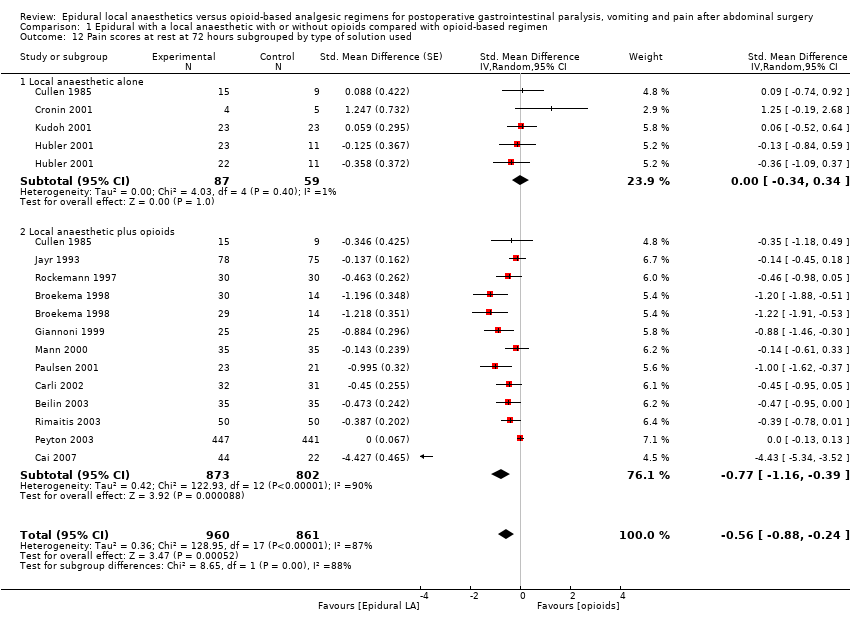
| 12 Pain scores at rest at 72 hours subgrouped by type of solution used Show forest plot | 15 | 1821 | Std. Mean Difference (Random, 95% CI) | ‐0.56 [‐0.88, ‐0.24] |
|
| 12.1 Local anaesthetic alone | 4 | 146 | Std. Mean Difference (Random, 95% CI) | ‐0.00 [‐0.34, 0.34] |
| 12.2 Local anaesthetic plus opioids | 12 | 1675 | Std. Mean Difference (Random, 95% CI) | ‐0.77 [‐1.16, ‐0.39] |
| 13 Pain scores on movement at 72 hours subgrouped by type of solution used Show forest plot | 15 | 1873 | Std. Mean Difference (Random, 95% CI) | ‐0.69 [‐0.99, ‐0.39] |
|
| 13.1 Local anaesthetic alone | 3 | 135 | Std. Mean Difference (Random, 95% CI) | ‐0.03 [‐0.38, 0.32] |
| 13.2 Local anaesthetic with an opioid | 12 | 1738 | Std. Mean Difference (Random, 95% CI) | ‐0.87 [‐1.22, ‐0.51] |
| 14 Vomiting Show forest plot | 22 | 1154 | Risk Ratio (M‐H, Random, 95% CI) | 0.84 [0.57, 1.23] |
|
| 14.1 Gynaecological | 4 | 223 | Risk Ratio (M‐H, Random, 95% CI) | 0.29 [0.06, 1.29] |
| 14.2 Gastrointestinal | 12 | 512 | Risk Ratio (M‐H, Random, 95% CI) | 0.80 [0.48, 1.32] |
| 14.3 Various | 6 | 419 | Risk Ratio (M‐H, Random, 95% CI) | 1.02 [0.44, 2.35] |
| 15 Gastrointestinal tract anastomotic leak Show forest plot | 17 | 848 | Risk Ratio (M‐H, Fixed, 95% CI) | 0.74 [0.41, 1.32] |
|
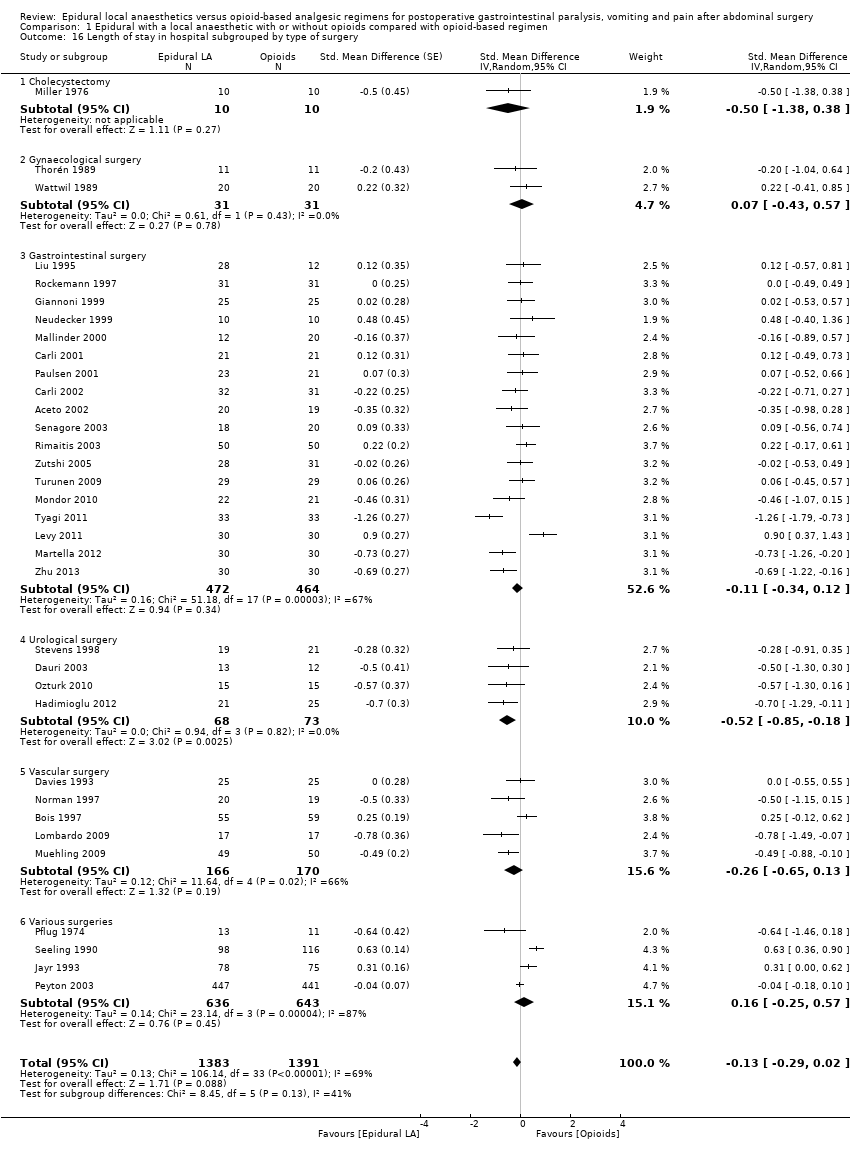
| 16 Length of stay in hospital subgrouped by type of surgery Show forest plot | 34 | 2774 | Std. Mean Difference (Random, 95% CI) | ‐0.13 [‐0.29, 0.02] |
|
| 16.1 Cholecystectomy | 1 | 20 | Std. Mean Difference (Random, 95% CI) | ‐0.5 [‐1.38, 0.38] |
| 16.2 Gynaecological surgery | 2 | 62 | Std. Mean Difference (Random, 95% CI) | 0.07 [‐0.43, 0.57] |
| 16.3 Gastrointestinal surgery | 18 | 936 | Std. Mean Difference (Random, 95% CI) | ‐0.11 [‐0.34, 0.12] |
| 16.4 Urological surgery | 4 | 141 | Std. Mean Difference (Random, 95% CI) | ‐0.52 [‐0.85, ‐0.18] |
| 16.5 Vascular surgery | 5 | 336 | Std. Mean Difference (Random, 95% CI) | ‐0.26 [‐0.65, 0.13] |
| 16.6 Various surgeries | 4 | 1279 | Std. Mean Difference (Random, 95% CI) | 0.16 [‐0.25, 0.57] |
| 17 Length of stay in hospital subgrouped by surgical site for open surgery only Show forest plot | 30 | 2598 | Std. Mean Difference (Random, 95% CI) | ‐0.20 [‐0.35, ‐0.04] |
|
| 17.1 Open vascular surgery | 5 | 336 | Std. Mean Difference (Random, 95% CI) | ‐0.26 [‐0.65, 0.13] |
| 17.2 Open urological surgery | 4 | 141 | Std. Mean Difference (Random, 95% CI) | ‐0.51 [‐0.85, ‐0.18] |
| 17.3 Open cholecystectomy | 1 | 20 | Std. Mean Difference (Random, 95% CI) | ‐0.50 [‐1.39, 0.39] |
| 17.4 Open gynaecological surgery | 2 | 62 | Std. Mean Difference (Random, 95% CI) | 0.07 [‐0.43, 0.57] |
| 17.5 Open gastrointestinal surgery | 14 | 760 | Std. Mean Difference (Random, 95% CI) | ‐0.24 [‐0.47, ‐0.01] |
| 17.6 Open various surgeries | 4 | 1279 | Std. Mean Difference (Random, 95% CI) | 0.15 [‐0.26, 0.57] |
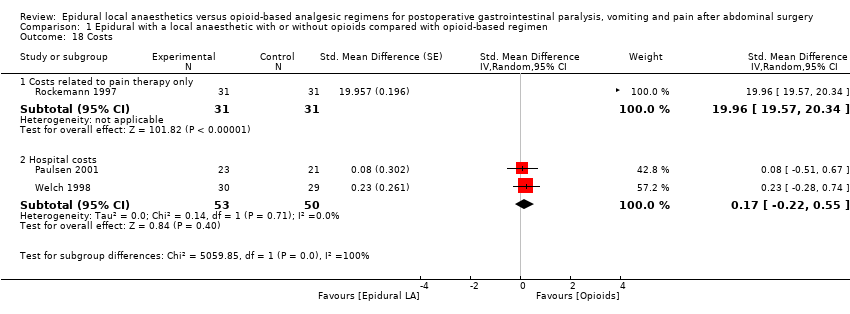
| 18 Costs Show forest plot | 3 | | Std. Mean Difference (Random, 95% CI) | Subtotals only |
|
| 18.1 Costs related to pain therapy only | 1 | 62 | Std. Mean Difference (Random, 95% CI) | 19.96 [19.57, 20.34] |
| 18.2 Hospital costs | 2 | 103 | Std. Mean Difference (Random, 95% CI) | 0.17 [‐0.22, 0.55] |