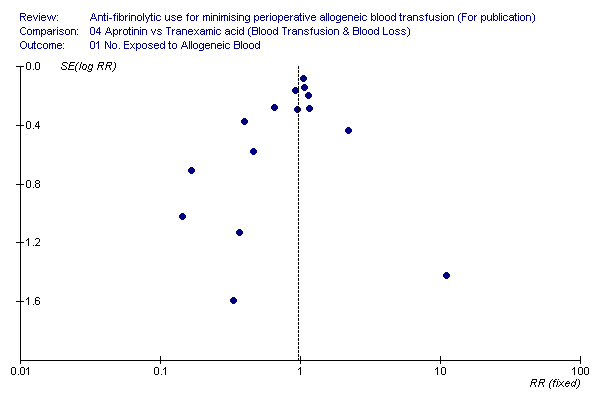
| 1 No. Exposed to Allogeneic Blood Show forest plot | 99 | 10144 | Risk Ratio (M‐H, Random, 95% CI) | 0.66 [0.62, 0.71] |
|
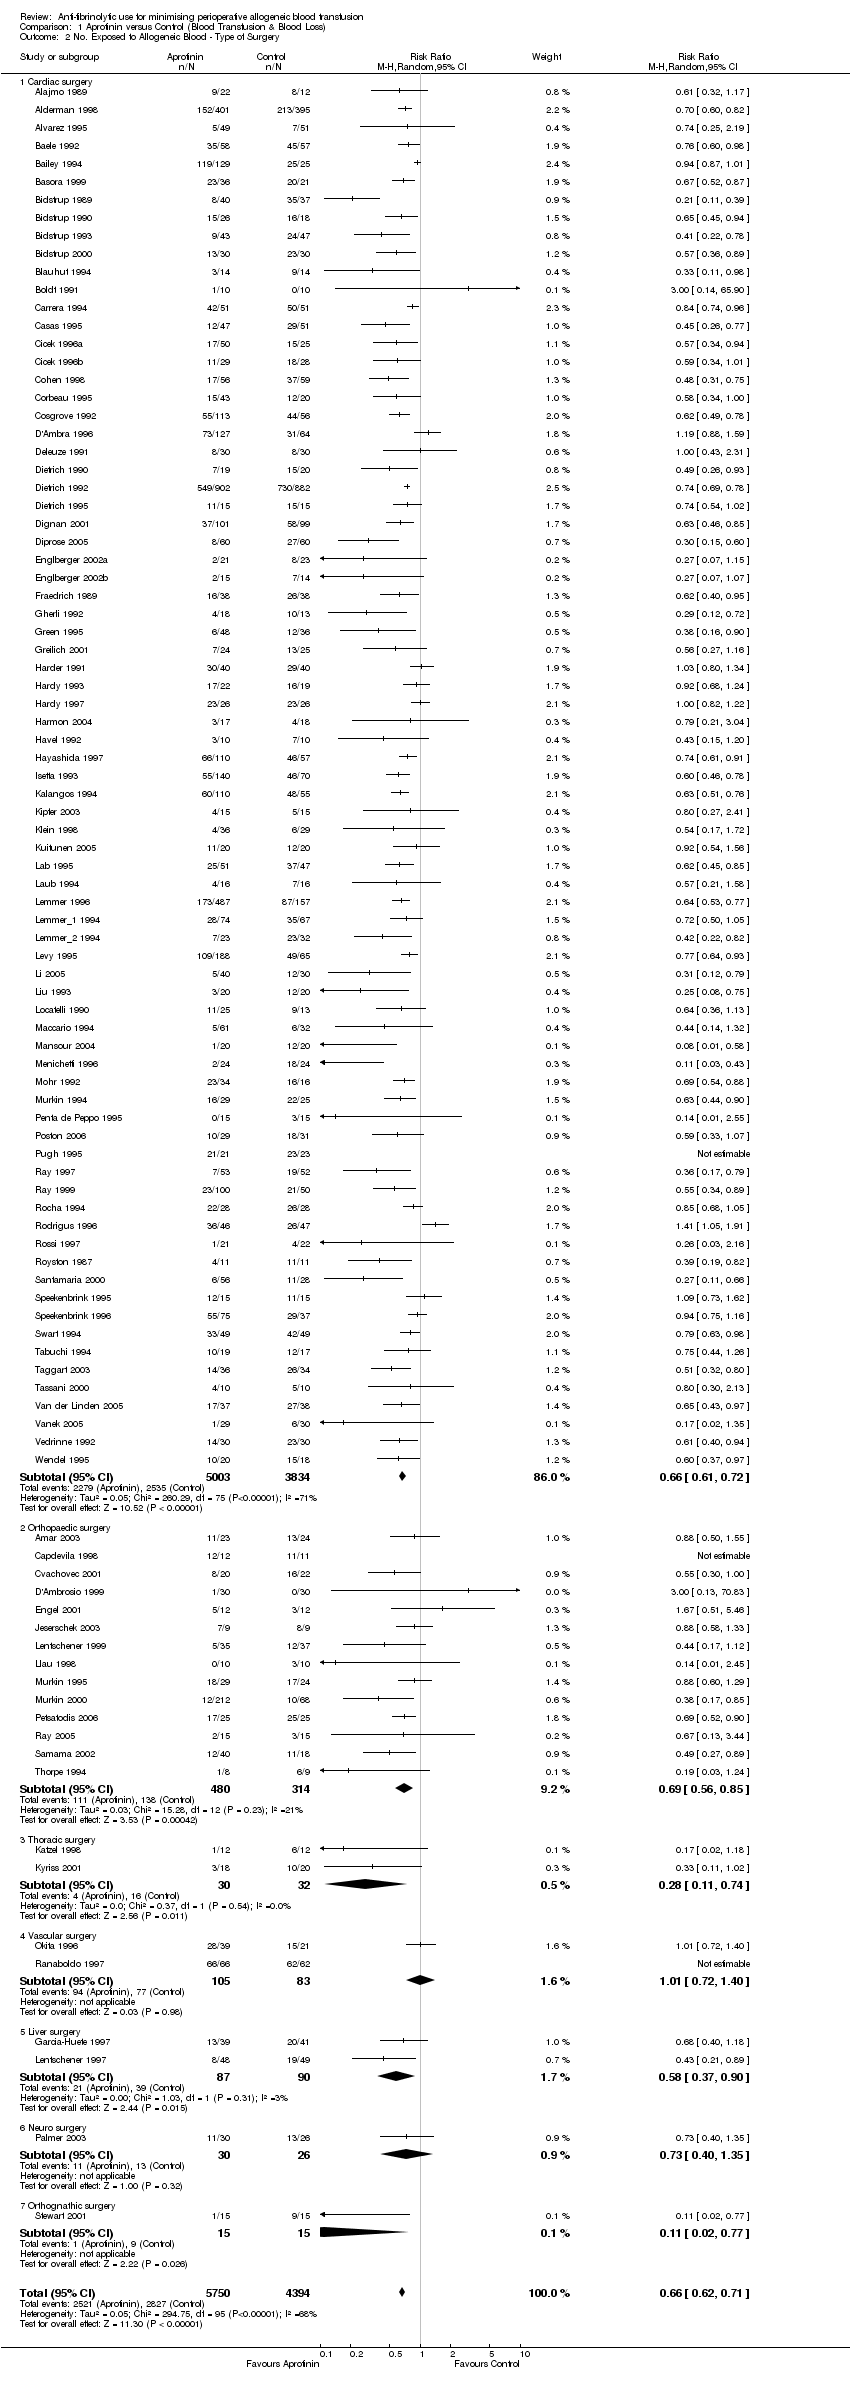
| 2 No. Exposed to Allogeneic Blood ‐ Type of Surgery Show forest plot | 99 | 10144 | Risk Ratio (M‐H, Random, 95% CI) | 0.66 [0.62, 0.71] |
|
| 2.1 Cardiac surgery | 77 | 8837 | Risk Ratio (M‐H, Random, 95% CI) | 0.66 [0.61, 0.72] |
| 2.2 Orthopaedic surgery | 14 | 794 | Risk Ratio (M‐H, Random, 95% CI) | 0.69 [0.56, 0.85] |
| 2.3 Thoracic surgery | 2 | 62 | Risk Ratio (M‐H, Random, 95% CI) | 0.28 [0.11, 0.74] |
| 2.4 Vascular surgery | 2 | 188 | Risk Ratio (M‐H, Random, 95% CI) | 1.01 [0.72, 1.40] |
| 2.5 Liver surgery | 2 | 177 | Risk Ratio (M‐H, Random, 95% CI) | 0.58 [0.37, 0.90] |
| 2.6 Neuro surgery | 1 | 56 | Risk Ratio (M‐H, Random, 95% CI) | 0.73 [0.40, 1.35] |
| 2.7 Orthognathic surgery | 1 | 30 | Risk Ratio (M‐H, Random, 95% CI) | 0.11 [0.02, 0.77] |
| 3 No. Exposed to Allogeneic Blood ‐ Transfusion Protocol Show forest plot | 99 | 10144 | Risk Ratio (M‐H, Random, 95% CI) | 0.66 [0.62, 0.71] |
|
| 3.1 Transfusion Protocol | 79 | 8962 | Risk Ratio (M‐H, Random, 95% CI) | 0.65 [0.60, 0.70] |
| 3.2 No Transfusion Protocol | 20 | 1182 | Risk Ratio (M‐H, Random, 95% CI) | 0.73 [0.62, 0.86] |
| 4 No. Exposed to Allogeneic Blood ‐ Dose Show forest plot | 98 | 11088 | Risk Ratio (M‐H, Random, 95% CI) | 0.68 [0.64, 0.72] |
|
| 4.1 Prime Dose | 16 | 1251 | Risk Ratio (M‐H, Random, 95% CI) | 0.83 [0.71, 0.96] |
| 4.2 Low Dose | 46 | 3268 | Risk Ratio (M‐H, Random, 95% CI) | 0.66 [0.59, 0.74] |
| 4.3 High Dose | 56 | 6569 | Risk Ratio (M‐H, Random, 95% CI) | 0.65 [0.60, 0.71] |
| 5 No. Exposed to Allogeneic Blood ‐ Dose (Cardiac Surgery) Show forest plot | 76 | 9763 | Risk Ratio (M‐H, Random, 95% CI) | 0.68 [0.64, 0.73] |
|
| 5.1 Prime Dose | 15 | 1191 | Risk Ratio (M‐H, Random, 95% CI) | 0.81 [0.69, 0.96] |
| 5.2 Low Dose | 25 | 2039 | Risk Ratio (M‐H, Random, 95% CI) | 0.67 [0.58, 0.77] |
| 5.3 High Dose | 55 | 6533 | Risk Ratio (M‐H, Random, 95% CI) | 0.66 [0.60, 0.72] |
| 6 Trial Quality (Allocation Concealment ‐ Cochrane Scale) Show forest plot | 98 | 10100 | Risk Ratio (M‐H, Random, 95% CI) | 0.66 [0.62, 0.71] |
|
| 6.1 Quality A | 29 | 2264 | Risk Ratio (M‐H, Random, 95% CI) | 0.65 [0.54, 0.78] |
| 6.2 Quality B | 57 | 7037 | Risk Ratio (M‐H, Random, 95% CI) | 0.68 [0.63, 0.73] |
| 6.3 Quality C | 12 | 799 | Risk Ratio (M‐H, Random, 95% CI) | 0.60 [0.49, 0.73] |
| 7 Units of Allogeneic Blood Transfused ‐ Transfused Patients Show forest plot | 38 | 3388 | Mean Difference (IV, Random, 95% CI) | ‐0.96 [‐1.24, ‐0.68] |
|
| 8 Units of Allogeneic Blood Transfused ‐ All Patients Show forest plot | 63 | 6820 | Mean Difference (IV, Random, 95% CI) | ‐1.07 [‐1.31, ‐0.83] |
|
| 9 Blood loss ‐ Intra‐operative Show forest plot | 13 | 722 | Mean Difference (IV, Random, 95% CI) | ‐185.32 [‐280.23, ‐90.41] |
|
| 9.1 Cardiac surgery | 5 | 360 | Mean Difference (IV, Random, 95% CI) | ‐140.00 [‐244.42, ‐35.59] |
| 9.2 Orthopaedic surgery | 5 | 201 | Mean Difference (IV, Random, 95% CI) | ‐151.05 [‐317.63, 15.52] |
| 9.3 Thoracic surgery | 1 | 24 | Mean Difference (IV, Random, 95% CI) | ‐532.0 [‐863.00, ‐199.00] |
| 9.4 Liver surgery | 2 | 137 | Mean Difference (IV, Random, 95% CI) | ‐1200.40 [‐2943.39, 542.59] |
| 10 Blood loss ‐ Post‐operative Show forest plot | 79 | 7414 | Mean Difference (IV, Random, 95% CI) | ‐358.13 [‐403.64, ‐312.62] |
|
| 10.1 Cardiac surgery | 68 | 6948 | Mean Difference (IV, Random, 95% CI) | ‐385.43 [‐432.36, ‐338.50] |
| 10.2 Orthopaedic surgery | 7 | 318 | Mean Difference (IV, Random, 95% CI) | ‐113.58 [‐223.69, ‐3.46] |
| 10.3 Thoracic surgery | 1 | 24 | Mean Difference (IV, Random, 95% CI) | ‐441.0 [‐786.40, ‐95.60] |
| 10.4 Orthognathic surgery | 1 | 30 | Mean Difference (IV, Random, 95% CI) | ‐513.0 [‐717.21, ‐308.79] |
| 10.5 LIver surgery | 1 | 44 | Mean Difference (IV, Random, 95% CI) | ‐105.0 [‐194.36, ‐15.64] |
| 10.6 Vascular surgery | 1 | 50 | Mean Difference (IV, Random, 95% CI) | ‐203.00 [‐404.93, ‐1.07] |
| 11 Blood loss ‐ Post‐operative ‐ Dose (Cardiac Surgery) Show forest plot | 68 | 7758 | Mean Difference (IV, Random, 95% CI) | ‐380.30 [‐421.96, ‐338.63] |
|
| 11.1 Prime Dose | 15 | 1158 | Mean Difference (IV, Random, 95% CI) | ‐343.08 [‐458.13, ‐228.04] |
| 11.2 Low Dose | 21 | 1781 | Mean Difference (IV, Random, 95% CI) | ‐293.24 [‐348.67, ‐237.81] |
| 11.3 High Dose | 48 | 4819 | Mean Difference (IV, Random, 95% CI) | ‐428.09 [‐485.38, ‐370.80] |
| 12 Blood loss ‐ Total Show forest plot | 15 | 1577 | Mean Difference (IV, Random, 95% CI) | ‐414.48 [‐520.13, ‐308.82] |
|
| 12.1 Cardiac surgery | 5 | 1147 | Mean Difference (IV, Random, 95% CI) | ‐489.06 [‐571.32, ‐406.80] |
| 12.2 Orthopaedic surgery | 10 | 430 | Mean Difference (IV, Random, 95% CI) | ‐399.09 [‐562.81, ‐235.37] |