Intervenciones para la prevención de la obesidad infantil
Información
- DOI:
- https://doi.org/10.1002/14651858.CD001871.pub4Copiar DOI

- Base de datos:
-
- Cochrane Database of Systematic Reviews
- Versión publicada:
-
- 23 julio 2019see what's new
- Tipo:
-
- Intervention
- Etapa:
-
- Review
- Grupo Editorial Cochrane:
-
Grupo Cochrane de Salud pública
- Copyright:
-
- Copyright © 2019 The Cochrane Collaboration. Published by John Wiley & Sons, Ltd.
Cifras del artículo
Altmetric:
Citado por:
Autores
Contributions of authors
Tamara Brown led the review process up to June 2015, worked on the amended protocol, conducted the searching, developed the extraction template, extracted data, provided advice with data extraction, meta analysis and data synthesis decisions, performed data synthesis, and wrote the review text and contributed to previous versions of this review. She also screened records for the 2018 update search.
Theresa Moore led the process of responding to reviewers' and editors' comments for the 2015 update, including meta‐analysis, review structure, interpretation of data, synthesis of evidence, implementation of GRADE, drafting and editing of review text and screening titles and abstracts. She also led the process for the 2018 update search.
Lee Hooper checked data syntheses, interpreted the results, assisted with the draft and helped to revise the manuscript.
Yang Gao helped with data extraction, translation of studies, contributed to previous versions of this review, assisted with the draft and helped to revise the manuscript.
Sharea Ijaz assessed risk of bias, helped with data extraction, assisted with the draft and helped to revise the manuscript.
Martha Elwenspoek screened titles and abstracts and commented on the final review.
Amir Zayegh helped with data extraction and commented on the final review.
Sophie Foxen helped with data extraction and commented on the final review.
Lucia Magee helped with data extraction and commented on the final review.
Claire O'Malley helped with searching, data extraction and commented on the final review.
Liz Waters (deceased) initially provided the overall structure and process and contributed to previous versions of this review.
Carolyn Summerbell: provided the overall structure and process; contributed to previous versions of this review;
amended the protocol; developed the extraction template; extracted data; interpreted the results; revised the manuscript; and commented on the final review. As corresponding author, Carolyn has had full access to the data in the review and takes final responsibility for the decision to submit for publication.
Sources of support
Internal sources
-
Fuse, NIHR (National Institute for Health Research Collaboration) Centre for Translational Research in Public Health, UK.
-
Faculty of Health and Social Sciences, Durham University, UK.
-
School of Medicine, Deakin University, Australia.
-
School of Population and Global Health, University of Melbourne, Australia.
-
National Institute for Health Research (NIHR) Collaboration for Leadership in Applied Health Research and Care West (CLAHRC West), UK.
‐ supported the time of Theresa Moore, Sharea Ijaz, Jelena Savovic, Alison Richards and Martha Elvenspoek.
-
Population Health Sciences, Bristol Medical School, University of Bristol, UK.
External sources
-
World Health Organization, Switzerland.
-
Cochrane Review Support Funding, Cochrane Central Executive, UK.
Declarations of interest
Tamara Brown: no conflicts of interest to report
Theresa Moore: no conflicts of interest to report
Lee Hooper: no conflicts of interest to report
Yang Gao: no conflicts of interest to report
Amir Zayegh: no conflicts of interest to report
Sharea Ijaz: no conflicts of interest to report
Sophie Foxen: no conflicts of interest to report
Lucia Magee: no conflicts of interest to report
Claire O'Malley: no conflicts of interest to report
Carolyn Summerbell: no conflicts of interest to report
Martha Elwenspoek: no conflicts of interest to report
Acknowledgements
This work is dedicated to Elizabeth Waters, who sadly died in 2015. Liz was instrumental in creating the Cochrane Public Health Group. She and Carolyn Summerbell co‐led this Cochrane systematic review, Interventions for Preventing Obesity in Children, from its inception to 2015.
The review authors would like to thank: All organisations who helped to fund this review (see Sources of support); the Review Advisory Group for their guidance: Colin Bell (Associate Professor, School of Medicine, Deakin University, Australia) and Lisa Gibbs (Associate Professor, Melbourne School of Population and Global Health, University of Melbourne, Australia); Tim Armstrong and Temo Waqanivalu from the World Health Organization for their support and peer review; Liz Bickerdike and Toby Lasserson and other team members from the Cochrane Editorial Unit, Cochrane Central Executive, for help with data checking and providing detailed constructive feedback; Rebecca Armstrong (previously the joint Co‐ordinating Editor), Daniel Francis (Editor), Luke Wolfenden (Coordinating Editor) and Jodie Doyle (Managing Editor) of Cochrane Public Health; Anonymous copy editor from The Cochrane copy edit team for astonishing, and much valued, attention to detail; Julian Higgins (CLAHRC West) and Jelena Savovic (CLAHRC West) for expertise and wisdom; Lauren Scott (CLAHRC West) for advice on analysis of cluster‐RCTs; James Nobles for advice on implementation; Geraldine Cutler, Anna Ferguson and Zoe Trinder‐Widess (Patient and Public Involvement Panel CLAHRC West) for shaping of the plain language summary and Alison Richards (CLAHRC West) for some of the literature searches.
The views expressed in this article are those of the author(s) and not necessarily those of the NHS, the NIHR, or the Department of Health and Social Care (all UK), or the Cochrane Collaboration or World Health Organization.
Version history
| Published | Title | Stage | Authors | Version |
| 2019 Jul 23 | Interventions for preventing obesity in children | Review | Tamara Brown, Theresa HM Moore, Lee Hooper, Yang Gao, Amir Zayegh, Sharea Ijaz, Martha Elwenspoek, Sophie C Foxen, Lucia Magee, Claire O'Malley, Elizabeth Waters, Carolyn D Summerbell | |
| 2011 Dec 07 | Interventions for preventing obesity in children | Review | Elizabeth Waters, Andrea de Silva‐Sanigorski, Belinda J Burford, Tamara Brown, Karen J Campbell, Yang Gao, Rebecca Armstrong, Lauren Prosser, Carolyn D Summerbell | |
| 2005 Jul 20 | Interventions for preventing obesity in children | Review | Carolyn D Summerbell, Elizabeth Waters, Laurel Edmunds, Sarah AM Kelly, Tamara Brown, Karen J Campbell | |
| 2002 Apr 22 | Interventions for preventing obesity in children | Review | Karen J Campbell, Elizabeth Waters, Susan O'Meara, Sarah Kelly, Carolyn D Summerbell | |
Differences between protocol and review
Objectives
We have reduced the objectives of this review to an analysis of zBMI scores, BMI and adverse events. Earlier versions of this review included several additional primary and secondary outcomes and we have not attempted to assess the effect of interventions on changes in prevalence of obesity, and rate of weight gain among children under 18 years (see primary outcomes section below for details).
Search
We have updated the search to 2018, however we have not yet synthesised evidence from identified potential studies into the review. The rationale for this is that the evidence on this topic is accruing at the rate of 2000 to 4000 records per year, or approximately 200 potentially relevant, full‐text papers to assess per year. Added to this, the current scope of this review is too broad to identify nuanced differences in what works for whom in which setting. By publishing the synthesis of the 2015 search we present the most up‐to‐date, synthesised evidence. The list of potentially relevant studies makes the next tranche of evidence available to researchers. We will now divide this review into three smaller reviews by age group of child. We will prepare new protocols for these reviews in which all methods can be revised and from which we will be able to carry out a more detailed analysis of the effects of interventions.
Searching other resources
For the 2018 update we searched Clinicaltrials.gov (clinicaltrials.gov/), with the filter 'Applied Filters: Child (birth–17)'. We also searched the WHO International Clinical Trials Registry Platform, search portal (apps.who.int/trialsearch/), using the filter for studies in children.
Types of studies
Controlled trials without randomisation (CCTs) had been included in this review up to and including the 2011 update. From 2015 onwards we excluded CCTs as there are were sufficient numbers of RCTs available to contribute to this research question. As a result we excluded 10 CCTs from this review. In the 2011 version we excluded cluster‐RCTs with fewer than six clusters, resulting in the exclusion of three studies. In the 2001 and 2002 version, we included studies regardless of publication date. In the 2005 version (and onwards), studies published before 1990 were excluded, resulting in the exclusion of one study. Our rationale for this is that global evidence suggests that the prevalence of overweight and obesity in children, including preschool children, started to rise at the end of the 1980s (de Onis 2010; GBD Obesity Collaboration 2014). Given the lag time between the conception, funding, and the completion of RCTs, we considered a 1990 publication date as a pragmatic and reasonable starting point for the literature in the area.
Data collection
Indicators of theory and process
We collected data on indicators of intervention process and evaluation, health promotion theory underpinning intervention design, modes of strategies and attrition rates. We compared where possible, whether the effect of the intervention varied according to these factors. We included this information in descriptive analyses and used it to guide the interpretation of findings and recommendations.
Primary outcomes
We have reduced the number of primary outcomes to
-
zBMI
-
BMI
-
Adverse events
We are no longer presenting data on the outcomes listed below, although we have recorded which studies reported these outcomes.
-
Prevalence of overweight and obesity
-
Weight and height
-
Ponderal index
-
Per cent fat content
-
Skin‐fold thickness
Selection of studies
For the 2015 update, one reviewer (TB) screened titles and abstracts, with a random subsample (10%) checked by another review author (CS). For the 2018 update two review authors (TB and ME) independently assessed, in duplicate, all titles and abstracts, using RAYYAN software (Rayyan‐QCRI 2016).
Assessment of risk of bias in included studies
Selective outcome reporting
In the 2011 review, studies were at low risk of reporting bias when a published protocol was available, and all specified outcomes were included in the study report; we assessed studies without a published protocol as unclear risk of reporting bias. For this current version, we have followed methods as described in the Cochrane Handbook for Systematic Reviews of Interventions (Higgins 2017) and have sought protocols or trials register reports for all studies, and compared reported outcomes, with those specified a priori. Full details are in the methods.
Measures of treatment effect
Unit of analysis issues
For cluster‐randomised studies, we assessed whether the study had analysed the data using methods that accounted for clustering. For those studies that had used analyses that were not able to account for clustering, for example using t‐tests, we approximated clustering effects using methods as stated in the Cochrane Handbook for Systematic Reviews of Interventions (Higgins 2011a). We ran sensitivity analyses comparing the meta‐analyses with and without approximate adjustment for clusters. There were very slight differences in the pooled treatment effects. We then elected to use the outcomes with approximation of adjustment for clustering. Full details are in the methods section.
Data synthesis
We pooled zBMI data and BMI data separately in the meta‐analyses for this update. Previous versions aggregated data from these outcomes using standardised mean differences. Also, we have not presented a pooled analysis for all studies. Instead we have presented distinct comparisons for each age group. We have subgrouped these by setting and duration. We believe the populations, children aged 0 to 5 years, children aged 6 to 12 years and young people aged 13 to 18 years, to be too different, developmentally, to be considered to be a single sample. Interventions that are likely to work on a four‐year‐old, are unlikely to work in adolescents, and vice versa. We have presented the effects of BMI and zBMI for each of the three age groups as the main analyses in this review. In future this review will be split into three new reviews by the age group of the children, to allow a more detailed analysis of the data.
This update of the review pooled data using generic inverse variance for zBMI and BMI. Previous versions of the review reported several outcomes including adiposity, physical activity‐related behaviours or diet‐related behaviours, however, in this version we have reported only results for the anthropometric outcomes zBMI and BMI. This was because of the volume of outcome data from 153 included studies. We will re‐evaluate decisions on the outcome measures of interest and analysis of outcomes in the next update of this review.
Our 2018 update search identified several potentially relevant studies after title and abstract screening. We have not yet extracted data and information about these studies but have classified them as 'Studies awaiting classification' (see Characteristics of studies awaiting classification). This allowed the review authors to publish this systematic review with the synthesis of data from the 2015 search and also to list studies potentially relevant to the review at the next update and make them available to users of this review. With the exceptionally rapid accrual of literature and studies on this topic, updating this review becomes increasingly difficult (See Figure 2). In addition, systematic review and analysis methods have also changed since 2001 when this review was first published. The review team plan to split the review into three new reviews based upon the age of the children, and this will provide an opportunity to update the objectives and analysis methods of the review.
Subgroup analysis and investigation of heterogeneity
In the 2001, 2002 and 2005 versions, studies we categorised studies into long‐term (at least one year) and short‐term (at least 12 weeks), referring to the length of the intervention itself or to a combination of the intervention with a follow‐up phase. For the 2011 version and this current version, we categorised studies based on target age group (0 to 5 years, 6 to 12 years, and 13 to 18 years) rather than study duration, to enhance utility of this review for decision makers as these age groups correspond to stages of developmental and childhood settings.
In earlier versions of this review we evaluated effectiveness by subgrouping according to risk of bias based on one domain only, randomisation. For this review we have used the GRADE process to assess the effects of risk of bias on the outcomes by downgrading evidence if risk of bias affected the treatment effect. See Assessment of risk of bias in included studies.
GRADE and 'Summary of findings' table
We created 'Summary of findings' tables to summarise the size and certainty of effects of the interventions. This was based on the five GRADE considerations (risk of bias, consistency of effect, imprecision, indirectness and publication bias). We used GRADEpro software (GRADEpro GDT 2015), and followed methods described in the Cochrane Handbook for Systematic Reviews of Interventions (Section 8.5 (Higgins 2017), and Chapter 12, (Schünemann 2017)). In determining consistency of effects for each comparison we looked at the I2 statistic value. For comparisons where the meta‐analysis had an I2 statistic value above 60% we determined these to be at ‘serious’ inconsistency, if the I2 was above 85% we considered this to be ‘very serious’ inconsistency. For risk of bias, we examined if the treatment changed markedly upon removal of studies at high risk of bias. If the effect change was small we did not downgrade. However, if the effect size was large then we downgraded the evidence.
Keywords
MeSH
Medical Subject Headings (MeSH) Keywords
Medical Subject Headings Check Words
Adolescent; Child; Child, Preschool; Female; Humans; Infant; Male;
PICO


Increase in number of records retrieved and studies included in this systematic review from 2001 until 2017

Distribution of studies by location, age of children and type of intervention. * Total number of locations is 154 and not 153 (number of studies) as one study, Lana 2014, was located in both Spain and Mexico. Papadaki 2010 was located in 7 countries across Europe.

'Risk of bias' graph: review authors' judgements about each 'Risk of bias' item presented as percentages across all included studies

'Risk of bias' summary: review authors' judgements about each 'Risk of bias' item for each included study

Funnel plots of all comparisons with more than 10 studies. A Funnel plot of comparison 3. Diet and physical activity interventions versus control in children aged 0‐5 years. Outcome: zBMI. No evidence of asymmetry (Egger test P = 0.958). B Funnel plot of comparison 3. Diet and physical activity interventions versus control in children aged 0‐5 years. Outcome: BMI. No evidence of asymmetry (Egger test P = 0.529). C Funnel plot of comparison 5. Physical activity interventions versus control in children aged 6‐12. Outcome: BMI. No evidence of asymmetry (Egger test P = 0.763). D Funnel plot of comparison 6. Physical activity interventions versus control in children aged 6‐12. Outcome: zBMI. No evidence of asymmetry (Egger test P = 0.304). E Funnel plot of comparison 6. Physical activity interventions versus control in children aged 6‐12. Outcome: BMI. No evidence of asymmetry (Egger test P = 0.768).
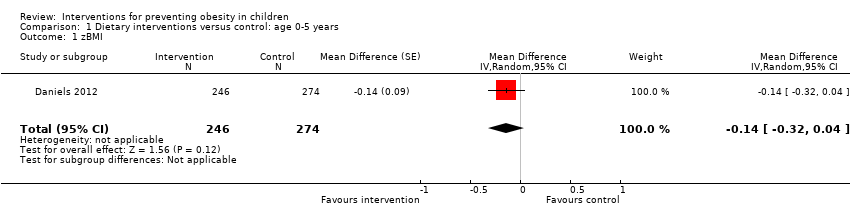
Comparison 1 Dietary interventions versus control: age 0‐5 years, Outcome 1 zBMI.

Comparison 2 Physical activity interventions versus control: age 0‐5 years, Outcome 1 zBMI. Physical activity vs control ‐ setting.

Comparison 2 Physical activity interventions versus control: age 0‐5 years, Outcome 2 BMI. Physical activity vs control ‐ setting.

Comparison 3 Diet and physical activity interventions versus control: age 0‐5 years, Outcome 1 zBMI. Diet and physical activity vs control ‐ setting.

Comparison 3 Diet and physical activity interventions versus control: age 0‐5 years, Outcome 2 zBMI. Diet and physical activity vs control ‐ duration.

Comparison 3 Diet and physical activity interventions versus control: age 0‐5 years, Outcome 3 BMI. Diet and physical activity vs control ‐ setting.

Comparison 3 Diet and physical activity interventions versus control: age 0‐5 years, Outcome 4 BMI. Diet and physical activity vs control ‐ duration.

Comparison 4 Dietary interventions versus control: age 6‐12 years, Outcome 1 zBMI ‐ setting.

Comparison 4 Dietary interventions versus control: age 6‐12 years, Outcome 2 BMI ‐ setting.

Comparison 5 Physical activity interventions versus control: age 6‐12, Outcome 1 zBMI. Physical activity vs control ‐ setting.

Comparison 5 Physical activity interventions versus control: age 6‐12, Outcome 2 zBMI. Physical activity vs control ‐ duration.

Comparison 5 Physical activity interventions versus control: age 6‐12, Outcome 3 BMI. Physical activity vs control ‐ setting.

Comparison 5 Physical activity interventions versus control: age 6‐12, Outcome 4 BMI. Physical activity vs control ‐ duration.

Comparison 6 Diet and physical activity interventions vs control: age 6‐12 years, Outcome 1 zBMI. Diet and physical activity vs control ‐ setting.

Comparison 6 Diet and physical activity interventions vs control: age 6‐12 years, Outcome 2 zBMI. Diet and physical activity vs control ‐ duration.

Comparison 6 Diet and physical activity interventions vs control: age 6‐12 years, Outcome 3 BMI. Diet and physical activity vs control ‐ setting.

Comparison 6 Diet and physical activity interventions vs control: age 6‐12 years, Outcome 4 BMI. Diet and physical activity vs control ‐ duration.

Comparison 7 Diet interventions versus control: age 13‐18 years, Outcome 1 BMI ‐ setting.

Comparison 8 Physical activity interventions versus control: age 13‐18 years, Outcome 1 zBMI ‐ setting.

Comparison 8 Physical activity interventions versus control: age 13‐18 years, Outcome 2 zBMI ‐ duration.

Comparison 8 Physical activity interventions versus control: age 13‐18 years, Outcome 3 BMI ‐ setting.

Comparison 8 Physical activity interventions versus control: age 13‐18 years, Outcome 4 BMI ‐ duration.

Comparison 9 Diet and physical activity interventions versus control: age 13‐18 years, Outcome 1 zBMI ‐ setting.

Comparison 9 Diet and physical activity interventions versus control: age 13‐18 years, Outcome 2 zBMI ‐ duration.

Comparison 9 Diet and physical activity interventions versus control: age 13‐18 years, Outcome 3 BMI ‐ setting.

Comparison 9 Diet and physical activity interventions versus control: age 13‐18 years, Outcome 4 BMI ‐ duration.

Comparison 10 Dietary interventions versus physical activity interventions: age 6‐12 years, Outcome 1 zBMI.

Comparison 10 Dietary interventions versus physical activity interventions: age 6‐12 years, Outcome 2 BMI.

Comparison 11 Diet and physical activity versus physical activity interventions: age 6‐12 years, Outcome 1 zBMI.

Comparison 11 Diet and physical activity versus physical activity interventions: age 6‐12 years, Outcome 2 BMI.

Comparison 12 Dietary interventions versus diet and physical activity interventions: age 6‐12 years, Outcome 1 zBMI.

Comparison 12 Dietary interventions versus diet and physical activity interventions: age 6‐12 years, Outcome 2 BMI.
| Dietary interventions compared to control for preventing obesity in children aged 0 to 5 years | |||||
| Patient or population: children aged 0‐5 years | |||||
| Outcomes | Anticipated absolute effects* (95% CI) | № of participants | Certainty of the evidence | Comments | |
| Risk with control | Risk with dietary interventions | ||||
| Body‐mass index z score (zBMI) | The mean zBMI was 0.75 | MD 0.14 lower (0.32 lower to 0.04 higher) | 520 | ⊕⊕⊕⊝ | Dietary interventions likely result in little to no difference in zBMI |
| *The risk in the intervention group (and its 95% confidence interval) is based on the assumed risk in the comparison group and the relative effect of the intervention (and its 95% CI). | |||||
| GRADE Working Group grades of evidence | |||||
| 1Risk of bias: there is only one study and it has one domain (incomplete outcome data) rated as high risk of bias, with 22% of participants dropping out of the study. | |||||
| Physical activity interventions compared to control for preventing obesity in children aged 0 to 5 years | |||||
| Patient or population: children aged 0‐5 years | |||||
| Outcomes | Anticipated absolute effects* (95% CI) | № of participants | Certainty of the evidence | Comments | |
| Risk with control | Risk with physical activity interventions | ||||
| Body‐mass index (BMI) | The mean BMI ranged from 15.94 to 16.4 kg/m2 | MD 0.22 kg/m2 lower | 2233 | ⊕⊕⊕⊕ | Physical activity interventions likely do not reduce BMI |
| Body‐mass index z score (zBMI) | The mean zBMI ranged from −0.15 to −0.22 | MD 0.01 higher | 1053 | ⊕⊕⊕⊕ | Physical activity interventions likely do not reduce zBMI |
| *The risk in the intervention group (and its 95% confidence interval) is based on the assumed risk in the comparison group and the relative effect of the intervention (and its 95% CI). | |||||
| GRADE Working Group grades of evidence | |||||
| Diet and physical activity interventions combined compared to control for preventing obesity in children age 0‐5 years | |||||
| Patient or population: children aged 0‐5 years | |||||
| Outcomes | Anticipated absolute effects* (95% CI) | № of participants | Certainty of the evidence | Comments | |
| Risk with control | Risk with diet and physical activity interventions | ||||
| Body‐mass index z score (zBMI) | The mean zBMI ranged from 0.15 to 0.98 | MD 0.07 lower (0.14 lower to 0.01 lower) | 6261 | ⊕⊕⊕⊝ | Diet and physical activity interventions potentially slightly reduce zBMI |
| Body‐mass index (BMI) | The mean BMI ranged from 15.8 to 17.62 kg/m2 | MD −0.11 kg/m2 lower | 5536 | ⊕⊕⊕⊝ | Diet and physical activity interventions likely result in little to no difference in BMI |
| *The risk in the intervention group (and its 95% confidence interval) is based on the assumed risk in the comparison group and the relative effect of the intervention (and its 95% CI). | |||||
| GRADE Working Group grades of evidence | |||||
| 1Heterogeneity of this analysis as measured with I2 statistic was 66%, and therefore at high risk of bias. | |||||
| Adverse event outcomes for dietary combined with physical activity interventions compared to control for preventing obesity in children aged 0 to 5 years | |||
| Patient or population: children aged 0 to 5 years | |||
| Outcomes | Impact | № of participants | Certainty of the evidence |
| Insufficient weight gain in infants | One study of an infant feeding intervention. There was no difference in numbers of infants with weight < 5th percentile between intervention and control groups nor in the numbers of children dropping by 2 major centiles between year 1 and year 2, but this was just 80 participants. | 110 | ⊕⊝⊝⊝ |
| Physical injuries | No effect of intervention on numbers of physical injuries reported in the control and intervention arms | 652 | ⊕⊕⊝⊝ |
| Adverse events | No 'adverse events' reported | 983 | ⊕⊕⊝⊝ |
| Infections | No effect of intervention on numbers of reported infections. These data are very uncertain. A single study of just 41 participants found similar numbers of (parent‐reported) infections in children in the intervention and control groups. | 709 | ⊕⊕⊝⊝ |
| Accidents | No effect on number of accidents. These data are very uncertain. A single study of just 41 participants found similar numbers of (parent‐reported) accidents in children in the intervention and control groups. | 42 | ⊕⊝⊝⊝ |
| RCT: randomised controlled trial | |||
| GRADE Working Group grades of evidence | |||
| 1Downgraded three times. Twice for imprecision, as evidence based on just one study with only 110 participants. Downloaded once for risk of bias as we judged three domains at high risk of bias and two unclear from a total of six items. | |||
| Dietary interventions compared to control for preventing obesity in children aged 6 to 12 years | |||||
| Patient or population: children aged 6‐12 years | |||||
| Outcomes | Anticipated absolute effects* (95% CI) | № of participants | Certainty of the evidence | Comments | |
| Risk with control | Risk with dietary interventions | ||||
| Body‐mass index z score (zBMI) | The mean zBMI ranged from 0.09 to 0.41 | MD 0.03 lower (0.06 lower to 0.01 higher) | 7231 | ⊕⊕⊕⊕ | Dietary interventions alone do not reduce zBMI |
| Body‐mass index (BMI) | The mean BMI ranged from 17.9 to 25.1 kg/m2 | MD 0.02 kg/m2 lower (0.11 lower to 0.06 higher) | 5061 | ⊕⊕⊕⊕ | Dietary interventions alone do not reduce BMI |
| *The risk in the intervention group (and its 95% confidence interval) is based on the assumed risk in the comparison group and the relative effect of the intervention (and its 95% CI). | |||||
| GRADE Working Group grades of evidence | |||||
| Physical activity interventions compared to control for preventing obesity in children aged 6 to 12 years | |||||
| Patient or population: children aged 6‐12 years | |||||
| Outcomes | Anticipated absolute effects* (95% CI) | № of participants | Certainty of the evidence | Comments | |
| Risk with control | Risk with physical activity interventions | ||||
| Body‐mass index z score (zBMI) | The mean zBMI ranged from 0.09 to 1.75 | MD 0.02 lower (0.06 lower to 0.02 higher) | 6841 | ⊕⊕⊕⊝ | Physical activity interventions likely result in little to no difference in zBMI. Physical activity vs control ‐ setting |
| Body‐mass index (BMI) | The mean BMI ranged from 15.7 to 20.41 kg/m2 | MD 0.1 kg/m2 lower | 16,410 | ⊕⊕⊕⊝ | Physical activity interventions likely reduce BMI |
| *The risk in the intervention group (and its 95% confidence interval) is based on the assumed risk in the comparison group and the relative effect of the intervention (and its 95% CI). | |||||
| GRADE Working Group grades of evidence | |||||
| 1Four of seven studies have at least one domain judged to be high risk of bias. In addition removal of these studies substantially changes the effect of having an intervention, from no effect to there being a positive effect of the intervention. | |||||
| Adverse event outcomes for physical activity interventions compared to control for preventing obesity in children aged 6 to 12 years | |||
| Patient or population: children aged 6‐12 years | |||
| Outcomes | Impact | № of participants | Certainty of the evidence |
| Physical injuries | No effect on numbers of children with physical injuries in the control and intervention arms | 912 | ⊕⊕⊝⊝ |
| Underweight | No effect on number (proportion) of children designated as underweight | 5266 | ⊕⊕⊕⊕ |
| Depression | Depression was reduced in children in the intervention group (MD −0.21, 95% CI −0.42 to −0.001) | 225 | ⊕⊕⊝⊝ |
| Body satisfaction | No effect of intervention on reported body satisfaction at the end of the intervention | 225 | ⊕⊕⊝⊝ |
| Increased weight concerns | No effect of intervention on reported body satisfaction at the end of the intervention | 225 | ⊕⊕⊝⊝ |
| CI: confidence interval; MD: mean difference; RCT: randomised controlled trial | |||
| GRADE Working Group grades of evidence | |||
| 1Downgraded for risk of bias because this study has one domain at high risk of bias. Downgraded for imprecision because only one of 22 studies reported this outcome. | |||
| Diet and physical activity interventions combined compared to control for preventing obesity in children aged 6 to 12 years | |||||
| Patient or population: children aged 6‐12 years | |||||
| Outcomes | Anticipated absolute effects* (95% CI) | № of participants | Certainty of the evidence | Comments | |
| Risk with control | Risk with diet and physical activity interventions | ||||
| Body‐mass index z score (zBMI) | The mean zBMI ranged from 0.05 to 0.9 | MD 0.05 lower (0.10 lower to 0.01 lower) | 24,043 | ⊕⊕⊝⊝ | Diet and physical activity interventions combined may reduce zBMI slightly |
| Body‐mass index (BMI) | The mean BMI ranged from 17.57 to 24.8 kg/m2 | MD 0.05 kg/m2 lower (0.11 lower to 0.01 higher) | 19,498 | ⊕⊕⊝⊝ | Diet and physical activity interventions combined may result in little to no difference in BMI |
| *The risk in the intervention group (and its 95% confidence interval) is based on the assumed risk in the comparison group and the relative effect of the intervention (and its 95% CI). | |||||
| GRADE Working Group grades of evidence | |||||
| 1Heterogeneity was very high with an I2 statistic of 87%. | |||||
| Adverse event outcomes for dietary combined with physical activity interventions compared to control for preventing obesity in children aged 6 to 12 years | |||
| Patient or population: children aged 6 to 12 years | |||
| Outcomes | Impact | № of participants | Certainty of the evidence |
| Underweight | No effect on number (proportion) of children designated as underweight | 784 | ⊕⊕⊕⊝ |
| Depression | Depression was reduced in children in the intervention group (MD −0.21, 95% CI −0.42 to −0.001) Baseline depression score of the control group was 2.09 (SD 2.74) | 225 | ⊕⊕⊝⊝ |
| Increased weight concern | No effect of the intervention on concern about weight | 285 | ⊕⊕⊕⊕ |
| Body satisfaction | No effect of intervention (diet and physical activity) on reported body satisfaction at the end of the intervention | 1128 | ⊕⊕⊕⊕ |
| Visits to a healthcare provider | Visits to a healthcare provider were similar in the intervention and control groups; N = 1 in intervention and N = 2 in control | 60 | ⊕⊕⊝⊝ |
| Adverse events related to taking of blood samples | < 3%, similar numbers in the intervention (1.6%) and control (1.7%) groups (RD 0.00, 95% CI −0.01 to 0.01) | 4603 | ⊕⊕⊕⊝ |
| Underweight | Waist circumference of children < 10th centile for weight did not differ between the intervention and control group (P = 0.373) | 724 | ⊕⊕⊕⊝ |
| Injuries | Similar numbers of children were reported with injuries in the intervention (11%, N = 2) and control (4.7%, N = 1) groups | 60 | ⊕⊕⊝⊝ |
| *The risk in the intervention group (and its 95% confidence interval) is based on the assumed risk in the comparison group and the relative effect of the intervention (and its 95% CI). | |||
| GRADE Working Group grades of evidence | |||
| 1Downgraded for risk of bias because one of the studies had an outcome rated as high risk of bias. | |||
| Diet interventions compared to control for preventing obesity in children aged 13 to 18 years | |||||
| Patient or population: children aged 13‐18 years | |||||
| Outcomes | Anticipated absolute effects* (95% CI) | № of participants | Certainty of the evidence | Comments | |
| Risk with control | Risk with diet interventions | ||||
| Body‐mass index (BMI) | The mean BMI was 24.8 kg/m2 | MD 0.13 kg/m2 lower (0.50 lower to 0.23 higher) | 294 | ⊕⊕⊝⊝ | Diet interventions may result in little to no difference in BMI |
| *The risk in the intervention group (and its 95% confidence interval) is based on the assumed risk in the comparison group and the relative effect of the intervention (and its 95% CI). | |||||
| GRADE Working Group grades of evidence | |||||
| 1There are two studies and one has two domains at high risk of bias. | |||||
| Physical activity interventions compared to control for preventing obesity in children aged 13 to 18 years | |||||
| Patient or population: children aged 13‐18 years | |||||
| Outcomes | Anticipated absolute effects* (95% CI) | № of participants | Certainty of the evidence | Comments | |
| Risk with control | Risk with physical activity interventions | ||||
| Body‐mass index z score (zBMI) | The mean zBMI was 0.21 to 0.81 | MD 0.2 lower (0.3 lower to 0.1 lower) | 100 | ⊕⊕⊝⊝ | The evidence suggests physical activity interventions reduce zBMI |
| Body‐mass index (BMI) | The mean BMI was 20.4 to 26.65 kg/m2 | MD 1.53 kg/m2 lower | 720 | ⊕⊝⊝⊝ | The evidence is very uncertain about the effect of physical activity interventions on BMI |
| *The risk in the intervention group (and its 95% confidence interval) is based on the assumed risk in the comparison group and the relative effect of the intervention (and its 95% CI). | |||||
| GRADE Working Group grades of evidence | |||||
| 1One study with only 100 participants. | |||||
| Adverse event outcomes for physical activity interventions compared to control for preventing obesity in children age 13 to 18 years | |||
| Patient or population: children aged 13‐18 years | |||
| Outcomes | Impact | № of participants | Certainty of the evidence |
| Body satisfaction | No effect of intervention on reported body satisfaction at the end of the intervention | 190 | ⊕⊕⊝⊝ |
| Unhealthy weight gain | No effect of intervention on unhealthy gains in weight | 546 | ⊕⊕⊕⊝ |
| Self‐acceptance/self‐worth | One study (N = 190) reported no effect of intervention on self‐acceptance. A second CRt of the same intervention reported improved self‐worth in those children who received the intervention | 546 | ⊕⊕⊕⊝ |
| Binge eating | No effect of intervention on binge eating | 556 | ⊕⊕⊕⊝ |
| RCT: randomised controlled trial | |||
| GRADE Working Group grades of evidence | |||
| 1Downgraded as this study has two domains at high risk of bias. | |||
| Diet and physical activity interventions combined compared to control for preventing obesity in children aged 13 to 18 years | |||||
| Patient or population: children aged 13‐18 years | |||||
| Outcomes | Anticipated absolute effects* (95% CI) | № of participants | Certainty of the evidence | Comments | |
| Risk with control | Risk with diet and physical activity interventions combined | ||||
| Body‐mass index z score (zBMI) | The mean zBMI ranged from 0.21 to 0.81 | MD 0.01 higher (0.05 lower to 0.07 higher) | 16,543 | ⊕⊕⊝⊝ | Combined diet and physical activity interventions may result in little to no difference in zBMI |
| Body‐mass index (BMI) | The mean BMI ranged from 18.99 to 24.57 kg/m2 | MD 0.02 kg/m2 lower (0.1 lower to 0.05 higher) | 16,583 | ⊕⊕⊝⊝ | Combined diet and physical activity interventions may result in little to no difference in BMI |
| *The risk in the intervention group (and its 95% confidence interval) is based on the assumed risk in the comparison group and the relative effect of the intervention (and its 95% CI). | |||||
| GRADE Working Group grades of evidence | |||||
| 1Heterogeneity is very high, measured at 92% with I2 statistic. | |||||
| Adverse events outcomes for dietary combined with physical activity interventions compared to control for preventing obesity in children aged13 to 18 years | |||
| Patient or population: children aged 13‐18 years | |||
| Outcomes | Impact | № of participants | Certainty of the evidence |
| Depression | No effects of the intervention on depression | 779 | ⊕⊕⊕⊕ |
| Clinical levels of shape and weight concern | No effect of intervention on clinical numbers of shape or weight concern | 282 | ⊕⊕⊝⊝ |
| Anxiety | No effect of the intervention on anxiety | 779 | ⊕⊕⊕⊕ |
| RCT: randomised controlled trial | |||
| GRADE Working Group grades of evidence | |||
| 1Downgraded for risk of bias because these data appear to be from a post hoc subgroup analysis. | |||
| Dietary interventions compared to physical activity interventions for preventing obesity in children aged 6 to 12 years | |||||
| Patient or population: children aged 6‐12 years | |||||
| Outcomes | Anticipated absolute effects* (95% CI) | № of participants | Certainty of the evidence | Comments | |
| Risk with physical activity interventions | Risk with dietary intervention | ||||
| Body‐mass index (BMI) | The mean BMI ranged from 17.4 to 18.8 kg/m2 | MD 0.03 kg/m2 lower (0.25 lower to 0.2 higher) | 4917 | ⊕⊕⊕⊕ | Dietary interventions result in little to no difference in BMI compared to physical activity interventions when delivered in schools to children aged 6‐12 years |
| Body‐mass index z score (zBMI) | The mean zBMI was 0.2 | MD 0.11 lower | 1205 | ⊕⊕⊕⊕ | 'Dietary interventions' results in little to no difference in zBMI compared to physical activity interventions when delivered in schools to children aged 6‐12 years |
| *The risk in the intervention group (and its 95% confidence interval) is based on the assumed risk in the comparison group and the relative effect of the intervention (and its 95% CI). | |||||
| GRADE Working Group grades of evidence | |||||
| Diet and physical activity interventions combined compared to physical activity interventions alone for preventing obesity in children aged 6 to 12 years | |||||
| Patient or population: children aged 6‐12 years | |||||
| Outcomes | Anticipated absolute effects* (95% CI) | № of participants | Certainty of the evidence | Comments | |
| Risk with physical activity interventions | Risk with diet and physical activity interventions combined | ||||
| Body‐mass index (BMI) | The mean BMI was 17.7 kg/m2 | MD 0.04 kg/m2 lower (1.05 lower to 0.97 higher) | 3946 | ⊕⊕⊕⊕ | Combined dietary and physical activity interventions result in little to no difference in BMI compared to physical activity interventions when delivered in schools to children aged 6‐12 years |
| Body‐mass index z score (zBMI) | The mean zBMI was 0.15 | MD 0.16 lower (0.57 lower to 0.25 higher) | 3946 | ⊕⊕⊕⊕ | Combined dietary and physical activity intrventions result in little to no difference in zBMI compared to physical activity interventions when delivered in schools to children aged 6‐12 years |
| *The risk in the intervention group (and its 95% confidence interval) is based on the assumed risk in the comparison group and the relative effect of the intervention (and its 95% CI). | |||||
| GRADE Working Group grades of evidence | |||||
| Dietary interventions alone compared to diet and physical activity interventions combined for preventing obesity in children aged 6 to 12 years | |||||
| Patient or population: children aged 6‐12 years | |||||
| Outcomes | Anticipated absolute effects* (95% CI) | № of participants | Certainty of the evidence | Comments | |
| Risk with diet and physical activity interventions combined | Risk with dietary intervention | ||||
| Body‐mass index (BMI) | The mean BMI was 17.4 kg/m2 | MD 0.28 kg/m2 lower (1.67 lower to 1.11 higher) | 3971 | ⊕⊕⊕⊕ | Dietary interventions alone result in little to no difference in BMI compared to diet and physical activity interventions combined when delivered in schools to children aged 6‐12 years |
| Body‐mass index z score (zBMI) | The mean zBMI was 0.2 | MD 0.05 higher (0.38 lower to 0.48 higher) | 3971 | ⊕⊕⊕⊕ | Dietary interventions alone result in little to no difference in zBMI compared to diet and physical activity interventions combined when delivered in schools to children aged 6‐12 years |
| *The risk in the intervention group (and its 95% confidence interval) is based on the assumed risk in the comparison group and the relative effect of the intervention (and its 95% CI). | |||||
| GRADE Working Group grades of evidence | |||||
| Study | Type | Country | Theory | Setting | |||||
| Childcare/ preschool | Primary/ secondary school | Health Service | Community | Home | Duration of intervention | ||||
| Alkon 2014 | D and PA | USA | NR | X | ≤ 12 months | ||||
| Annesi 2013 | PA | USA | Social Cognitive and Self‐efficacy Theory | X | ≤ 12 months | ||||
| Barkin 2012 | D and PA | USA | Social Cognitive Theory, Transtheoretical Model of Change | X | ≤ 12 months | ||||
| Bellows 2013a | PA | USA | NR | X | > 12 months | ||||
| Birken 2012 | PA (screen time) | Canada | NR | X | ≤ 12 months | ||||
| Bonis 2014 | D and PA | USA | NR | X | ≤ 12 months | ||||
| Bonuck 2014 | D (bottle use) | USA | NR | X | ≤ 12 months | ||||
| Bonvin 2013 | PA | Switzerland | Socioecological Model | X | ≤ 12 months | ||||
| Campbell 2013 | D and PA | Australia | Social Cognitive Theory | X | > 12 months | ||||
| Crespo 2012 | D and PA | US‐Mexico border | Social Cognitive Theory and Health Belief Model | X | X | X | ≤ 12 months | ||
| Daniels 2012 | D | Australia | Attachment theory, Anticipatory Guidance, Social Cognitive Approach | X | > 12 months | ||||
| De Bock 2012 | D | Germany | Social Learning Theory and Exposure theory | X | ≤ 12 months | ||||
| De Coen 2012 | D and PA | Belgium | Socio‐ecological model | X | > 12 months | ||||
| Dennison 2004 | PA | USA | Behaviour change | X | ≤ 12 months | ||||
| De Vries 2015 | PA | Netherlands | NR | X | X | ≤ 12 months | |||
| Feng 2004 | D and PA (education only) | China | NR | X | > 12 months | ||||
| Fitzgibbon 2005 | D and PA | USA | Social Cognitive Theory | X | ≤ 12 months | ||||
| Fitzgibbon 2006 | D and PA | USA | Social Cognitive Theory | X | ≤ 12 months | ||||
| Fitzgibbon 2011 | D and PA | USA | Social Cognitive Theory, Self‐determination theory | X | X | ≤ 12 months | |||
| Haines 2013 | D and PA | USA | NR | X | ≤ 12 months | ||||
| Harvey‐Berino 2003 | D and PA | USA | Behaviour Change | X | ≤ 12 months | ||||
| Keller 2009 | D and PA | Germany | NR | X | X | ≤ 12 months | |||
| Klein 2010 | D and PA | Germany | Theory of Planned Behaviour, Precaution Adoption Process | X | > 12 months | ||||
| Mo‐suwan 1998 | PA | Thailand | Environmental Change | X | ≤ 12 months | ||||
| Natale 2014 | D and PA | USA | Socio‐ecological model | X | ≤ 12 months | ||||
| Nemet 2011 | D and PA | Israel | NR | X | ≤ 12 months | ||||
| Ostbye 2012 | D and PA | USA | Social Cognitive Theory | X | ≤ 12 months | ||||
| Paul 2011 | D | USA | NR | X | ≤ 12 months | ||||
| Puder 2011 | D and PA | Switzerland | Social Ecological model | X | > 12 months | ||||
| Reilly 2006 | PA | Scotland | Environmental Change and Behaviour Change | X | ≤ 12 months | ||||
| Roth 2015 | PA | Germany | NR | X | ≤ 12 months | ||||
| Rush 2012 | D and PA | New Zealand | NR | X | > 12 months | ||||
| Skouteris 2016 | D and PA | Australia | Learning and Social Cognitive Theories | X | ≤ 12 months | ||||
| Slusser 2012 | D and PA | USA | Social Learning Theory | X | X | X | ≤ 12 months | ||
| Story 2012 | D and PA | USA | NR | X | > 12 months | ||||
| Verbestel 2014 | D and PA | Belgium | Theories of Information Processing; the Elaboration Likelihood Model; and the Precaution‐Adoption Process Model | X | ≤ 12 months | ||||
| Wen 2012 | D and PA | Australia | NR | X | > 12 months | ||||
| Yilmaz 2015 | PA (screen time) | Turkey | Social Cognitive theory | X | X | ≤ 12 months | |||
| Zask 2012 | D and PA | Australia | NR | X | ≤ 12 months | ||||
| Study | Type | Country | Theory | Setting | |||||
| Childcare/ preschool | Primary/ secondary school | Health Service | Community | Home | Duration of intervention | ||||
| Amaro 2006 | D | Italy | NR | X | ≤ 12 months | ||||
| Baranowski 2003 | D and PA | USA | Social Cognitive Theory and Family Systems Theory | X | X | ≤ 12 months | |||
| Baranowski 2011 | D and PA | USA | Social Cognitive, Self‐determination, Persuasion Theories | X | ≤ 12 months | ||||
| Beech 2003 | D and PA | USA | Social Cognitive Theory and Family Systems Theory | X | ≤ 12 months | ||||
| Bohnert 2013 | D and PA | USA | Social Cognitive Theory and Sociocultural Theory | X | ≤ 12 months | ||||
| Brandstetter 2012 | D and PA | Germany | Social Cognitive Theory | X | X | ≤ 12 months | |||
| Branscum 2013 | D and PA | USA | Social Cognitive Theory | X | ≤ 12 months | ||||
| Brown 2013 | D and PA | USA | Transtheoretical Model‐Stages of Change, Social Cognitive Theory | X | X | ≤ 12 months | |||
| Caballero 2003 | D and PA | USA | Social Learning Theory | X | > 12 months | ||||
| Cao 2015 | D and PA | China | NR | X | X | > 12 months | |||
| Chen 2010 | D and PA | USA | Social Cognitive Theory | X | ≤ 12 months | ||||
| Coleman 2005 | D and PA | USA | NR | X | > 12 months | ||||
| Coleman 2012 | D | USA | Ecological and Developmental Systems Theories, Behavioural Ecological Models | X | > 12 months | ||||
| Cunha 2013 | D | Brazil | Transtheoretical Model | X | ≤ 12 months | ||||
| Damsgaard 2014 | D | Denmark | NR | X | ≤ 12 months | ||||
| De Heer 2011 | D and PA | USA | Ecological, Social Cognitive Theory | X | ≤ 12 months | ||||
| De Ruyter 2012 | D (drinks) | Netherlands | NR | X | > 12 months | ||||
| Donnelly 2009 | PA | USA | Environmental Model | X | > 12 months | ||||
| Elder 2014 | D and PA | USA | NR | X | > 12 months | ||||
| Epstein 2001 | D | USA | NR | X | ≤ 12 months | ||||
| Fairclough 2013 | D and PA | UK | Social Cognitive Theory | X | ≤ 12 months | ||||
| Foster 2008 | D and PA | USA | Settings‐based | X | > 12 months | ||||
| Fulkerson 2010 | D | USA | Social Cognitive Theory | X | X | ≤ 12 months | |||
| Gentile 2009 | D and PA | USA | Socio‐ecological theory | X | X | X | ≤ 12 months | ||
| Gortmaker 1999a | D and PA | USA | Social Cognitive Theory | X | > 12 months | ||||
| Grydeland 2014 | D and PA | Norway | Socioecological framework | X | > 12 months | ||||
| Gutin 2008 | PA | USA | Environmental change | X | > 12 months | ||||
| Habib‐Mourad 2014 | D and PA | Lebanon | Social Cognitive Theory | X | ≤ 12 months | ||||
| Haire‐Joshu 2010 | D and PA | USA | Social Cognitive Theory, Ecological Model | X | ≤ 12 months | ||||
| Han 2006 | D | China | NR | X | > 12 months | ||||
| HEALTHY Study Gp 2010 | D and PA | USA | NR | X | > 12 months | ||||
| Hendy 2011 | D and PA | USA | Social Cognitive Theory, Self‐determination Theory, Group Socialization Theory | X | ≤ 12 months | ||||
| Herscovici 2013 | D and PA | Argentina | NR | X | ≤ 12 months | ||||
| Howe 2011 | PA | USA | NR | X | ≤ 12 months | ||||
| James 2004 | D | UK | NR | X | ≤ 12 months | ||||
| Jansen 2011 | D and PA | USA | Theory of Planned Behaviour and Ecological Model | X | ≤ 12 months | ||||
| Johnston 2013 | D and PA | USA | NR | X | > 12 months | ||||
| Kain 2014 | D and PA | Chile | NR | X | ≤ 12 months | ||||
| Khan 2014 | PA | USA | NR | X | ≤ 12 months | ||||
| Kipping 2008 | D and PA | UK | Social Cognitive Theory and Behavioural C | X | ≤ 12 months | ||||
| Kipping 2014 | D and PA | UK | Social Cognitive Theory | X | ≤ 12 months | ||||
| Klesges 2010 | D and PA | USA | NR | X | > 12 months | ||||
| Kriemler 2010 | PA | Switzerland | Socio‐ecological Model | X | ≤ 12 months | ||||
| Lazaar 2007 | PA | France | NR | X | ≤ 12 months | ||||
| Levy 2012 | D and PA | Mexico | NR | X | ≤ 12 months | ||||
| Li 2010a | PA | China | NR | X | X | ≤ 12 months | |||
| Llargues 2012 | D and PA | Spain | Investigation, Vision, Action and Change Methodology | X | > 12 months | ||||
| Macias‐Cervantes 2009 | PA | Mexico | NR | X | X | ≤ 12 months | |||
| Madsen 2013 | PA | USA | NR | X | ≤ 12 months | ||||
| Magnusson 2012 | D and PA | Iceland | NR | X | > 12 months | ||||
| Marcus 2009 | D and PA | Sweden | NR | X | > 12 months | ||||
| Martinez‐Vizcaino 2014 | PA | Spain | Socio‐ecological model | X | ≤ 12 months | ||||
| Meng 2013 | D, D and PA, PA | China | NR | X | ≤ 12 months | ||||
| Morgan 2011 | D and PA | Australia | Social Cognitive Theory | X | ≤ 12 months | ||||
| Muckelbauer 2010 | D (water) | Germany | Theory of Planned Behaviour | X | ≤ 12 months | ||||
| Nollen 2014 | D and PA | USA | NR | X | ≤ 12 months | ||||
| Nyberg 2015 | D and PA | Sweden | Social Cognitive Theory | X | ≤ 12 months | ||||
| Paineau 2008 | D | France | NR | X | X | ≤ 12 months | |||
| Papadaki 2010 | D | Netherlands, Denmark, UK, Greece, Germany, Spain, Bulgaria, and Czech Republic | NR | X | ≤ 12 months | ||||
| Reed 2008 | PA | Canada | Socio‐ecological model | X | ≤ 12 months | ||||
| Robbins 2006 | PA | USA | Health Promotion Model and the Transtheoretical Model | X | X | ≤ 12 months | |||
| Robinson 2003 | D and PA | USA | Social Cognitive Theory | X | ≤ 12 months | ||||
| Robinson 2010 | PA | USA | Social Cognitive Model | X | > 12 months | ||||
| Rodearmel 2006 | D and PA | USA | NR | X | ≤ 12 months | ||||
| Rosario 2012 | D | Portugal | Health Promotion Model and Social Cognitive Theory | X | ≤ 12 months | ||||
| Rosenkranz 2010 | D and PA | USA | Social Cognitive Theory | X | ≤ 12 months | ||||
| Roth 2015 | PA | Germany | NR | X | ≤ 12 months | ||||
| Rush 2012 | D and PA | New Zealand | NR | X | > 12 months | ||||
| Safdie 2013 | D and PA x 2 | Mexico | Ecological principles, Theory of Planned Behaviour, Social Cognitive Theory, Health Belief Model | X | > 12 months | ||||
| Sahota 2001 | D and PA | UK | Multicomponent health promotion programme, based on the Health Promoting Schools concept | X | ≤ 12 months | ||||
| Sallis 1993 | PA | USA | Behaviour Change and Self‐management | X | > 12 months | ||||
| Salmon 2008 | PA | Australia | Social Cognitive Theory and Behavioural Choice Theory | X | ≤ 12 months | ||||
| Santos 2014 | D and PA | Canada | NR | X | ≤ 12 months | ||||
| Sevinc 2011 | D and PA vs D | Turkey | NR | X | ≤ 12 months | ||||
| Sichieri 2009 | D | Brazil | NR | X | ≤ 12 months | ||||
| Siegrist 2013 | D and PA | Germany | NR | X | ≤ 12 months | ||||
| Simon 2008 | PA | France | Behaviour Change and Socio‐ecological Model | X | > 12 months | ||||
| Spiegel 2006 | D and PA | USA | Theory of reasoned action, constructivism | X | ≤ 12 months | ||||
| Stolley 1997 | D and PA | USA | NR | X | ≤ 12 months | ||||
| Story 2003 | D and PA | USA | Social Cognitive Theory, Youth Development, and Resiliency | X | X | ≤ 12 months | |||
| Telford 2012 | PA | Australia | NR | X | > 12 months | ||||
| Thivel 2011 | PA | France | NR | X | ≤ 12 months | ||||
| Vizcaino 2008 | PA | Spain | NR | X | ≤ 12 months | ||||
| Wang 2012 | D and PA | China | NR | X | ≤ 12 months | ||||
| Warren 2003 | D and PA | England | Social Learning Theory | X | X | > 12 months | |||
| Williamson 2012 | D and PA | USA | Social Learning Theory | X | > 12 months | ||||
| Study | Type | Country | Theory | Setting | Duration of intervention | ||||
| Childcare/ preschool | Primary/ secondary school | Health Service | Community | Home | |||||
| Andrade 2014 | D and PA | Ecuador | Social Cognitive Theory, Information‐Motivation Behavioral Skills Model, Control Theory, Trans‐ theoretical Model, Theory of Planned Behavior | X | > 12 months | ||||
| Black 2010 | D and PA | USA | Social Cognitive Theory and Motivational Interviewing | X | X | ≤ 12 months | |||
| Bonsergent 2013 | D and PA | France | NR | X | X | X | > 12 months | ||
| Christiansen 2013 | PA | Denmark | Social Ecological framework | X | > 12 months | ||||
| Dewar 2013 | D and PA | Australia | Social Cognitive Theory | X | ≤ 12 months | ||||
| Ebbeling 2006 | D | USA | NR | X | ≤ 12 months | ||||
| El Ansarai 2010 | PA | Egypt | NR | X | ≤ 12 months | ||||
| Ezendam 2012 | D and PA | Netherlands | Theory of Planned Behavior, Precaution Adoption Process Model, Implementation Intentions | X | ≤ 12 months | ||||
| Farias 2015 | PA | Brazil | NR | X | ≤ 12 months | ||||
| French 2011 | D and PA | USA | NR | X | X | ≤ 12 months | |||
| Haerens 2006 | D and PA | Belgium | Theory of Planned Behaviours and Transtheoretical Model | X | > 12 months | ||||
| Lana 2014 | D and PA (online) | Mexico, Spain | Attitude, Social influence and Self‐Efficacy (ASE model) and Transtheoretical Model | X | ≤ 12 months | ||||
| Lubans 2011 | PA | Australia | Social Cognitive Theory | X | > 12 months | ||||
| Mauriello 2010 | D and PA | USA | Transtheoretical Model of Behavior Change | X | ≤ 12 months | ||||
| Melnyk 2013 | D and PA | USA | Cognitive Theory | X | ≤ 12 months | ||||
| Mihas 2010 | D | Greece | Social Learning Theory | X | ≤ 12 months | ||||
| Neumark‐Sztainer 2003 | D and PA | USA | Social Cognitive Theory | X | ≤ 12 months | ||||
| Neumark‐Sztainer 2010 | D and PA | USA | Social Cognitive Theory, Theory of Planned Behaviour | X | > 12 months | ||||
| Pate 2005 | PA | USA | Socio‐ecological model and Social Cognitive Theory | X | ≤ 12 months | ||||
| Patrick 2006 | D and PA | USA | Behavioural Determinants model, Social Cognitive Theory and Transtheoretical Model | X | X | ≤ 12 months | |||
| Peralta 2009 | D and PA | Australia | Social Cognitive Theory | X | ≤ 12 months | ||||
| Shin 2015 | D | USA | Social Cognitive Theory | X | ≤ 12 months | ||||
| Singh 2009 | D and PA | Netherlands | Behaviour Change and Environmental | X | > 12 months | ||||
| Smith 2014 | PA | Australia | Self‐determination Theory and Social Cognitive Theory | X | ≤ 12 months | ||||
| Velez 2010 | PA | USA | NR | X | ≤ 12 months | ||||
| Viggiano 2015 | D and PA (board game) | Italy | NR | X | ≤ 12 months | ||||
| Weeks 2012 | PA | Australia | NR | X | ≤ 12 months | ||||
| Whittemore 2013 | D and PA | USA | Theory of Interactive Technology, Social Learning Theory | X | X | ≤ 12 months | |||
| Wilksch 2015 | D and PA | Australia | NR | X | ≤ 12 months | ||||
| Footnotes D: diet; NR: not reported; PA: physical activity | |||||||||
| Study | Type | Control |
| D and PA | Waitlist | |
| D | No intervention | |
| D and PA | Usual care | |
| PA | Usual care | |
| D and PA | Day camp | |
| D and PA | Health‐related video games | |
| D and PA | School‐readiness programme | |
| 1. D and PA child‐targeted 2. D and PA parent‐targeted | Self‐esteem | |
| PA (plus diet) | Diet intervention only | |
| PA (screen time) | Safe media use | |
| D and PA | No intervention | |
| D and PA | No intervention | |
| D and PA | Waitlist | |
|
| No intervention | |
| D (bottle use) | No intervention | |
| PA | Waitlist | |
| D and PA | Usual care presumed as intervention integrated into school curriculum | |
| D and PA (theory‐based) | Knowledge‐based D and PA | |
| D and PA | Alcohol and drug comparison | |
| D and PA | Usual care presumed as no details but school‐based intervention | |
| D and PA | Newsletters on non‐obesity‐focused themes | |
| D and PA | No intervention | |
| D and PA | Waitlist | |
| D and PA | General health information related to nutrition, dental care, safety, skin care, and risk‐taking behaviours | |
| PA | Usual care | |
| D and PA | No intervention (financial incentive to participate) | |
| D | Usual care presumed as no details but school‐based intervention | |
| 1. D + PA family‐only 2. D + PA community‐only 3. D + PA family + community | No intervention | |
| D | No intervention | |
| D | Packed lunch from home | |
| D | Usual care | |
| D | Waitlist | |
| D and PA | Usual care presumed as no details but primarily school‐based intervention | |
| D and PA | Health workbooks and incentives | |
| D (drink) | Similar sugar‐containing drink in participants who commonly drank them | |
| PA | Standard care without PA recommendations | |
| PA | Health and safety programme | |
| D and PA | Usual care? presumed as no details but school‐based intervention | |
| PA | Usual care ‐ regular classroom instruction without physically active lessons | |
| D (drink) | Usual drink consumption | |
| PA (plus ‘normal’ exercise schedule provided by the school) | Usual care ‘normal’ exercise schedule provided by the school | |
| D and PA | No intervention – measurement only | |
| D (fruit + veg) | D (fat + sugar) | |
| D and PA | No intervention | |
| D and PA | Did not teach a specific unit focused on healthy eating and PA | |
| PA | Usual care physical activity at school | |
| D and PA (education only) | No intervention ‐ translated | |
| D and PA | General health intervention | |
| D and PA | General health intervention | |
| D and PA | General health intervention | |
| D and PA | No intervention | |
| D and PA | No intervention | |
| D | No intervention | |
| D and PA (plus community component) | Community component only | |
| D and PA | Usual care health curricula and PE classes | |
| D and PA | Usual care presumed as no details but school‐based intervention | |
| PA | No intervention presumed as no details (after‐school intervention) | |
| D and PA | Usual curriculum | |
| 1. D+PA parent 2. D+PA child alone | Usual care presumed as no details but school‐based intervention | |
| D and PA | Mailed materials focused on child development | |
| D and PA | Usual care | |
| D | Usual care presumed as no details but school‐based intervention ‐ translated | |
| D and PA (plus parenting support) | Parenting support but refrained from discussing child or parent eating and exercise behaviour | |
| D and PA | No intervention ‐ assessment only | |
| D and PA (token rewards) | Token rewards for three ‘‘Good Citizenship Behaviors.’’ | |
| D and PA | Usual care presumed as no details but school‐based intervention | |
| PA | No intervention and were not allowed to stay for the after‐school intervention but rather instructed not to change their daily after‐school routine | |
| D (drinks) | Usual care presumed as no details but school‐based intervention | |
| D and PA | Usual care curriculum | |
| D and PA | Self‐help | |
| D and PA | Usual care presumed as no details but school‐based intervention | |
| D and PA | No intervention – study translated in previous version of review | |
| PA | Maintain regular after‐school routine, financial incentive for measurements | |
| D and PA | Waitlist | |
| D and PA | Standard teaching | |
| D and PA | No intervention | |
| D and PA | Self‐esteem and social efficacy | |
| PA | Not informed of an intervention group | |
| 1. D and PA online only 2. D and PA online plus texts | No intervention presumed as no details | |
| PA | Usual care presumed as no details but school‐based intervention | |
| D and PA | Usual care presumed as no details but school‐based intervention | |
| PA | No intervention | |
| D and PA | Usual care presumed as no details but school‐based intervention | |
| PA | Waitlist | |
| PA | Maintain the same level of physical activity | |
| PA | No intervention presumed as no details | |
| D and PA (plus 2 x 40‐min PA + incentives) | 2 x 40‐min PA + incentives | |
| D and PA | Normal curriculum | |
| PA (plus 2 h/week of physical activity at low to moderate intensity) | Standard physical education curriculum (2 h/week of physical activity at low to moderate intensity) | |
| D and PA (multimedia) | No intervention | |
| D and PA | Attention control programme ‐ common health topics | |
| 1. D 2. PA 3. D and PA | No intervention | |
| D | Usual care presumed as no details but school‐based intervention | |
| PA | Usual care presumed as no details but school‐based intervention | |
| D and PA | Waitlist | |
| D (water) | No intervention | |
| D and PA | Attention control ‐ safety education curriculum | |
| D and PA | Regular kindergarten schedule | |
| D and PA | Regular physical education class and minimal intervention (written materials on healthy eating and physical activity at baseline) | |
| D and PA (plus all‐girls PE class during the first semester) | All‐girls PE class during the first semester then usual PE | |
| D and PA (screen time only, via mobile technology) | Same content in a written manual but no prompting | |
| D and PA | Waitlist | |
| D and PA (plus financial incentives) | Monthly newsletters emphasising pre‐reading skills plus financial incentives | |
| 1. reduce fat + increase complex carbohydrate 2. reduce both fat+sugar+increase complex carbohydrate | No advice | |
| 1. low protein /low glycaemic index 2. low protein/high glycaemic index 3. high protein/low glycaemic index 4. high protein/high glycaemic index | National dietary guidelines, with medium protein content and no specific instructions on glycaemic index | |
| PA (plus enrolled in PE) | Enrolled in PE classes | |
| D and PA (plus lottery tickets for small cash prizes) | Sun protection plus lottery tickets for small cash prizes | |
| 1. soothe/sleep 2. introduction to solids 3. combination | No intervention | |
| PA | Physical activity curriculum sessions | |
| D and PA | Regular school curriculum | |
| PA | Usual care | |
| PA | Usual care curriculum | |
| PA | Handout listing the PA recommendations | |
| D and PA | Active comparison ‐ health education programme to promote healthful diet and activity patterns via newsletters and delivering health education lectures | |
| PA | Information‐based health education | |
| D and PA | Maintain usual eating and step patterns (given step counter and logs same as intervention group) | |
| D | Usual care presumed as no details but school‐based intervention | |
| D and PA | No intervention presumed (Girl Scouts USA) | |
| PA | Usual care presumed, pre‐school setting | |
| D and PA | No additional resourcing or information | |
| 1. Basic D and PA 2. Basic D and PA plus financial investment and resources | No changes were made to existing nutrition or physical activity practices | |
| D and PA | Usual care presumed as no details but school‐based intervention | |
| PA | Usual care PE | |
| 1. Behaviour modification of PA 2. Fundamental movement skills 3. Combination | Usual care curriculum | |
| D and PA | Usual care regular curriculum | |
| 1. D 2. D and PA | Usual care presumed as no details but school‐based intervention | |
| D | No intervention | |
| D (drinks) | 2 x 1‐h general sessions on health issues and printed general advices regarding healthy diets | |
| D and PA | Usual care | |
| PA | Usual care school curriculum | |
| D and PA | Usual care regular curriculum | |
| D and PA | Waitlist | |
| D and PA | Waitlist | |
| PA | Waitlist and usual practice (i.e. regularly scheduled school sports and PE) | |
| D and PA | Data collection only | |
| D and PA | Attention placebo group | |
| D and PA | ‘‘active placebo,’’ non‐nutrition/PA condition, promoting self‐esteem and cultural enrichment | |
| D and PA | Usual care presumed as no details but school‐based intervention | |
| PA | Usual care, common practice PE | |
| PA | Not aware of the intervention in other schools | |
| PA | No intervention | |
| D and PA | No intervention presumed as no details | |
| D and PA (board game) | No intervention | |
| PA (plus standard PE curriculum (3 h/week of PA at low to moderate intensity) | Standard PE curriculum (3 h/week of PA at low to moderate intensity) | |
| D and PA | Usual care presumed as no details but school‐based intervention ‐ translated | |
| 1. D 2. PA 3. D and PA | Educational programme about food in a ‘non‐nutrition’ sense | |
| PA | Regular PE warm‐up | |
| D and PA (plus usual childhood nursing service from community health service nurses) | Usual childhood nursing service from community health service nurses plus health promotion material | |
| D and PA ‐ coping skills training (plus health education and behavioral support) | Health education and behavioral support | |
| 1. D and PA, 'Media Smart' 2. D and PA, 'Life Smart' 3. D and PA, 'Helping, Encouraging, Listening and Protecting Peers' | Usual school class | |
| 1. D and PA, primary prevention + environmental modification 2. D and PA, primary + secondary prevention with an added classroom and internet education component | No intervention | |
| PA (screen time) | Not aware of the intervention | |
| D and PA | Waitlist | |
| D: diet; PA: physical activity; PE: physical education | ||
| Age group | Source of funding | Was the writing of reports and research independent from industry | Source of funding was from food/nutrition or intervention industry | ||||
| Non‐industrya: number (%) | Not reported: number (%) | Not funded: number (%) | Industryb: number (%) | Industry and non‐industry: number (%) | |||
| 0‐5 | 28 (71.8) | 6 (15.4) | 0 (0) | 0 (0) | 5 (12.8) | 2/5 | 3/5c |
| 6‐12 | 69 (81.2) | 7 (8.2) | 0 (0) | 1 (2.4) | 7 (8.2) | 3/8 | 6/8d |
| 13‐18 | 26 (89.7) | 1 (3.4) | 2 (6.9) | 0 (0) | 2 (6.9) | 1/2 | 2/2e |
| aFunding from government organisations, not‐for‐profit organisations, charities etc. | |||||||
| Study name | Intervention type | Control | Adverse events (overall/any) | Sufficiency of infant weight gain | Injuries | Accidents | Infections |
| USA | D and PA Childcare 24 months N = 383 | General health intervention | No adverse events reported | ||||
| USA | D and PA Home 12 months N = 110 | No intervention | No Effect (< 5th percentile) | ||||
| Switzerland | D and PA Childcare Nil: end of intervention N = 652 | Regular school curriculum | No difference | No injuries occurred | |||
| Germany | D and PA Childcare 2‐4 months N = 709 | Usual care presumed, preschool setting | No difference | No difference | |||
| D: diet; PA: physical activity | |||||||
| Study name | Intervention type | Control | Adverse events (overall/any) | Number underweight/health of underweight children | Increased weight concern | Body satisfaction (body image) | Injuries | Depressive symptoms |
| USA | D and PA Community Nil: end of intervention I = 42 | Self‐esteem | Visit to healthcare provider | NR/NR | Unhealthy weight concern | Self‐perceived body shape and body shape dissatisfaction (Silhouettes) | C = 2 (11%) | NR |
| USA | D and PA School Nil: end of intervention I = 479 | No intervention | NR | No change in remission of underweight/NR | NR | Body dissatisfaction Eating Disorder Inventory MD = 0.14 (95% CI −0.73 to 0.45) | NR | NR |
| USA | D and PA I = 2307 | No intervention ‐ assessment only | < 3% adverse events, nearly similar between groups | NR/NR | NR | NR | NR | NR |
| China | PA 12 months I = 2092 | No intervention | NR | No effect on zBMI of underweight children | NR | NR | NR | NR |
| Spain | PA School I = 420 | Standard PE curriculum (2 h/week of PA at low to moderate intensity) | NR | NR/no difference in % underweight | NR | NR | Two minor ankle sprains risk 0.4% (group not specified) | NR |
| Sweden | PA School 6 months I =124 | Waitlist | NR | NR/NR | NR | NR | NR | NR |
| USA | PA Nil: end of intervention I = 107 | Active comparison ‐ health education programme to promote healthful diet and activity patterns via newsletters and delivering health education lectures | NR | NR/no change No difference in percent of underweight RR 1.11 (95% CI 0.3 to 4.0) | No effect Overconcern with | Self‐perceived body shape | NR | Children’s Depression Inventory |
| Germany | D and PA Nil: end of intervention I = 427 | Usual care | NR | Waist circumference of children < 10th centile for weight did not differ between the intervention and control group (P = 0.373)/NR | NR | NR | NR | NR |
| C: control; D: diet; I: intervention; MD: mean difference; NR: not reported; PA: physical activity; PE: physical education; RD: risk difference; RR: risk ratio; SE: standard error; zBMI: body‐mass index z score | ||||||||
| Study name | Intervention type | Control | Unhealthy weight control | Binge eating | Clinical levels of shape or weight concern | Body satisfaction (body image) | Self‐acceptance/self‐worth | Depressive symptoms | Anxiety |
| USA | D and PA School 6 months I = 358 | Attention control programme covering common health topics | NR | NR | NR | NR | NR | No effect: | No effect: P = 0.52 |
| USA | PA School 8 months I = 84 C = 106 | Regular PE class and minimal intervention (written materials on healthy eating and physical activity at baseline) | No difference | No difference Percent in past month I = 10.8%, n = 84; C = 19.3%, n = 106; P = 0.29 | NR | NR | No difference between groups (scale 5‐20; higher score is better) Self‐worth: mean I = 14.73, n=84; C = 14.16, n = 106; P = 0.33 | NR | NR |
| USA | PA School 5 months I = 182 | All‐girls PE class during the 1st semester then usual care PE | No difference | No difference Percent in past month I = 6.0%, n = 182; C = 11.4%, n = 174; ES = −5.41; P = 0.12* | NR | No difference | Different Improved self‐worth (Harter scale (scale 5‐20) | NR | NR |
| Australia | D and PA School 11 months I =347 | Usual school class | NR | NR | No differences between groups Girls: I = 28/65 (18%); C = 37/52 (19%) Boys: I = 2/100 (2%); C = 3/67 (2%) | NR | NR | NR | NR |
| C: control; D: diet; ES: Effect size Difference between intervention and control values at follow up*; I: intervention; MD: mean difference; NR: not reported; PA: physical activity; PE: physical education; RD: risk difference; RR: risk ratio; SE: standard error; zBMI: body‐mass index z score | |||||||||
| NR=Not reported ES Effect size* = Intervention effects are estimates that represent the difference in the outcome variable at post‐class or follow‐up in intervention condition compared to control condition, adjusted for age, race, and school as | |||||||||
| Age group | Outcome | Intervention type | ||||
| Dietary | Physical activity | Diet and physical activity | Total BMI | Total zBMI | ||
| 0‐5 years | BMI | 1 | 4 | 11 | 16 | |
| zBMI | 1 | 4 | 15 | 20 | ||
| 6‐12 years | BMI | 5 | 13 | 25 | 43 | |
| zBMI | 7 | 6 | 18 | 31 | ||
| 13‐18 years | BMI | 2 | 5 | 6 | 13 | |
| zBMI | 0 | 1 | 6 | 7 | ||
| Total | 72 | 58 | ||||
| BMI: body‐mass index; zBMI: body‐mass index z score | ||||||
| Children aged 0‐5 years | |||
| Setting | Intervention type | ||
| Diet | Physical activity | Diet and physical activity | |
| Home | |||
| Childcare | |||
| Healthcare | |||
| Wider community | |||
| School | ‐ | ‐ | ‐ |
| Count | 1 | 4 | 11 |
| BMI: body‐mass index | |||
| Children aged 6‐12 | |||
| Setting | Intervention type | ||
| Diet | Physical activity | Diet and physical activity | |
| Home | ‐ | ‐ | ‐ |
| Childcare | ‐ | ‐ | ‐ |
| Healthcare | ‐ | ‐ | ‐ |
| Wider community | |||
| School | |||
| Count | 5 | 13 | 25 |
| BMI: body‐mass index | |||
| Children aged 13‐18 years | |||
| Setting | Intervention type | ||
| Diet | Physical activity | Diet and physical activity | |
| Home | |||
| Childcare | ‐ | ‐ | ‐ |
| Healthcare | ‐ | ‐ | ‐ |
| Wider community | ‐ | ‐ | ‐ |
| School | |||
| Count | 2 | 5 | 6 |
| BMI: body‐mass index | |||
| Children aged 0‐5 years | |||
| Setting | Intervention type | ||
| Diet | Physical activity | Diet and physical activity | |
| Home | |||
| Childcare | |||
| Healthcare | |||
| Wider community | |||
| School | ‐ | ‐ | ‐ |
| Count | 1 | 4 | 15 |
| zBMI: body‐mass index z score | |||
| Children aged 6‐12 years | |||
| Setting | Intervention type | ||
| Diet | Physical activity | Diet and physical activity | |
| Home | |||
| Childcare | |||
| Healthcare | |||
| Wider community | |||
| School | |||
| Count | 7 | 6 | 18 |
| zBMI: body‐mass index z score | |||
| Children aged 13‐18 years | |||
| Setting | Intervention type | ||
| Diet | Physical activity | Diet and physical activity | |
| Home | ‐ | ‐ | |
| School | ‐ | ||
| Count | 0 | 1 | 6 |
| zBMI: body‐mass index z score | |||
| Outcome or subgroup title | No. of studies | No. of participants | Statistical method | Effect size |
| 1 zBMI Show forest plot | 1 | 520 | Mean Difference (Random, 95% CI) | ‐0.14 [‐0.32, 0.04] |
| Outcome or subgroup title | No. of studies | No. of participants | Statistical method | Effect size |
| 1 zBMI. Physical activity vs control ‐ setting Show forest plot | 4 | 1053 | Mean Difference (Random, 95% CI) | 0.01 [‐0.10, 0.13] |
| 1.1 Health system | 2 | 495 | Mean Difference (Random, 95% CI) | 0.02 [‐0.14, 0.17] |
| 1.2 Childcare/preschool | 2 | 558 | Mean Difference (Random, 95% CI) | 0.01 [‐0.17, 0.19] |
| 2 BMI. Physical activity vs control ‐ setting Show forest plot | 5 | 2233 | Mean Difference (Random, 95% CI) | ‐0.22 [‐0.44, 0.01] |
| 2.1 Health system | 1 | 143 | Mean Difference (Random, 95% CI) | ‐0.2 [‐0.59, 0.19] |
| 2.2 Childcare/preschool | 4 | 2090 | Mean Difference (Random, 95% CI) | ‐0.23 [‐0.50, 0.05] |
| Outcome or subgroup title | No. of studies | No. of participants | Statistical method | Effect size |
| 1 zBMI. Diet and physical activity vs control ‐ setting Show forest plot | 16 | 6261 | Mean Difference (Random, 95% CI) | ‐0.07 [‐0.14, ‐0.01] |
| 1.1 Childcare/preschool | 10 | 4913 | Mean Difference (Random, 95% CI) | ‐0.04 [‐0.09, 0.01] |
| 1.2 Health system | 1 | 121 | Mean Difference (Random, 95% CI) | ‐0.24 [‐0.46, ‐0.02] |
| 1.3 Wider community | 2 | 632 | Mean Difference (Random, 95% CI) | ‐0.02 [‐0.13, 0.09] |
| 1.4 Home | 3 | 595 | Mean Difference (Random, 95% CI) | ‐0.13 [‐0.35, 0.09] |
| 2 zBMI. Diet and physical activity vs control ‐ duration Show forest plot | 16 | 6261 | Mean Difference (Random, 95% CI) | ‐0.07 [‐0.14, ‐0.01] |
| 2.1 Duration of intervention ≤ 12 months | 13 | 4235 | Mean Difference (Random, 95% CI) | ‐0.09 [‐0.17, ‐0.01] |
| 2.2 Duration of intervention > 12 months | 3 | 2026 | Mean Difference (Random, 95% CI) | ‐0.02 [‐0.09, 0.06] |
| 3 BMI. Diet and physical activity vs control ‐ setting Show forest plot | 11 | 5536 | Mean Difference (Random, 95% CI) | ‐0.11 [‐0.21, ‐0.00] |
| 3.1 Home | 2 | 778 | Mean Difference (Random, 95% CI) | ‐0.33 [‐0.55, ‐0.10] |
| 3.2 Wider community | 1 | 75 | Mean Difference (Random, 95% CI) | ‐0.59 [‐0.94, ‐0.24] |
| 3.3 Childcare/preschool | 8 | 4683 | Mean Difference (Random, 95% CI) | ‐0.05 [‐0.14, 0.05] |
| 4 BMI. Diet and physical activity vs control ‐ duration Show forest plot | 11 | 5536 | Mean Difference (Random, 95% CI) | ‐0.11 [‐0.21, ‐0.00] |
| 4.1 Duration of intervention > 12 months | 1 | 667 | Mean Difference (Random, 95% CI) | ‐0.29 [‐0.56, ‐0.02] |
| 4.2 Duration of intervention ≤ 12 months | 10 | 4869 | Mean Difference (Random, 95% CI) | ‐0.09 [‐0.20, 0.01] |
| Outcome or subgroup title | No. of studies | No. of participants | Statistical method | Effect size |
| 1 zBMI ‐ setting Show forest plot | 9 | 7231 | Mean Difference (Random, 95% CI) | ‐0.03 [‐0.06, 0.01] |
| 1.1 School | 8 | 6771 | Mean Difference (Random, 95% CI) | ‐0.02 [‐0.06, 0.01] |
| 1.2 Wider community | 1 | 460 | Mean Difference (Random, 95% CI) | ‐0.16 [‐0.35, 0.04] |
| 2 BMI ‐ setting Show forest plot | 6 | 5061 | Mean Difference (Random, 95% CI) | ‐0.02 [‐0.11, 0.06] |
| 2.1 School | 5 | 4601 | Mean Difference (Random, 95% CI) | ‐0.02 [‐0.10, 0.07] |
| 2.2 Wider community | 1 | 460 | Mean Difference (Random, 95% CI) | ‐0.74 [‐1.68, 0.19] |
| Outcome or subgroup title | No. of studies | No. of participants | Statistical method | Effect size |
| 1 zBMI. Physical activity vs control ‐ setting Show forest plot | 7 | 6841 | Mean Difference (Random, 95% CI) | ‐0.02 [‐0.06, 0.02] |
| 1.1 Wider community | 2 | 481 | Mean Difference (Random, 95% CI) | ‐0.07 [‐0.19, 0.05] |
| 1.2 School | 5 | 6360 | Mean Difference (Random, 95% CI) | ‐0.03 [‐0.07, 0.00] |
| 2 zBMI. Physical activity vs control ‐ duration Show forest plot | 7 | 6841 | Mean Difference (Random, 95% CI) | ‐0.02 [‐0.06, 0.02] |
| 2.1 Duration of intervention ≤ 12 months | 2 | 995 | Mean Difference (Random, 95% CI) | 0.00 [‐0.09, 0.09] |
| 2.2 Duration of intervention > 12 months | 5 | 5846 | Mean Difference (Random, 95% CI) | ‐0.03 [‐0.08, 0.02] |
| 3 BMI. Physical activity vs control ‐ setting Show forest plot | 14 | 16410 | Mean Difference (Random, 95% CI) | ‐0.10 [‐0.14, ‐0.05] |
| 3.1 Wider community | 2 | 481 | Mean Difference (Random, 95% CI) | ‐0.19 [‐0.50, 0.12] |
| 3.2 School | 12 | 15929 | Mean Difference (Random, 95% CI) | ‐0.10 [‐0.14, ‐0.06] |
| 4 BMI. Physical activity vs control ‐ duration Show forest plot | 14 | 16410 | Mean Difference (Random, 95% CI) | ‐0.10 [‐0.14, ‐0.05] |
| 4.1 Duration of intervention ≤ 12 months | 11 | 13705 | Mean Difference (Random, 95% CI) | ‐0.11 [‐0.15, ‐0.06] |
| 4.2 Duration of intervention > 12 months | 3 | 2705 | Mean Difference (Random, 95% CI) | 0.00 [‐0.14, 0.14] |
| Outcome or subgroup title | No. of studies | No. of participants | Statistical method | Effect size |
| 1 zBMI. Diet and physical activity vs control ‐ setting Show forest plot | 20 | 24043 | Mean Difference (Random, 95% CI) | ‐0.05 [‐0.10, ‐0.01] |
| 1.1 Home | 1 | 134 | Mean Difference (Random, 95% CI) | 0.03 [‐0.04, 0.10] |
| 1.2 Wider community | 4 | 657 | Mean Difference (Random, 95% CI) | ‐0.04 [‐0.39, 0.31] |
| 1.3 School | 15 | 23252 | Mean Difference (Random, 95% CI) | ‐0.04 [‐0.08, ‐0.01] |
| 2 zBMI. Diet and physical activity vs control ‐ duration Show forest plot | 20 | 24043 | Mean Difference (Random, 95% CI) | ‐0.05 [‐0.10, ‐0.01] |
| 2.1 Duration of intervention > 12 months | 8 | 11779 | Mean Difference (Random, 95% CI) | ‐0.05 [‐0.10, 0.00] |
| 2.2 Duration of intervention ≤ 12 months | 12 | 12264 | Mean Difference (Random, 95% CI) | ‐0.06 [‐0.12, 0.01] |
| 3 BMI. Diet and physical activity vs control ‐ setting Show forest plot | 25 | 19498 | Mean Difference (Random, 95% CI) | ‐0.05 [‐0.11, 0.01] |
| 3.1 School | 16 | 18747 | Mean Difference (Random, 95% CI) | ‐0.04 [‐0.10, 0.02] |
| 3.2 Wider community | 9 | 751 | Mean Difference (Random, 95% CI) | ‐0.08 [‐0.29, 0.13] |
| 4 BMI. Diet and physical activity vs control ‐ duration Show forest plot | 25 | 19498 | Mean Difference (Random, 95% CI) | ‐0.05 [‐0.11, 0.01] |
| 4.1 Duration of intervention > 12 months | 8 | 5704 | Mean Difference (Random, 95% CI) | ‐0.08 [‐0.18, 0.03] |
| 4.2 Duration of intervention ≤ 12 months | 17 | 13794 | Mean Difference (Random, 95% CI) | ‐0.04 [‐0.11, 0.04] |
| Outcome or subgroup title | No. of studies | No. of participants | Statistical method | Effect size |
| 1 BMI ‐ setting Show forest plot | 2 | 294 | Mean Difference (Random, 95% CI) | ‐0.13 [‐0.50, 0.23] |
| 1.1 Home | 1 | 103 | Mean Difference (Random, 95% CI) | ‐0.14 [‐0.54, 0.26] |
| 1.2 School | 1 | 191 | Mean Difference (Random, 95% CI) | ‐0.1 [‐0.99, 0.79] |
| Outcome or subgroup title | No. of studies | No. of participants | Statistical method | Effect size |
| 1 zBMI ‐ setting Show forest plot | 1 | 100 | Mean Difference (Random, 95% CI) | ‐0.20 [‐0.30, ‐0.10] |
| 1.1 School | 1 | 100 | Mean Difference (Random, 95% CI) | ‐0.20 [‐0.30, ‐0.10] |
| 2 zBMI ‐ duration Show forest plot | 1 | 100 | Mean Difference (Random, 95% CI) | ‐0.20 [‐0.30, ‐0.10] |
| 2.1 Duration of intervention ≤ 12 months | 1 | 100 | Mean Difference (Random, 95% CI) | ‐0.20 [‐0.30, ‐0.10] |
| 3 BMI ‐ setting Show forest plot | 4 | 720 | Mean Difference (Random, 95% CI) | ‐1.53 [‐2.67, ‐0.39] |
| 3.1 School | 4 | 720 | Mean Difference (Random, 95% CI) | ‐1.53 [‐2.67, ‐0.39] |
| 4 BMI ‐ duration Show forest plot | 4 | 720 | Mean Difference (Random, 95% CI) | ‐1.53 [‐2.67, ‐0.39] |
| 4.1 Duration of intervention ≤ 12 months | 4 | 720 | Mean Difference (Random, 95% CI) | ‐1.53 [‐2.67, ‐0.39] |
| Outcome or subgroup title | No. of studies | No. of participants | Statistical method | Effect size |
| 1 zBMI ‐ setting Show forest plot | 6 | 16543 | Mean Difference (Random, 95% CI) | 0.01 [‐0.05, 0.07] |
| 1.1 Home | 1 | 75 | Mean Difference (Random, 95% CI) | 0.06 [‐0.13, 0.26] |
| 1.2 School | 5 | 16468 | Mean Difference (Random, 95% CI) | 0.00 [‐0.06, 0.06] |
| 2 zBMI ‐ duration Show forest plot | 6 | 16543 | Mean Difference (Random, 95% CI) | 0.01 [‐0.05, 0.07] |
| 2.1 Duration of intervention ≤ 12 months | 3 | 2525 | Mean Difference (Random, 95% CI) | ‐0.09 [‐0.18, 0.00] |
| 2.2 Duration of intervention > 12 months | 3 | 14018 | Mean Difference (Random, 95% CI) | 0.01 [‐0.02, 0.04] |
| 3 BMI ‐ setting Show forest plot | 8 | 16583 | Mean Difference (Random, 95% CI) | ‐0.02 [‐0.10, 0.05] |
| 3.1 School | 8 | 16583 | Mean Difference (Random, 95% CI) | ‐0.02 [‐0.10, 0.05] |
| 4 BMI ‐ duration Show forest plot | 8 | 16583 | Mean Difference (Random, 95% CI) | ‐0.02 [‐0.10, 0.05] |
| 4.1 Duration of intervention > 12 months | 2 | 12904 | Mean Difference (Random, 95% CI) | ‐0.04 [‐0.17, 0.09] |
| 4.2 Duration of intervention ≤ 12 months | 6 | 3679 | Mean Difference (Random, 95% CI) | ‐0.03 [‐0.11, 0.05] |
| Outcome or subgroup title | No. of studies | No. of participants | Statistical method | Effect size |
| 1 zBMI Show forest plot | 1 | 1205 | Mean Difference (Random, 95% CI) | ‐0.11 [‐0.62, 0.40] |
| 2 BMI Show forest plot | 2 | 4917 | Mean Difference (Random, 95% CI) | ‐0.03 [‐0.25, 0.20] |
| Outcome or subgroup title | No. of studies | No. of participants | Statistical method | Effect size |
| 1 zBMI Show forest plot | 1 | 3946 | Mean Difference (Random, 95% CI) | ‐0.16 [‐0.57, 0.25] |
| 2 BMI Show forest plot | 1 | 3946 | Mean Difference (Random, 95% CI) | ‐0.04 [‐1.05, 0.97] |
| Outcome or subgroup title | No. of studies | No. of participants | Statistical method | Effect size |
| 1 zBMI Show forest plot | 1 | 3971 | Mean Difference (Random, 95% CI) | 0.05 [‐0.38, 0.48] |
| 2 BMI Show forest plot | 1 | 3971 | Mean Difference (Random, 95% CI) | ‐0.28 [‐1.67, 1.11] |