Intervenciones para la prevención de la obesidad infantil
Resumen
Antecedentes
La prevención de la obesidad infantil es una prioridad de la salud pública internacional, debido al importante impacto de la obesidad en las enfermedades agudas y crónicas, la salud general, el desarrollo y el bienestar. La base de la evidencia internacional de las estrategias de prevención de la obesidad es muy amplia y aumenta rápidamente. Ésta es una actualización de una revisión anterior.
Objetivos
Determinar la efectividad de una serie de intervenciones que incluyen componentes dietéticos o de actividad física, o ambos, diseñadas para prevenir la obesidad en niños.
Métodos de búsqueda
Se hicieron búsquedas en CENTRAL, MEDLINE, Embase, PsychINFO y en CINAHL en junio de 2015. Se volvió a realizar la búsqueda desde junio de 2015 hasta enero de 2018 y se incluyó una búsqueda en registros de ensayos.
Criterios de selección
Ensayos controlados aleatorios (ECA) de intervenciones dietéticas o de actividad física, o intervenciones dietéticas y de actividad física combinadas, para la prevención del sobrepeso o la obesidad en niños (cero a 17 años) que informaron resultados a un mínimo de 12 semanas desde el inicio del estudio.
Obtención y análisis de los datos
Dos autores de la revisión, de forma independiente, extrajeron los datos, evaluaron el riesgo de sesgo y la calidad de la evidencia con los criterios GRADE. Se extrajeron datos sobre los resultados de adiposidad, las características sociodemográficas, los eventos adversos, el proceso de intervención y los costes. Se realizaron metanálisis de los datos según el Manual Cochrane para Revisiones Sistemáticas de Intervenciones (Cochrane Handbook for Systematic Reviews of Interventions) y se presentaron metanálisis separados por grupo etarios de los niños de cero a cinco años, de seis a 12 años y de 13 a 18 años de la puntuación z del IMC y del IMC.
Resultados principales
Se incluyeron 153 ECA, la mayoría realizados en EE.UU. o Europa. Trece estudios se realizaron en países de ingresos medios‐altos (PIMA: Brasil, Ecuador, Líbano, México, Tailandia, Turquía, la frontera entre Estados Unidos y México), y uno de ellos se realizó en un país de ingresos medios‐bajos (PIMB): Egipto). La mayoría (85) se centró en los niños de seis a 12 años.
Niños entre cero y cinco años: Existe evidencia de certeza moderada de 16 ECA (n = 6261) de que la dieta combinada con intervenciones de actividad física, en comparación con el control, redujo el IMC (diferencia de medias [DM] ‐0,07 kg/m2; intervalo de confianza [IC] del 95%: ‐0,14 a ‐0,01) y tuvo un efecto similar (11 ECA, n = 5536) sobre la puntuación z del IMC (DM ‐0,11; IC del 95%: ‐0,21 a 0,01). Ni las intervenciones dietéticas (evidencia de certeza moderada) ni las de actividad física solas (evidencia de certeza alta) en comparación con el control redujeron el IMC (actividad física sola): DM ‐0,22 kg/m2; IC del 95%: ‐0,44 a 0,01) ni la puntuación z del IMC (dieta sola: DM ‐0,14; IC del 95%: ‐0,32 a 0,04; actividad física sola: DM 0,01; IC del 95%: ‐0,10 a 0,13) en los niños de cero a cinco años.
Niños entre seis y 12 años de edad: Existe evidencia de certeza moderada de 14 ECA (n = 16 410) de que las intervenciones de actividad física, en comparación con el control, redujeron el IMC (DM ‐0,10 kg/m2; IC del 95%: ‐0,14 a ‐0,05). Sin embargo, hay evidencia de certeza moderada de que tuvieron poco o ningún efecto sobre la puntuación z del IMC (DM ‐0,02; IC del 95%: ‐0,06 a 0,02). Existe evidencia de certeza baja de 20 ECA (n = 24 043) de que la dieta combinada con intervenciones de actividad física, en comparación con el control, redujo la puntuación z del IMC (DM ‐0,05 kg/m2; IC del 95%: ‐0,10 a ‐0,01). Existe evidencia de certeza alta de que las intervenciones dietéticas, en comparación con el control, tuvieron poca repercusión sobre la puntuación z del IMC (DM ‐0,03; IC del 95%: ‐0,06 a 0,01) o el IMC (‐0,02 kg/m2; IC del 95%: ‐0,11 a 0,06).
Niños entre 13 y 18 años de edad: Existe evidencia de certeza muy baja de que las intervenciones de actividad física, en comparación con el control, redujeron el IMC (DM ‐1,53 kg/m2; IC del 95%: ‐2,67 a ‐0,39; cuatro ECA; n = 720) y evidencia de certeza baja de una reducción en la puntuación z del IMC (DM ‐0,2; IC del 95%: ‐0,3 a ‐0,1; un ECA; n = 100). Existe evidencia de certeza baja de ocho ECA (n = 16 583) de que la dieta combinada con intervenciones de actividad física, en comparación con el control, no tuvo efectos sobre el IMC (DM ‐0,02 kg/m2; IC del 95%: ‐0,10 a 0,05) ni la puntuación z del IMC (DM 0,01; IC del 95%: ‐0,05 a 0,07; 6 ECA; n = 16 543). La evidencia obtenida a partir de dos ECA (evidencia de certeza baja; n = 294) no encontró efectos de las intervenciones dietéticas sobre el IMC.
Comparaciones directas de las intervenciones: Dos ECA proporcionaron datos que compararon directamente la dieta con la actividad física o la dieta combinada con intervenciones de actividad física en niños de seis a 12 años de edad y no informaron de diferencias.
Se observó heterogeneidad en los resultados de los tres grupos etarios, que no se pudo explicar por completo por el contexto o la duración de las intervenciones. Cuando se informaron, las intervenciones no parecieron provocar efectos adversos (16 ECA) o aumentar las desigualdades en materia de salud (género): 30 ECA; nivel socioeconómico: 18 ECA), aunque relativamente pocos estudios examinaron estos factores.
La repetición de las búsquedas en enero de 2018 identificó 315 registros con relevancia potencial para esta revisión, que se resumirán en la próxima actualización.
Conclusiones de los autores
Las intervenciones que incluyen dieta combinada con intervenciones de actividad física pueden reducir el riesgo de obesidad (puntuación z del IMC y IMC) en los niños pequeños de cero a cinco años. Existe evidencia de calidad más baja a partir de un único estudio de que las intervenciones dietéticas pueden ser beneficiosas.
Sin embargo, las intervenciones que se centran solo en la actividad física no parecen ser efectivas en los niños de esta edad. Por el contrario, las intervenciones que solo se centran en la actividad física pueden reducir el riesgo de obesidad (IMC) en los niños de seis a 12 años y en los adolescentes de 13 a 18 años. En estos grupos etarios no hay evidencia de que las intervenciones que solo se centran en la dieta sean efectivas, y hay alguna evidencia de que la dieta combinada con intervenciones de actividad física puede ser efectiva. Es importante destacar que esta revisión actualizada también indica que las intervenciones para prevenir la obesidad infantil no parecen producir efectos adversos ni desigualdades en términos de salud.
La revisión no se actualizará en su forma actual. Para controlar el aumento de los ECA de intervenciones de prevención de la obesidad infantil, en el futuro, esta revisión se dividirá en tres revisiones separadas según la edad del niño.
PICO
Resumen en términos sencillos
¿Las estrategias de dieta y actividad física ayudan a prevenir la obesidad en los niños (0 a 18 años)?
Antecedentes
A nivel mundial, cada vez más niños presentan sobrepeso y obesidad. El sobrepeso en la infancia puede causar problemas de salud y los niños pueden verse afectados psicológicamente y en su vida social. Es probable que los niños con sobrepeso también tengan sobrepeso cuando sean adultos y continúen presentando a una salud física y mental deficientes.
Búsqueda de estudios
Se realizaron búsquedas en muchas bases de datos científicas para encontrar estudios que analizaran las formas de prevenir la obesidad infantil. Se incluyeron los estudios dirigidos a niños de todas las edades. Los estudios solo se incluyeron si los métodos que utilizaron tenían como objetivo cambiar la dieta de los niños, su nivel de actividad física o ambos. Solo se buscaron los estudios que contenían la mejor información para responder a esta pregunta, los "ensayos controlados aleatorios" o ECA.
Datos encontrados
Se encontraron 153 ECA. Los estudios se realizaron principalmente en países de ingresos altos como los EE.UU. y países europeos, aunque el 12% se realizó en países de ingresos medios (Brasil, Ecuador, Egipto, Líbano, México, Tailandia y Turquía). Poco más de la mitad de los ECA (56%) probaron estrategias para cambiar la dieta o los niveles de actividad en niños de seis a 12 años, una cuarta parte fueron en niños de cero a cinco años y una quinta parte (20%) en adolescentes de 13 a 18 años. Las estrategias se utilizaron en diferentes contextos, como el domicilio, el preescolar o la escuela, y la mayoría de ellas estaban dirigidas a tratar de cambiar el comportamiento individual.
¿Estas estrategias funcionaron?
Una forma muy aceptada de evaluar si un niño tiene sobrepeso es calcular una puntuación basada en su estatura y su peso, y relacionarla con el peso y la estatura de muchos niños de su edad en su país. A esta puntuación se le denomina puntuación z del IMC. Se encontraron 61 ECA con más de 60 000 niños que informaron puntuaciones z del IMC. Los niños de cero a cinco años y los niños de seis a 12 años que recibieron ayuda con una estrategia para cambiar su dieta o sus niveles de actividad redujeron su puntuación z del IMC en 0,07 y 0,04 unidades respectivamente en comparación con los niños a los que no se les proporcionó una estrategia. Este hecho significa que estos niños pudieron reducir su peso. Este cambio en la puntuación z del IMC, cuando se proporciona a muchos niños de toda una población, es útil para que los gobiernos traten de enfrentar los problemas de obesidad infantil. Las estrategias para cambiar la dieta o la actividad física, o ambas, administradas a adolescentes y adultos jóvenes de 13 a 18 años de edad, no redujeron de forma exitosa la puntuación z del IMC.
Se intentó determinar si las estrategias podían funcionar de manera equitativa en todos los niños, por ejemplo, niñas y niños, niños de ámbitos ricos o menos ricos y niños de orígenes raciales diferentes. No hubo muchos ECA que informaran sobre lo anterior, pero en los que lo hicieron, no hubo indicios de que las estrategias aumentaran las desigualdades. Sin embargo, no fue posible encontrar suficientes ECA con esta información que permitieran responder esta pregunta. También se intentó determinar si los niños se veían perjudicados por alguna de las estrategias, por ejemplo, presentaran lesiones, perdieran demasiado peso o desarrollaran puntos de vista perjudiciales sobre sí mismos y su peso. No hubo muchos ECA que informaran sobre lo anterior, pero de los que lo hicieron, ninguno informó de daños en los niños a los que se les habían proporcionado estrategias para cambiar su dieta o su actividad física.
Se analizó qué tan bien se realizaron los ECA para ver si podían estar sesgados. Se decidió disminuir la calidad de alguna información sobre la base de estas evaluaciones. La calidad de la evidencia fue "moderada" en los niños de cero a cinco años de edad para la puntuación z del IMC, "baja" para los niños de seis a 12 años y moderada en los adolescentes (13 a 18 años).
Conclusiones
Las estrategias para cambiar la dieta o los niveles de actividad, o ambos, de los niños, con el objetivo de ayudar a prevenir el sobrepeso o la obesidad, son efectivas para realizar reducciones modestas en la puntuación z del IMC en los niños de cero a cinco años y en los niños de seis a 12 años. Esta información puede ser útil para los padres y los niños preocupados por el sobrepeso. También puede ser útil para los gobiernos, que intentan hacer frente a una tendencia creciente de niños que presentan obesidad o sobrepeso. Se encontró menos evidencia de los adolescentes y los jóvenes de 13 a 18 años, y las estrategias que se les proporcionaron no redujeron la puntuación z del IMC.
Conclusiones de los autores
Summary of findings
| Dietary interventions compared to control for preventing obesity in children aged 0 to 5 years | |||||
| Patient or population: children aged 0‐5 years | |||||
| Outcomes | Anticipated absolute effects* (95% CI) | № of participants | Certainty of the evidence | Comments | |
| Risk with control | Risk with dietary interventions | ||||
| Body‐mass index z score (zBMI) | The mean zBMI was 0.75 | MD 0.14 lower (0.32 lower to 0.04 higher) | 520 | ⊕⊕⊕⊝ | Dietary interventions likely result in little to no difference in zBMI |
| *The risk in the intervention group (and its 95% confidence interval) is based on the assumed risk in the comparison group and the relative effect of the intervention (and its 95% CI). | |||||
| GRADE Working Group grades of evidence | |||||
| 1Risk of bias: there is only one study and it has one domain (incomplete outcome data) rated as high risk of bias, with 22% of participants dropping out of the study. | |||||
| Physical activity interventions compared to control for preventing obesity in children aged 0 to 5 years | |||||
| Patient or population: children aged 0‐5 years | |||||
| Outcomes | Anticipated absolute effects* (95% CI) | № of participants | Certainty of the evidence | Comments | |
| Risk with control | Risk with physical activity interventions | ||||
| Body‐mass index (BMI) | The mean BMI ranged from 15.94 to 16.4 kg/m2 | MD 0.22 kg/m2 lower | 2233 | ⊕⊕⊕⊕ | Physical activity interventions likely do not reduce BMI |
| Body‐mass index z score (zBMI) | The mean zBMI ranged from −0.15 to −0.22 | MD 0.01 higher | 1053 | ⊕⊕⊕⊕ | Physical activity interventions likely do not reduce zBMI |
| *The risk in the intervention group (and its 95% confidence interval) is based on the assumed risk in the comparison group and the relative effect of the intervention (and its 95% CI). | |||||
| GRADE Working Group grades of evidence | |||||
| Diet and physical activity interventions combined compared to control for preventing obesity in children age 0‐5 years | |||||
| Patient or population: children aged 0‐5 years | |||||
| Outcomes | Anticipated absolute effects* (95% CI) | № of participants | Certainty of the evidence | Comments | |
| Risk with control | Risk with diet and physical activity interventions | ||||
| Body‐mass index z score (zBMI) | The mean zBMI ranged from 0.15 to 0.98 | MD 0.07 lower (0.14 lower to 0.01 lower) | 6261 | ⊕⊕⊕⊝ | Diet and physical activity interventions potentially slightly reduce zBMI |
| Body‐mass index (BMI) | The mean BMI ranged from 15.8 to 17.62 kg/m2 | MD −0.11 kg/m2 lower | 5536 | ⊕⊕⊕⊝ | Diet and physical activity interventions likely result in little to no difference in BMI |
| *The risk in the intervention group (and its 95% confidence interval) is based on the assumed risk in the comparison group and the relative effect of the intervention (and its 95% CI). | |||||
| GRADE Working Group grades of evidence | |||||
| 1Heterogeneity of this analysis as measured with I2 statistic was 66%, and therefore at high risk of bias. | |||||
| Adverse event outcomes for dietary combined with physical activity interventions compared to control for preventing obesity in children aged 0 to 5 years | |||
| Patient or population: children aged 0 to 5 years | |||
| Outcomes | Impact | № of participants | Certainty of the evidence |
| Insufficient weight gain in infants | One study of an infant feeding intervention. There was no difference in numbers of infants with weight < 5th percentile between intervention and control groups nor in the numbers of children dropping by 2 major centiles between year 1 and year 2, but this was just 80 participants. | 110 | ⊕⊝⊝⊝ |
| Physical injuries | No effect of intervention on numbers of physical injuries reported in the control and intervention arms | 652 | ⊕⊕⊝⊝ |
| Adverse events | No 'adverse events' reported | 983 | ⊕⊕⊝⊝ |
| Infections | No effect of intervention on numbers of reported infections. These data are very uncertain. A single study of just 41 participants found similar numbers of (parent‐reported) infections in children in the intervention and control groups. | 709 | ⊕⊕⊝⊝ |
| Accidents | No effect on number of accidents. These data are very uncertain. A single study of just 41 participants found similar numbers of (parent‐reported) accidents in children in the intervention and control groups. | 42 | ⊕⊝⊝⊝ |
| RCT: randomised controlled trial | |||
| GRADE Working Group grades of evidence | |||
| 1Downgraded three times. Twice for imprecision, as evidence based on just one study with only 110 participants. Downloaded once for risk of bias as we judged three domains at high risk of bias and two unclear from a total of six items. | |||
| Dietary interventions compared to control for preventing obesity in children aged 6 to 12 years | |||||
| Patient or population: children aged 6‐12 years | |||||
| Outcomes | Anticipated absolute effects* (95% CI) | № of participants | Certainty of the evidence | Comments | |
| Risk with control | Risk with dietary interventions | ||||
| Body‐mass index z score (zBMI) | The mean zBMI ranged from 0.09 to 0.41 | MD 0.03 lower (0.06 lower to 0.01 higher) | 7231 | ⊕⊕⊕⊕ | Dietary interventions alone do not reduce zBMI |
| Body‐mass index (BMI) | The mean BMI ranged from 17.9 to 25.1 kg/m2 | MD 0.02 kg/m2 lower (0.11 lower to 0.06 higher) | 5061 | ⊕⊕⊕⊕ | Dietary interventions alone do not reduce BMI |
| *The risk in the intervention group (and its 95% confidence interval) is based on the assumed risk in the comparison group and the relative effect of the intervention (and its 95% CI). | |||||
| GRADE Working Group grades of evidence | |||||
| Physical activity interventions compared to control for preventing obesity in children aged 6 to 12 years | |||||
| Patient or population: children aged 6‐12 years | |||||
| Outcomes | Anticipated absolute effects* (95% CI) | № of participants | Certainty of the evidence | Comments | |
| Risk with control | Risk with physical activity interventions | ||||
| Body‐mass index z score (zBMI) | The mean zBMI ranged from 0.09 to 1.75 | MD 0.02 lower (0.06 lower to 0.02 higher) | 6841 | ⊕⊕⊕⊝ | Physical activity interventions likely result in little to no difference in zBMI. Physical activity vs control ‐ setting |
| Body‐mass index (BMI) | The mean BMI ranged from 15.7 to 20.41 kg/m2 | MD 0.1 kg/m2 lower | 16,410 | ⊕⊕⊕⊝ | Physical activity interventions likely reduce BMI |
| *The risk in the intervention group (and its 95% confidence interval) is based on the assumed risk in the comparison group and the relative effect of the intervention (and its 95% CI). | |||||
| GRADE Working Group grades of evidence | |||||
| 1Four of seven studies have at least one domain judged to be high risk of bias. In addition removal of these studies substantially changes the effect of having an intervention, from no effect to there being a positive effect of the intervention. | |||||
| Adverse event outcomes for physical activity interventions compared to control for preventing obesity in children aged 6 to 12 years | |||
| Patient or population: children aged 6‐12 years | |||
| Outcomes | Impact | № of participants | Certainty of the evidence |
| Physical injuries | No effect on numbers of children with physical injuries in the control and intervention arms | 912 | ⊕⊕⊝⊝ |
| Underweight | No effect on number (proportion) of children designated as underweight | 5266 | ⊕⊕⊕⊕ |
| Depression | Depression was reduced in children in the intervention group (MD −0.21, 95% CI −0.42 to −0.001) | 225 | ⊕⊕⊝⊝ |
| Body satisfaction | No effect of intervention on reported body satisfaction at the end of the intervention | 225 | ⊕⊕⊝⊝ |
| Increased weight concerns | No effect of intervention on reported body satisfaction at the end of the intervention | 225 | ⊕⊕⊝⊝ |
| CI: confidence interval; MD: mean difference; RCT: randomised controlled trial | |||
| GRADE Working Group grades of evidence | |||
| 1Downgraded for risk of bias because this study has one domain at high risk of bias. Downgraded for imprecision because only one of 22 studies reported this outcome. | |||
| Diet and physical activity interventions combined compared to control for preventing obesity in children aged 6 to 12 years | |||||
| Patient or population: children aged 6‐12 years | |||||
| Outcomes | Anticipated absolute effects* (95% CI) | № of participants | Certainty of the evidence | Comments | |
| Risk with control | Risk with diet and physical activity interventions | ||||
| Body‐mass index z score (zBMI) | The mean zBMI ranged from 0.05 to 0.9 | MD 0.05 lower (0.10 lower to 0.01 lower) | 24,043 | ⊕⊕⊝⊝ | Diet and physical activity interventions combined may reduce zBMI slightly |
| Body‐mass index (BMI) | The mean BMI ranged from 17.57 to 24.8 kg/m2 | MD 0.05 kg/m2 lower (0.11 lower to 0.01 higher) | 19,498 | ⊕⊕⊝⊝ | Diet and physical activity interventions combined may result in little to no difference in BMI |
| *The risk in the intervention group (and its 95% confidence interval) is based on the assumed risk in the comparison group and the relative effect of the intervention (and its 95% CI). | |||||
| GRADE Working Group grades of evidence | |||||
| 1Heterogeneity was very high with an I2 statistic of 87%. | |||||
| Adverse event outcomes for dietary combined with physical activity interventions compared to control for preventing obesity in children aged 6 to 12 years | |||
| Patient or population: children aged 6 to 12 years | |||
| Outcomes | Impact | № of participants | Certainty of the evidence |
| Underweight | No effect on number (proportion) of children designated as underweight | 784 | ⊕⊕⊕⊝ |
| Depression | Depression was reduced in children in the intervention group (MD −0.21, 95% CI −0.42 to −0.001) Baseline depression score of the control group was 2.09 (SD 2.74) | 225 | ⊕⊕⊝⊝ |
| Increased weight concern | No effect of the intervention on concern about weight | 285 | ⊕⊕⊕⊕ |
| Body satisfaction | No effect of intervention (diet and physical activity) on reported body satisfaction at the end of the intervention | 1128 | ⊕⊕⊕⊕ |
| Visits to a healthcare provider | Visits to a healthcare provider were similar in the intervention and control groups; N = 1 in intervention and N = 2 in control | 60 | ⊕⊕⊝⊝ |
| Adverse events related to taking of blood samples | < 3%, similar numbers in the intervention (1.6%) and control (1.7%) groups (RD 0.00, 95% CI −0.01 to 0.01) | 4603 | ⊕⊕⊕⊝ |
| Underweight | Waist circumference of children < 10th centile for weight did not differ between the intervention and control group (P = 0.373) | 724 | ⊕⊕⊕⊝ |
| Injuries | Similar numbers of children were reported with injuries in the intervention (11%, N = 2) and control (4.7%, N = 1) groups | 60 | ⊕⊕⊝⊝ |
| *The risk in the intervention group (and its 95% confidence interval) is based on the assumed risk in the comparison group and the relative effect of the intervention (and its 95% CI). | |||
| GRADE Working Group grades of evidence | |||
| 1Downgraded for risk of bias because one of the studies had an outcome rated as high risk of bias. | |||
| Diet interventions compared to control for preventing obesity in children aged 13 to 18 years | |||||
| Patient or population: children aged 13‐18 years | |||||
| Outcomes | Anticipated absolute effects* (95% CI) | № of participants | Certainty of the evidence | Comments | |
| Risk with control | Risk with diet interventions | ||||
| Body‐mass index (BMI) | The mean BMI was 24.8 kg/m2 | MD 0.13 kg/m2 lower (0.50 lower to 0.23 higher) | 294 | ⊕⊕⊝⊝ | Diet interventions may result in little to no difference in BMI |
| *The risk in the intervention group (and its 95% confidence interval) is based on the assumed risk in the comparison group and the relative effect of the intervention (and its 95% CI). | |||||
| GRADE Working Group grades of evidence | |||||
| 1There are two studies and one has two domains at high risk of bias. | |||||
| Physical activity interventions compared to control for preventing obesity in children aged 13 to 18 years | |||||
| Patient or population: children aged 13‐18 years | |||||
| Outcomes | Anticipated absolute effects* (95% CI) | № of participants | Certainty of the evidence | Comments | |
| Risk with control | Risk with physical activity interventions | ||||
| Body‐mass index z score (zBMI) | The mean zBMI was 0.21 to 0.81 | MD 0.2 lower (0.3 lower to 0.1 lower) | 100 | ⊕⊕⊝⊝ | The evidence suggests physical activity interventions reduce zBMI |
| Body‐mass index (BMI) | The mean BMI was 20.4 to 26.65 kg/m2 | MD 1.53 kg/m2 lower | 720 | ⊕⊝⊝⊝ | The evidence is very uncertain about the effect of physical activity interventions on BMI |
| *The risk in the intervention group (and its 95% confidence interval) is based on the assumed risk in the comparison group and the relative effect of the intervention (and its 95% CI). | |||||
| GRADE Working Group grades of evidence | |||||
| 1One study with only 100 participants. | |||||
| Adverse event outcomes for physical activity interventions compared to control for preventing obesity in children age 13 to 18 years | |||
| Patient or population: children aged 13‐18 years | |||
| Outcomes | Impact | № of participants | Certainty of the evidence |
| Body satisfaction | No effect of intervention on reported body satisfaction at the end of the intervention | 190 | ⊕⊕⊝⊝ |
| Unhealthy weight gain | No effect of intervention on unhealthy gains in weight | 546 | ⊕⊕⊕⊝ |
| Self‐acceptance/self‐worth | One study (N = 190) reported no effect of intervention on self‐acceptance. A second CRt of the same intervention reported improved self‐worth in those children who received the intervention | 546 | ⊕⊕⊕⊝ |
| Binge eating | No effect of intervention on binge eating | 556 | ⊕⊕⊕⊝ |
| RCT: randomised controlled trial | |||
| GRADE Working Group grades of evidence | |||
| 1Downgraded as this study has two domains at high risk of bias. | |||
| Diet and physical activity interventions combined compared to control for preventing obesity in children aged 13 to 18 years | |||||
| Patient or population: children aged 13‐18 years | |||||
| Outcomes | Anticipated absolute effects* (95% CI) | № of participants | Certainty of the evidence | Comments | |
| Risk with control | Risk with diet and physical activity interventions combined | ||||
| Body‐mass index z score (zBMI) | The mean zBMI ranged from 0.21 to 0.81 | MD 0.01 higher (0.05 lower to 0.07 higher) | 16,543 | ⊕⊕⊝⊝ | Combined diet and physical activity interventions may result in little to no difference in zBMI |
| Body‐mass index (BMI) | The mean BMI ranged from 18.99 to 24.57 kg/m2 | MD 0.02 kg/m2 lower (0.1 lower to 0.05 higher) | 16,583 | ⊕⊕⊝⊝ | Combined diet and physical activity interventions may result in little to no difference in BMI |
| *The risk in the intervention group (and its 95% confidence interval) is based on the assumed risk in the comparison group and the relative effect of the intervention (and its 95% CI). | |||||
| GRADE Working Group grades of evidence | |||||
| 1Heterogeneity is very high, measured at 92% with I2 statistic. | |||||
| Adverse events outcomes for dietary combined with physical activity interventions compared to control for preventing obesity in children aged13 to 18 years | |||
| Patient or population: children aged 13‐18 years | |||
| Outcomes | Impact | № of participants | Certainty of the evidence |
| Depression | No effects of the intervention on depression | 779 | ⊕⊕⊕⊕ |
| Clinical levels of shape and weight concern | No effect of intervention on clinical numbers of shape or weight concern | 282 | ⊕⊕⊝⊝ |
| Anxiety | No effect of the intervention on anxiety | 779 | ⊕⊕⊕⊕ |
| RCT: randomised controlled trial | |||
| GRADE Working Group grades of evidence | |||
| 1Downgraded for risk of bias because these data appear to be from a post hoc subgroup analysis. | |||
| Dietary interventions compared to physical activity interventions for preventing obesity in children aged 6 to 12 years | |||||
| Patient or population: children aged 6‐12 years | |||||
| Outcomes | Anticipated absolute effects* (95% CI) | № of participants | Certainty of the evidence | Comments | |
| Risk with physical activity interventions | Risk with dietary intervention | ||||
| Body‐mass index (BMI) | The mean BMI ranged from 17.4 to 18.8 kg/m2 | MD 0.03 kg/m2 lower (0.25 lower to 0.2 higher) | 4917 | ⊕⊕⊕⊕ | Dietary interventions result in little to no difference in BMI compared to physical activity interventions when delivered in schools to children aged 6‐12 years |
| Body‐mass index z score (zBMI) | The mean zBMI was 0.2 | MD 0.11 lower | 1205 | ⊕⊕⊕⊕ | 'Dietary interventions' results in little to no difference in zBMI compared to physical activity interventions when delivered in schools to children aged 6‐12 years |
| *The risk in the intervention group (and its 95% confidence interval) is based on the assumed risk in the comparison group and the relative effect of the intervention (and its 95% CI). | |||||
| GRADE Working Group grades of evidence | |||||
| Diet and physical activity interventions combined compared to physical activity interventions alone for preventing obesity in children aged 6 to 12 years | |||||
| Patient or population: children aged 6‐12 years | |||||
| Outcomes | Anticipated absolute effects* (95% CI) | № of participants | Certainty of the evidence | Comments | |
| Risk with physical activity interventions | Risk with diet and physical activity interventions combined | ||||
| Body‐mass index (BMI) | The mean BMI was 17.7 kg/m2 | MD 0.04 kg/m2 lower (1.05 lower to 0.97 higher) | 3946 | ⊕⊕⊕⊕ | Combined dietary and physical activity interventions result in little to no difference in BMI compared to physical activity interventions when delivered in schools to children aged 6‐12 years |
| Body‐mass index z score (zBMI) | The mean zBMI was 0.15 | MD 0.16 lower (0.57 lower to 0.25 higher) | 3946 | ⊕⊕⊕⊕ | Combined dietary and physical activity intrventions result in little to no difference in zBMI compared to physical activity interventions when delivered in schools to children aged 6‐12 years |
| *The risk in the intervention group (and its 95% confidence interval) is based on the assumed risk in the comparison group and the relative effect of the intervention (and its 95% CI). | |||||
| GRADE Working Group grades of evidence | |||||
| Dietary interventions alone compared to diet and physical activity interventions combined for preventing obesity in children aged 6 to 12 years | |||||
| Patient or population: children aged 6‐12 years | |||||
| Outcomes | Anticipated absolute effects* (95% CI) | № of participants | Certainty of the evidence | Comments | |
| Risk with diet and physical activity interventions combined | Risk with dietary intervention | ||||
| Body‐mass index (BMI) | The mean BMI was 17.4 kg/m2 | MD 0.28 kg/m2 lower (1.67 lower to 1.11 higher) | 3971 | ⊕⊕⊕⊕ | Dietary interventions alone result in little to no difference in BMI compared to diet and physical activity interventions combined when delivered in schools to children aged 6‐12 years |
| Body‐mass index z score (zBMI) | The mean zBMI was 0.2 | MD 0.05 higher (0.38 lower to 0.48 higher) | 3971 | ⊕⊕⊕⊕ | Dietary interventions alone result in little to no difference in zBMI compared to diet and physical activity interventions combined when delivered in schools to children aged 6‐12 years |
| *The risk in the intervention group (and its 95% confidence interval) is based on the assumed risk in the comparison group and the relative effect of the intervention (and its 95% CI). | |||||
| GRADE Working Group grades of evidence | |||||
Antecedentes
La prevención de la obesidad es una prioridad de salud pública internacional (WHO 2016), y cada vez hay más evidencia del impacto del sobrepeso y la obesidad en el funcionamiento, la salud y el bienestar a corto y largo plazo (Reilly 2011). En una amplia variedad de países (incluidos, más recientemente, los países de ingresos medios y bajos), se han registrado tasas elevadas y crecientes de sobrepeso y obesidad en los últimos 30 a 40 años (WHO 2016).
La evidencia global indica que la prevalencia del sobrepeso y la obesidad en los niños comenzó a aumentar a finales de los años ochenta, GBD Obesity Collaboration 2014. En 2010, 43 000 000 de niños menores de cinco años presentaban sobrepeso u obesidad, y aproximadamente 35 000 000 de estos niños vivían en países de ingresos bajos y medios (de Onis 2010). A nivel internacional, las tasas de obesidad infantil siguen aumentando en algunos países (p.ej., México, India, China, Canadá), aunque hay evidencia de una desaceleración de este aumento o de un estancamiento en algunos grupos de edad en algunos países (WHO 2016). La Comisión de la Organización Mundial de la Salud (OMS) para la Erradicación de la Obesidad Infantil (WHO 2016) determinó que la obesidad infantil, incluida la obesidad en niños y adolescentes en edad preescolar, alcanza proporciones alarmantes en muchos países y plantea un desafío urgente e importante. En los objetivos de desarrollo sostenible, establecidos por las Naciones Unidas en 2015, también se considera que la prevención y el control de las enfermedades no transmisibles, incluida la obesidad, son prioridades fundamentales (Naciones Unidas).
Una vez establecida la obesidad infantil, es difícil revertirla a través de intervenciones (Al‐Khudairy 2017; Mead 2017), y se prolonga hasta la edad adulta (Singh 2008; Whitaker 1997), lo que refuerza el argumento a favor de la prevención primaria. La obesidad en los adultos se asocia con un mayor riesgo de enfermedad cardíaca, accidente cerebrovascular, síndrome metabólico, diabetes tipo 2 y algunos tipos de cáncer (Bhaskaran 2014; Yatsuya 2010). Los niños con obesidad tienen un bienestar psicológico más deficiente y niveles elevados de una serie de factores de riesgo cardiometabólicos (Kipping 2008a). Las comorbilidades de la obesidad como la hipertensión arterial, el colesterol alto en sangre y la insensibilidad a la insulina, se observan a una edad cada vez más temprana. La obesidad infantil puede causar problemas musculoesqueléticos, apnea obstructiva del sueño, asma y una serie de problemas psicológicos (NHS England 2014). La obesidad infantil se asocia con la diabetes tipo 2 y las enfermedades cardíacas en la edad adulta y con mortalidad a mediana edad (Public Health England 2015). Tratar la obesidad es muy caro; en el Reino Unido se calculó (en 2014) que el NHS gastó 5 100 000 000 de libras esterlinas al año en enfermedades relacionadas con la obesidad (Dobbs 2014).
Es probable que los esfuerzos primarios de prevención tengan efectos óptimos si se inician en la primera infancia con la participación de los padres (Summerbell 2012). Desde el nacimiento hasta el comienzo de la escuela primaria es un momento crucial para las intervenciones de prevención de la obesidad, cuando se establece entre padres e hijos la dieta y la conducta relacionada con la actividad. Las intervenciones de modificación del estilo de vida para mejorar la calidad de la dieta, aumentar los niveles de actividad física y reducir las conductas sedentarias, a menudo mediante el uso de técnicas de cambio de conducta y la participación de los padres o cuidadores, o ambos, son el pilar de las intervenciones en niños en edad preescolar. Al intervenir a una edad tan temprana, puede ser posible prevenir que los niveles de obesidad sigan aumentando en las generaciones futuras y es fundamental para reducir las desigualdades en salud (Marmot 2010). Como destaca la Comisión (WHO 2016), la adolescencia puede ser un momento crítico para el aumento de peso excesivo, ya que este grupo de edad normalmente tiene más libertad en la elección de alimentos y bebidas fuera del hogar en comparación con los niños más pequeños. Lo anterior, junto con el hecho de que la actividad física suele disminuir durante la adolescencia, especialmente en las niñas, ofrece tanto oportunidades como barreras para quienes desarrollan intervenciones.
La prevalencia de la obesidad también está fuertemente vinculada al grado de desigualdad social relativa, con una mayor desigualdad social asociada a un mayor riesgo de obesidad en la mayoría de los países de ingresos altos (incluso en lactantes y niños pequeños [Ballon 2018]), pero en la mayoría de los países de ingresos bajos y medios se observa una relación inversa (Monteiro 2004). Por lo tanto, es fundamental que para prevenir la obesidad también se reduzca la brecha asociada en las desigualdades en salud, y garantizar que las intervenciones no tengan resultados más favorables en las personas con una posición socioeconómicamente más ventajosa en la sociedad. La base de conocimientos disponible sobre la que desarrollar una plataforma de acción para la prevención de la obesidad y basar las decisiones en las intervenciones de salud pública adecuadas para reducir el riesgo de obesidad en toda la población, o dirigidas a los grupos de mayor riesgo, todavía es limitada (Gortmaker 2011; Hillier‐Brown 2014).
La Comisión de la OMS (WHO 2016) señala que los avances en la lucha contra la obesidad infantil han sido lentos e inconsistentes, y que la prevención y el tratamiento de la obesidad requieren un enfoque de todo el gobierno en el que las políticas de todos los sectores tengan en cuenta de forma sistemática la salud, eviten los efectos perjudiciales para la salud y mejoren así la salud de la población y la equidad sanitaria. De hecho, en la actualidad se reconoce que la lucha contra la obesidad requiere un enfoque sistémico e iniciativas políticas en todos los departamentos del gobierno de manera conjunta (Rutter 2017). Sin embargo, como Knai y colegas han señalado en relación con el Capítulo 2 del Childhood Obesity Plan de Inglaterra, este país aún depende de la autorregulación a nivel individual (Knai 2018). La Comisión de la OMS (WHO 2016) indica que las intervenciones preliminares que proporcionan orientación y formación a los cuidadores que trabajan en centros e instituciones de cuidado infantil sobre el asesoramiento adecuado en materia de alimentación, actividad física y sueño de los niños en edad preescolar pueden ser particularmente importantes. La Comisión de la OMS (WHO 2016) también indica que las intervenciones preliminares pueden ser particularmente importantes para los adolescentes, por ejemplo, las dirigidas a la comercialización de alimentos poco saludables como las bebidas azucaradas; las que enfrentan el entorno obesogénico, como los puntos de venta de alimentos para llevar.
El objetivo de esta revisión fue actualizar la base de evidencia en los niños debido al crecimiento exponencial de los estudios en este campo en los últimos cinco a diez años, y así asegurar que la revisión se mantenga actualizada y sea relevante para la política y la práctica, con especial atención en la equidad en salud. Esta revisión Cochrane se actualizó para incluir los datos informados en los ensayos controlados aleatorios (ECA) publicados hasta 2015 inclusive. En esta actualización se presentan los datos por grupos de edad, de cero a cinco años, de seis a 12 años y de 13 a 18 años. También se proporciona una lista de ECA publicados entre 2016 y 2018 que se consideró, a partir de la información presentada en el resumen, que es probable que cumplan con los criterios de inclusión de esta revisión.
En el futuro la revisión se dividirá en tres revisiones según la edad del niño: de cero a cinco años; de seis a 12 años y de 13 a 18 años. Es razonable pensar que diferentes intervenciones podrían funcionar de manera diferente en niños de diferentes edades. Por ejemplo, la participación significativa de los padres puede ser un factor clave para la eficacia de las intervenciones en los niños en edad preescolar, pero éste puede no ser el caso en los adolescentes; los adolescentes pueden encontrar las intervenciones en línea fáciles de utilizar, así como atractivas e interesantes, debido a su capacidad cognitiva y afinidad por los medios sociales, pero estos tipos de intervenciones pueden no funcionar bien en los niños más pequeños.
Descripción de la afección
Sobrepeso y obesidad son términos utilizados para describir un exceso de adiposidad (o grasa) por encima del ideal para una buena salud. La opinión actual de los expertos apoya el uso de los puntos de corte del índice de masa corporal (IMC) para determinar el estado del peso (como peso saludable, sobrepeso u obesidad) de niños y adolescentes, y se han desarrollado varios puntos de corte estándar del IMC (Cole 2000; Cole 2007; de Onis 2004; de Onis 2007). A pesar de lo anterior, no existe una aplicación consistente de esta metodología por parte de los expertos y también se utilizan diversos métodos basados en percentiles, lo que puede dificultar la comparación de los ECA que han utilizado diferentes medidas y resultados de peso.
Se sabe que el sobrepeso y la obesidad en la infancia tienen un impacto significativo en la salud física y psicosocial (revisado en Lobstein 2004). De hecho, muchas de las consecuencias cardiovasculares que caracterizan la obesidad en la edad adulta van precedidas de anomalías que comienzan en la infancia. La hiperlipidemia, la hipertensión, la tolerancia anormal a la glucosa (Freedman 1999) y la diabetes tipo 2 (Arslanian 2002), ocurren con mayor frecuencia en niños y adolescentes obesos. Además, se sabe que la obesidad en la infancia y la adolescencia son factores de riesgo independientes de la obesidad en los adultos (Must 1992; Must 1999; Power 1997; Singh 2008; Whitaker 1997), lo que subraya la importancia de los esfuerzos de prevención de la obesidad.
Determinantes modificables de la obesidad infantil
La obesidad es el resultado de un desequilibrio energético positivo y sostenido, y en su desarrollo se han visto implicados una variedad de factores genéticos, conductuales, culturales, ambientales y económicos (analizado en Lobstein 2004). La interacción de estos factores es compleja y ha sido objeto de considerables investigaciones; sin embargo, la carga de la obesidad no se experimenta de manera uniforme en toda la población, y los niveles más altos de la afección los presentan las personas más desfavorecidas. En los países de ingresos altos se observa una tendencia significativa entre la obesidad y el bajo nivel socioeconómico, mientras que en algunos países en desarrollo se observa lo contrario, con niños de familias relativamente acomodadas más vulnerables a la obesidad.
Descripción de la intervención
Esta revisión incluye la evaluación de intervenciones educativas, conductuales y de promoción de la salud. Los términos "intervención" y "programa" se utilizan de manera indistinta a lo largo de esta revisión. La Ottawa Charter define cuatro áreas de acción para la promoción de la salud: 1) acciones para desarrollar las capacidades personales, que son acciones dirigidas a las capacidades, conductas, conocimientos y creencias individuales; 2) acciones para reforzar las acciones comunitarias, que son acciones dirigidas a las comunidades e incluyen enfoques medioambientales y basados en el entorno para la promoción de la salud; 3) acciones para reorientar los servicios de salud, que son acciones dentro del sector de la salud y se relacionan con la prestación de servicios; y 4) acciones para construir políticas públicas sanas y crear entornos de apoyo, que son intersectoriales en su naturaleza y se relacionan con la creación de entornos físicos, sociales y de políticas que promuevan la salud, WHO 1986.
Por qué es importante realizar esta revisión
Se insta a los gobiernos de todo el mundo a que tomen medidas para prevenir la obesidad infantil y abordar los determinantes subyacentes de la enfermedad. Para proporcionar a los responsables de la toma de decisiones evidencia de investigación de alta calidad que informe la planificación y la asignación de los recursos, esta revisión tiene como objetivo proporcionar una actualización de la evidencia de los ECA diseñados para comparar el efecto de las intervenciones para prevenir la obesidad infantil con el efecto de recibir una intervención alternativa o ninguna intervención. Se intentó actualizar la revisión anterior (Waters 2011), que concluyó que muchas intervenciones dietéticas y de ejercicios para prevenir la obesidad en niños parecían ineficaces para prevenir el aumento de peso, pero podían ser efectivas para promover una dieta saludable y mayores niveles de actividad física. La revisión anterior también instó a reconsiderar la conveniencia de la duración de los estudios, los diseños y la intensidad de la intervención, además de hacer recomendaciones con respecto al informe completo de los ECA. Sin embargo, en general, aunque no hubo evidencia suficiente para determinar que un programa en particular pudiera prevenir la obesidad infantil, la evidencia indicó que las estrategias integrales para aumentar el consumo de una dieta saludable por parte de los niños y sus niveles de actividad física, junto con el apoyo psicosocial y el cambio ambiental, eran las más prometedoras. Se incorporó la evidencia de investigación que se ha publicado desde entonces y que también es consistente con temas emergentes relacionados con la revisión y la síntesis de la evidencia (Higgins 2011a). También se observó el importante trabajo en torno a la aplicación de políticas e intervenciones para prevenir la obesidad infantil (Wolfenden 2016a). Además, para satisfacer la creciente demanda de los profesionales de la salud pública y de la promoción de la salud, así como de los responsables de la toma de decisiones, se ha intentado incluir información relacionada no solo con el impacto de las intervenciones en la prevención de la obesidad, sino también con la forma en que se lograron los resultados, la forma en que se realizaron las intervenciones, el contexto en el que se llevaron a cabo (Wang 2006) y la medida en que funcionaron de manera equitativa (Tugwell 2010). Este nuevo aspecto de la revisión se guió en parte por las Revisiones Sistemáticas de Promoción de la Salud y las Intervenciones de Salud Pública (Armstrong 2007), más las recomendaciones de revisiones complejas y la evidencia útil para los responsables de la toma de decisiones (Waters 2011), y la información se completó con la opinión de expertos.
Objetivos
El objetivo principal de la revisión fue determinar la efectividad de una serie de intervenciones que incluyen componentes de la dieta o la actividad física, o ambos, diseñados para prevenir la obesidad infantil, mediante la actualización de la versión 2011 de la revisión (Waters 2011). Los objetivos específicos incluyen:
-
evaluación del efecto de las intervenciones educativas dietéticas versus control sobre los cambios en la puntuación z del IMC, el IMC y los eventos adversos en niños menores de 18 años;
-
evaluación del efecto de las intervenciones de actividad física versus control sobre los cambios en la puntuación z del IMC, el IMC y los eventos adversos en niños menores de 18 años;
-
evaluación de los efectos combinados de las intervenciones educativas dietéticas y las intervenciones de actividad física versus control sobre los cambios en la puntuación z del IMC, el IMC y los eventos adversos en niños menores de 18 años
-
evaluación del efecto de las intervenciones educativas dietéticas versus las intervenciones de actividad física sobre los cambios en la puntuación z del IMC, el IMC y los eventos adversos en niños menores de 18 años.
Los objetivos secundarios fueron examinar las características de los programas y las estrategias para responder a la pregunta: "¿Qué funciona para quién, por qué y a qué coste?". Los objetivos secundarios incluyen la evaluación de las características sociodemográficas, los indicadores del proceso (como la intensidad, la duración, el contexto y la administración de la intervención) y los factores contextuales que podrían contribuir al resultado de las intervenciones. Los objetivos específicos incluyen:
-
evaluación de las características sociodemográficas de los participantes (estado socioeconómico, género, edad, grupo étnico, ubicación geográfica, etc.);
-
evaluación de determinados indicadores del proceso (es decir, los que describen por qué y cómo ha funcionado una determinada intervención).
Métodos
Criterios de inclusión de estudios para esta revisión
Tipos de estudios
Se incluyeron los datos de ECA que se diseñaron para, o tenían la intención subyacente de, prevenir la obesidad. Se incluyeron los ECA con un período de intervención activa de cualquier duración, siempre que los estudios informaran los datos de los resultados del seguimiento a un mínimo de 12 semanas desde el inicio del estudio. Se incluyeron los ECA que asignaron al azar a individuos o grupos de individuos; sin embargo, en el caso de los ECA con asignación al azar grupal, solo se incluyeron los ECA con seis o más grupos. Los ECA se categorizaron principalmente según el grupo de edad objetivo (cero a cinco años, seis a 12 años y 13 a 18 años). Se excluyeron los ECA publicados antes de 1990. La evidencia global indica que la prevalencia del sobrepeso y la obesidad en los niños, incluidos los niños en edad preescolar, comenzó a aumentar a finales de los años ochenta (de Onis 2010; GBD Obesity Collaboration 2014). Debido al tiempo transcurrido entre la concepción, la financiación y la finalización de los ECA, se consideró la fecha de publicación de 1990 como un punto de partida pragmático y razonable para la literatura en el área.
Tipos de participantes
Se incluyeron ECA de niños con una edad media de menos de 18 años al inicio del estudio. Se incluyeron los ECA en los que los niños formaban parte de un grupo familiar que recibía la intervención si la evaluación de los resultados se podía extraer por separado para los niños. Para reflejar un enfoque de salud pública que reconozca la prevalencia de un rango de peso dentro de la población general de niños, se incluyeron los ECA en los que entre los participantes se incluyeron niños con sobrepeso u obesidad. Se incluyeron los ECA que restringieron la elegibilidad según el peso si la elegibilidad no estaba limitada a los niños con obesidad. También se incluyeron los ECA en los que los niños estaban "en riesgo" de obesidad, por ejemplo, los padres tuvieron o tenían sobrepeso, o los niños tenían bajos niveles de actividad física. Los ECA que solo incluyeron niños con obesidad al inicio del estudio se consideraron centrados en el tratamiento en lugar de la prevención y, por lo tanto, se excluyeron. Se excluyeron los ECA de intervenciones diseñadas para prevenir la obesidad en mujeres embarazadas y los ECA diseñados para niños con una enfermedad crítica o comorbilidades graves.
Tipos de intervenciones
Estrategias
Se incluyeron estrategias educativas, de promoción de la salud, psicológicas, familiares, de terapia conductual, de asesoramiento y de gestión.
Intervenciones incluidas
Se incluyeron varios tipos de intervenciones dietéticas o de actividad física, o ambas. Se incluyeron los ECA de intervenciones de dieta y nutrición, o ejercicio y actividad física, o ambos; las intervenciones también pueden haber incluido otros elementos como cambio en el estilo de vida (p.ej., cambios en la conducta sedentaria o el sueño) y apoyo social. Se incluyeron los ECA de alimentación complementaria, cuyo objetivo era promover un peso saludable en bebés y niños pequeños. También se incluyeron las intervenciones dirigidas a aumentar las habilidades motoras en los niños pequeños, donde la justificación de estas intervenciones se basó en la evidencia de que las mayores habilidades motoras en los niños pequeños dan lugar a mayores niveles de actividad física a medida que el niño crece. Se excluyeron los ECA en los que la justificación de la intervención era diferente a la prevención de la obesidad.
Contexto
Se incluyeron intervenciones en cualquier contexto. Éstas incluyeron intervenciones dentro de la comunidad en general (incluidos los contextos religiosos), la atención escolar y extraescolar, el hogar, la atención sanitaria y el cuidado de los niños o el preescolar, la guardería y el jardín de infancia.
Tipos de comparaciones
Se incluyeron los ECA que compararon intervenciones dietéticas o de actividad física, o ambas, con un grupo control sin intervención que no recibió tratamiento o recibió atención habitual u otra intervención activa (es decir, comparaciones directas).
Personal de la intervención
No hubo restricciones sobre quién realizó las intervenciones, por ejemplo, investigadores, médicos de atención primaria (médicos generales), profesionales nutricionistas/dietistas, maestros, profesionales de la actividad física, organismos de promoción de la salud, departamentos de salud, líderes religiosos u otros.
Indicadores de la teoría y procesos
Se recopilaron datos sobre los indicadores del proceso y la evaluación de la intervención, la teoría de la promoción de la salud que sustenta el diseño de la intervención, los modos de estrategias y las tasas de deserción de estos estudios. Cuando fue posible, se comparó si el efecto de la intervención varió según estos factores. Esta información se incluyó en los análisis descriptivos y se utilizó para guiar la interpretación de los hallazgos y las recomendaciones.
Intervenciones excluidas
Se excluyeron los ECA de intervenciones diseñadas específicamente para el tratamiento de la obesidad infantil y los ECA diseñados para tratar los trastornos alimentarios como la anorexia y la bulimia nerviosas Se excluyeron todas las intervenciones farmacológicas o quirúrgicas, ya que son intervenciones de tratamiento. Se excluyeron los ECA que se centraron de manera exclusiva en la lactancia materna o el biberón; por ejemplo, los ECA que solo evaluaron el efecto de diversos niveles de proteínas en las fórmulas infantiles. También se excluyeron los ECA que solo se centraron en el entrenamiento de fuerza y el acondicionamiento físico (no dirigidos a la prevención de la obesidad).
Tipos de medida de resultado
Para que los estudios se incluyeran, debían informar uno o más de los siguientes resultados primarios mediante la presentación de una medición inicial y una posterior a la intervención. Esta revisión se centró en informar resultados antropométricos (resultados primarios) y en enumerar otros resultados.
Resultados primarios
-
puntuación z del IMC/IMC
-
Prevalencia de sobrepeso y obesidad
-
Peso y talla
-
Índice ponderal
-
Porcentaje de contenido de grasa
-
Grosor del pliegue cutáneo
Resumen de los hallazgos
Se presentan las tablas "Resumen de los hallazgos", en las que se informa la puntuación z del IMC, el IMC y los eventos adversos para los tres grupos de edad de los niños (de cero a cinco años, de seis a 12 años y de 13 a 18 años) y tres tipos de intervención (dieta, actividad física, y combinación de dieta y actividad física).
Métodos de búsqueda para la identificación de los estudios
Búsquedas electrónicas
We searched the following databases for this update and for previous versions of this review. We did not exclude studies based on language.
For the 2015 update (in this review we included and synthesised data from all studies identified)
-
Cochrane Central Register of Controlled Trials (CENTRAL; 2010, Issue 1 to 2016 Issue 6) in the Cochrane Library
-
MEDLINE (Ovid) January 2010 to June 2015
-
Embase (Ovid) January 2010 to June 2015
-
Cumulative Index to Nursing and Allied Health Literature (CINAHL) (Ovid) March 2010 to June 2015
-
PsycINFO (Ovid) 2010 to June 2015
For the 2018 update (see Characteristics of studies awaiting classification for studies identified as potentially relevant from screening titles and abstracts)
-
Cochrane Central Register of Controlled Trials (CENTRAL; 2015, Issue 6 to 2018, Issue 1), in the Cochrane Library
-
MEDLINE (Ovid) June 2015 to January 2018
-
Embase (Ovid) June 2015 to January 2018
-
Cumulative Index to Nursing and Allied Health Literature (CINAHL) (Ovid) June 2015 to January 2018
-
PsycINFO (Ovid) June 2015 to January 2018
Complete search strategies and search dates for each database can be found in the Appendices.
-
Update 2018 (Appendix 1). Potentially relevant studies stored in Studies awaiting classification
-
Update 2015 (Appendix 2). All study data assessed for inclusion and synthesised
-
Update 2010 (Appendix 3). All study data assessed for inclusion and synthesised
-
Update 2005 (Appendix 4). All study data assessed for inclusion and synthesised
Búsqueda de otros recursos
For the 2018 update on 22 January 2018 we searched ClinicalTrials.gov with the filter 'Applied Filters: Child (birth–17)' . We also searched the WHO International Clinical Trials Registry Platform, search portal (ICTRP), using the filter for studies in children. In addition, we scanned the reference lists of key systematic reviews and references of included studies.
Obtención y análisis de los datos
Selección de los estudios
For the 2015 update, one review author (TB) performed title and abstract screening, and another review author (CS) checked a random subsample (10%). For the 2018 update, two review authors (TB and ME) independently assessed all titles and abstracts in duplicate using RAYYAN software (Rayyan‐QCRI 2016). For titles and abstracts that potentially met the inclusion criteria, we obtained the full text of the article for further evaluation. Two review authors (from TB, CO and ME), independently assessed the full‐text reports of studies against a list of criteria for inclusion. We resolved differences in opinion or uncertainty through a process of discussion. Occasionally we brought in a third review author (CS, TM).
Extracción y manejo de los datos
We developed a data extraction form, based on the Effective Public Health Practice Project Quality Assessment Tool for quantitative studies (Thomas 2003), with additional data extraction items specifically related to implementation. For studies identified between 2010 and 2015 we extracted information relevant to equity using the PROGRESS (Place, Race, Occupation, Gender, Religion, Education, Socio‐economic status (SES), Social status) checklist (Ueffing 2009). And to facilitate full understanding of interventions we also incorporated items from the TIDieR checklist and guide (Hoffman 2014). We also extracted information relevant to assessing risk of bias, source and involvement of funders, data on indicators of intervention process and evaluation, health promotion theory underpinning intervention design, modes of strategies, and attrition rates. Two review authors (CO, TB) independently extracted data from included papers into the data extraction form for each study.
This review sought to identify studies that had reported on socio‐demographic characteristics known to be important from an equity perspective using the PROGRESS checklist (Ueffing 2009).
We attempted to capture factors that we could use to assess implementability of the interventions. These included: programme reach (i.e. was the intervention available to all those to whom it would be relevant?); programme acceptability (was the intervention acceptable to the target population?); and programme integrity (was the programme implemented as planned?). A comprehensive process evaluation allowed us to monitor variability in context and delivery, and to identify barriers and facilitators to implementation.
Evaluación del riesgo de sesgo de los estudios incluidos
We assessed the risk of bias of included RCTs using the 'Risk of bias' tool (Higgins 2017). At least two review authors assessed each study as being at ‘high’, ‘low’ or ‘unclear’ risk of bias for each item. Review authors were not blinded with respect to study authors, institution or journal. We used discussion and consensus to resolve any disagreements.
We incorporated performance and detection bias under the item 'blinding' in the 'Risk of bias' tool. We assessed this to be at low risk for RCTs that reported blinding of outcome assessors, and high risk for RCTs reporting that outcome assessors were not blinded.
We assessed RCTs as low risk for attrition bias if an adequate description of participant flow through the study was provided, the proportion of missing outcome data was relatively balanced between groups and the reasons for missing outcome data were provided and we considered them unlikely to bias the results. We assessed RCTs ‘high’ risk for attrition if attrition was 30% or greater at final follow‐up.
For cluster‐randomised trials we made an additional assessment listed as ‘other bias’ based on the advice for dealing with cluster‐RCTs (Higgins 2011a). For ‘timing of recruitment of clusters’, we rated RCTs at ‘high’ risk of bias if the studies had recruited the clusters after randomisation and at ‘low’ risk of bias if recruitment occurred before randomisation.
For selective outcome reporting we searched for both trial registrations and protocols. Where we were unable to find a trial registration or protocol, we recorded 'selective outcome reporting' as unclear. If all relevant primary outcomes reported in the study report or protocol were reported in the results of the paper, we marked these as low risk of bias. If relevant primary outcomes reported in the study report or protocol were not reported (in the results paper) we recorded these as high risk of bias. Where studies reported an outcome in the results paper that they had not prespecified in the protocol or trials register, we reported this as high risk of bias. For RCTs where we could not locate a protocol or trial registration document, we recorded risk of bias as unclear. See Table 8.5 and Section 8.1.3 of the Cochrane Handbook for Systematic Reviews of Interventions (Higgins 2011b).
Medidas del efecto del tratamiento
For this update we focused on reporting the results for the anthropometric outcomes and listed other outcomes. We conducted meta‐analyses to investigate the impact of included interventions on zBMI scores and BMI. We did not undertake a meta‐analysis of the effects of the interventions on prevalence of overweight or obesity. Most of the RCTs did not report prevalence and used highly variable methods for the classification of overweight and obesity. Different methods of classification of weight status in children produce very different prevalence estimates, and so limit comparisons between RCTs.
Cuestiones relativas a la unidad de análisis
We assessed each cluster‐RCT to see if the analysis had accounted for clustering. For any studies that had not adjusted for clustering we created an approximate analysis of the cluster‐RCT by inflating the standard errors (SE) See section 16.3.6 of the Cochrane Handbook for Systematic Reviews of Interventions (Higgins 2011a). This method requires the intra‐cluster correlation coefficient (ICC), an estimate of the variability within and between clusters, for the RCT. Where a study does not report this, it is possible to use an external estimate of ICC. We selected external estimates of 0.02 and 0.04 by looking at the ICCs reported in other cluster‐RCTs, discounting extremes and looking at the published literature (Ukoumunne 1999). We ran sensitivity analyses using 1) no adjustment, 2) adjustment for clustering assuming ICC of 0.02, and 3) adjustment for clustering assuming ICC of 0.04. We did this for both BMI and zBMI. All values of unadjusted SE and approximate adjusted SE plus data required to calculate them are listed in Appendix 5.
Studies with multiple treatment groups
For RCTs with more than one intervention group we considered 1) if all the intervention groups were relevant to the review, and 2) if all the intervention groups were relevant for a specific meta‐analysis. In situations where only one intervention group was relevant to the meta‐analysis, we would treat it as a two‐armed RCT. For RCTs with more than two arms of relevance to the same meta‐analysis and with one control arm, we included data from both treatment arms. To avoid double counting of participants we halved the number of participants in the control arm. For factorial RCTs we included all the arms of the trials as if they were distinct trials. See Cochrane Handbook of Systematic Reviews of Interventions Section 16.5.4 and 16.5.6 (Higgins 2011a).
Manejo de los datos faltantes
We noted missing data on the data extraction form and took them into account when judging the risk of bias of each study. We excluded RCTs for which insufficient data were available from quantitative analyses (e.g. in study reports, and when missing data could not be obtained). We did not impute any missing data.
Evaluación de la heterogeneidad
We used I2 statistic to assess heterogeneity (Higgins 2003) using suggested assessments of heterogeneity such that I2 of 0 % to 40%: might not be important; 30% to 60%: may represent moderate heterogeneity; 50% to 90%: may represent substantial heterogeneity; 75% to 100%: considerable heterogeneity. We decided to pool data whatever the value of I2 statistic indicated in the meta‐analysis and to explore heterogeneity by running subgroup analyses using different variables, for example, setting, duration of intervention, type of intervention to see if variability could be explained. For our 'Summary of findings' table, and given the varied nature of intervention types, setting, and characteristics of baseline populations, we chose to downgrade evidence once for RCTs with greater than 60% value for I2 statistic and to downgrade evidence twice for RCTs with greater than 85% value of I2 statistic. For the main analyses we will not use the Chi2 or I2 statistics to assess differences between the subgroups for BMI or zBMI. We consider the age groups to be distinct populations, and therefore assessment of differences between the three age groups is not appropriate for the purposes of this review (Deeks 2017).
Evaluación de los sesgos de notificación
We assessed reporting bias and other small study effects following methods set out in Chapter 10 of the Cochrane Handbook for Systematic Reviews of Interventions Higgins 2011d. For those meta‐analyses with more than 10 studies we prepared funnel plots using Stata version 15 (Stata 2019), and tested for asymmetry with Egger tests (Egger 1997a), using the commands 'metabias' and 'metafunnel' Harbord 2009.
Síntesis de los datos
We analysed zBMI scores and BMI data using the generic inverse variance method with a random‐effects model (Deeks 2017). The order of preference for data was prespecified. In preference we took difference in means between intervention and control that were reported for the end of the intervention and had been adjusted for clustering or baseline variation, or both. However, if only unadjusted data were available we used those. If difference in mean data were unavailable we used change scores: the change in outcome from baseline to follow‐up (Cochrane Handbook for Systematic Reviews of Interventions, chapter 9.4.5.2; Deeks 2017). If standard deviation (SD) was not reported we derived it, where possible, from 95% confidence intervals, P values or SE, using the calculator provided in Review Manager 5 (RevMan 5 (Review Manager 2014)), and equations provided in Chapter 9 of the Cochrane Handbook for Systematic Reviews of Interventions (Deeks 2017). We did not use data from RCTs where the difference in means between the two arms at baseline was more than the change in mean in either arm (suggesting that the baseline measure would dominate the outcome data) unless the study presented the change (and variance of that change) for each arm, or had adjusted for the baseline difference.
For RCTs that reported more than one intervention arm, we presented the data for each intervention arm compared with the control arm, with the number of participants in the control arm halved to ensure no double counting.
We have presented only outcome data reported immediately post‐intervention. We did not analyse data for subsequent post‐intervention follow‐up.
We have presented analyses stratified by age group with three categories: 0 to 5 years, 6 to 12 years, and 13 to 18 years. This was based on what would be meaningful for decision makers. These age categories correspond to stages of child development and childhood settings. We believe the populations, children aged 0 to 5 years, children aged 6 to 12 years and young people aged 13 to 18 years, to be too different developmentally to be considered as a single sample. Interventions that are likely to work on a 3 or 4 year old, are unlikely to work in adolescents, and vice versa. We present the effects of BMI and zBMI for each of the three age groups as the main analyses in this review.
For cluster‐RCTs that had not adjusted for clustering we approximated analysis for clustering using ICC = 0.04, based upon methods described in the Cochrane Handbook for Systematic Reviews of Interventions (Higgins 2011a), and on sensitivity analyses of the value of ICC to use for the approximation: 1) no clustering or ICC = 0, 2) ICC of 0.02, and 3) ICC of 0.04. This is described in more detail in section Unit of analysis issues, and in Sensitivity analysis. See Appendix 5 for lists of unadjusted and approximately adjusted SE.
Análisis de subgrupos e investigación de la heterogeneidad
We explored heterogeneity in the nine primary analyses:
-
age 0 to 5 years: dietary interventions, physical activity interventions, and combined dietary and physical interventions; zBMI and BMI;
-
age 6 to 12 years: dietary intervention, physical activity interventions, and combined dietary and physical interventions; zBMI and BMI;
-
age 13 to 18 years: dietary intervention, physical activity interventions, and combined dietary and physical interventions; zBMI and BMI.
by two subgroup analyses, 1) main setting of the intervention (childcare/preschool, school, health service, wider community, home), and 2) duration of active intervention period (≤ 12 months, > 12 months).
GRADE and 'Summary of findings' table
We created 'Summary of findings' tables to summarise the size and certainty of effects of the interventions. This was based on the five GRADE considerations (risk of bias, consistency of effect, imprecision, indirectness and publication bias). We used GRADEpro software (GRADEpro GDT 2015), and followed methods described in the Cochrane Handbook for Systematic Reviews of Interventions: Section 8.5 (Higgins 2017), and Chapter 12 (Schünemann 2017).
To determine the consistency of effects for each comparison we looked at the I2 statistic value. For comparisons where the meta‐analysis had an I2 statistic value above 60% we determined these to be at ‘serious’ inconsistency. If the I2 statistic was above 85% we considered this to be ‘very serious’ inconsistency. We assessed the risk of bias across all the RCTs contributing to the pooled effect. We assessed the effect of risk of bias by comparing the overall treatment effect from all studies with a sensitivity analysis in which we excluded all studies with at least one domain at high risk of bias. If the estimates from the overall versus the sensitivity analysis were in opposite directions, we downgraded the estimate twice for risk of bias rating it as 'very serious'. If the treatment effects from the overall analysis and the sensitivity analysis were largely congruent then we did not downgrade.
Análisis de sensibilidad
Fifteen cluster‐RCTs had not accounted for clustering in their analysis (Annesi 2013; Bonis 2014; Cao 2015; Farias 2015; Herscovici 2013; Klein 2010; Lazaar 2007; Llargues 2012; Melnyk 2013; Natale 2014; Robbins 2006; Sallis 1993; Sevinc 2011; Spiegel 2006; Thivel 2011). Three of these studies did not contribute data to any meta‐analyses (Farias 2015; Sallis 1993; Sevinc 2011). We approximated adjustment for clustering using the method described in the Cochrane Handbook for Systematic Reviews of Interventions (Higgins 2011a). We selected a range of ICC coefficients (no adjustment, ICC = 0.02 and ICC = 0.04). We ran meta analyses using unadjusted SE and SE adjusted for ICC = 0.02 and ICC = 0.04 for both BMI and zBMI. Using sensitivity analysis, we observed that the pooled effect sizes for each meta‐analysis was changed very little by the choice of value for ICC (see Appendix 5). In order to be conservative in our selection of ICC we chose an ICC of 0.04 and have presented pooled meta‐analyses in which the SE of RCTs that had not taken account of clustering have been approximately adjusted using an ICC of 0.04.
Results
Description of studies
Results of the search
This is the fourth update of this review, the search dates for which were 1999, 2002, 2005, 2010, and 2015. The 2010 to 2015 search retrieved 18,106 unique new records. We read 279 of these records in full and added 108 new RCTs. In total, since 1999, searches for this review have retrieved 46,107 unique records, and we have included 153 RCTs (210 papers). See Figure 1 for the PRISMA flow chart (Moher 2009). There are 62 RCTs (n = 88,383) contributing data to meta‐analysis of zBMIs and 72 RCTs (n = 77,286) contributing data to meta‐analysis of BMI. Note, these figures do not add up to 153 (to reflect number of included studies) because some studies report both zBMI and BMI whilst other studies report neither. Twenty‐four RCTs reported both BMI and zBMI scores. The records retrieved from searching and the RCTs identified since 1999 appear to be increasing exponentially (see Figure 2). We ran the searches for a fifth update (search date January 2018) and have listed papers with potential for inclusion identified from this search in 'Studies awaiting classification'. However, we have not yet synthesised data from these studies in this review.

Flow of records

Increase in number of records retrieved and studies included in this systematic review from 2001 until 2017
Included studies
We included 153 RCTs in this review. We have listed details of each in the Characteristics of included studies table and Figure 3, and have summarised additional material relating to the theory underpinning the intervention, setting, age, country, and intervention period in Table 1, Table 2 and Table 3. Information about type of comparator is listed in Table 4 and information related to funding source is summarised in Table 5. We have listed studies reporting adverse events in Table 6, Table 7 and Table 8. We have summarised included studies reporting zBMI or BMI, and therefore included in the meta‐analyses, in Table 9, and we have listed them in more detail in Table 10, Table 11, Table 12, Table 13, Table 14 and Table 15.

Distribution of studies by location, age of children and type of intervention. * Total number of locations is 154 and not 153 (number of studies) as one study, Lana 2014, was located in both Spain and Mexico. Papadaki 2010 was located in 7 countries across Europe.
| Study | Type | Country | Theory | Setting | |||||
| Childcare/ preschool | Primary/ secondary school | Health Service | Community | Home | Duration of intervention | ||||
| Alkon 2014 | D and PA | USA | NR | X | ≤ 12 months | ||||
| Annesi 2013 | PA | USA | Social Cognitive and Self‐efficacy Theory | X | ≤ 12 months | ||||
| Barkin 2012 | D and PA | USA | Social Cognitive Theory, Transtheoretical Model of Change | X | ≤ 12 months | ||||
| Bellows 2013a | PA | USA | NR | X | > 12 months | ||||
| Birken 2012 | PA (screen time) | Canada | NR | X | ≤ 12 months | ||||
| Bonis 2014 | D and PA | USA | NR | X | ≤ 12 months | ||||
| Bonuck 2014 | D (bottle use) | USA | NR | X | ≤ 12 months | ||||
| Bonvin 2013 | PA | Switzerland | Socioecological Model | X | ≤ 12 months | ||||
| Campbell 2013 | D and PA | Australia | Social Cognitive Theory | X | > 12 months | ||||
| Crespo 2012 | D and PA | US‐Mexico border | Social Cognitive Theory and Health Belief Model | X | X | X | ≤ 12 months | ||
| Daniels 2012 | D | Australia | Attachment theory, Anticipatory Guidance, Social Cognitive Approach | X | > 12 months | ||||
| De Bock 2012 | D | Germany | Social Learning Theory and Exposure theory | X | ≤ 12 months | ||||
| De Coen 2012 | D and PA | Belgium | Socio‐ecological model | X | > 12 months | ||||
| Dennison 2004 | PA | USA | Behaviour change | X | ≤ 12 months | ||||
| De Vries 2015 | PA | Netherlands | NR | X | X | ≤ 12 months | |||
| Feng 2004 | D and PA (education only) | China | NR | X | > 12 months | ||||
| Fitzgibbon 2005 | D and PA | USA | Social Cognitive Theory | X | ≤ 12 months | ||||
| Fitzgibbon 2006 | D and PA | USA | Social Cognitive Theory | X | ≤ 12 months | ||||
| Fitzgibbon 2011 | D and PA | USA | Social Cognitive Theory, Self‐determination theory | X | X | ≤ 12 months | |||
| Haines 2013 | D and PA | USA | NR | X | ≤ 12 months | ||||
| Harvey‐Berino 2003 | D and PA | USA | Behaviour Change | X | ≤ 12 months | ||||
| Keller 2009 | D and PA | Germany | NR | X | X | ≤ 12 months | |||
| Klein 2010 | D and PA | Germany | Theory of Planned Behaviour, Precaution Adoption Process | X | > 12 months | ||||
| Mo‐suwan 1998 | PA | Thailand | Environmental Change | X | ≤ 12 months | ||||
| Natale 2014 | D and PA | USA | Socio‐ecological model | X | ≤ 12 months | ||||
| Nemet 2011 | D and PA | Israel | NR | X | ≤ 12 months | ||||
| Ostbye 2012 | D and PA | USA | Social Cognitive Theory | X | ≤ 12 months | ||||
| Paul 2011 | D | USA | NR | X | ≤ 12 months | ||||
| Puder 2011 | D and PA | Switzerland | Social Ecological model | X | > 12 months | ||||
| Reilly 2006 | PA | Scotland | Environmental Change and Behaviour Change | X | ≤ 12 months | ||||
| Roth 2015 | PA | Germany | NR | X | ≤ 12 months | ||||
| Rush 2012 | D and PA | New Zealand | NR | X | > 12 months | ||||
| Skouteris 2016 | D and PA | Australia | Learning and Social Cognitive Theories | X | ≤ 12 months | ||||
| Slusser 2012 | D and PA | USA | Social Learning Theory | X | X | X | ≤ 12 months | ||
| Story 2012 | D and PA | USA | NR | X | > 12 months | ||||
| Verbestel 2014 | D and PA | Belgium | Theories of Information Processing; the Elaboration Likelihood Model; and the Precaution‐Adoption Process Model | X | ≤ 12 months | ||||
| Wen 2012 | D and PA | Australia | NR | X | > 12 months | ||||
| Yilmaz 2015 | PA (screen time) | Turkey | Social Cognitive theory | X | X | ≤ 12 months | |||
| Zask 2012 | D and PA | Australia | NR | X | ≤ 12 months | ||||
| Study | Type | Country | Theory | Setting | |||||
| Childcare/ preschool | Primary/ secondary school | Health Service | Community | Home | Duration of intervention | ||||
| Amaro 2006 | D | Italy | NR | X | ≤ 12 months | ||||
| Baranowski 2003 | D and PA | USA | Social Cognitive Theory and Family Systems Theory | X | X | ≤ 12 months | |||
| Baranowski 2011 | D and PA | USA | Social Cognitive, Self‐determination, Persuasion Theories | X | ≤ 12 months | ||||
| Beech 2003 | D and PA | USA | Social Cognitive Theory and Family Systems Theory | X | ≤ 12 months | ||||
| Bohnert 2013 | D and PA | USA | Social Cognitive Theory and Sociocultural Theory | X | ≤ 12 months | ||||
| Brandstetter 2012 | D and PA | Germany | Social Cognitive Theory | X | X | ≤ 12 months | |||
| Branscum 2013 | D and PA | USA | Social Cognitive Theory | X | ≤ 12 months | ||||
| Brown 2013 | D and PA | USA | Transtheoretical Model‐Stages of Change, Social Cognitive Theory | X | X | ≤ 12 months | |||
| Caballero 2003 | D and PA | USA | Social Learning Theory | X | > 12 months | ||||
| Cao 2015 | D and PA | China | NR | X | X | > 12 months | |||
| Chen 2010 | D and PA | USA | Social Cognitive Theory | X | ≤ 12 months | ||||
| Coleman 2005 | D and PA | USA | NR | X | > 12 months | ||||
| Coleman 2012 | D | USA | Ecological and Developmental Systems Theories, Behavioural Ecological Models | X | > 12 months | ||||
| Cunha 2013 | D | Brazil | Transtheoretical Model | X | ≤ 12 months | ||||
| Damsgaard 2014 | D | Denmark | NR | X | ≤ 12 months | ||||
| De Heer 2011 | D and PA | USA | Ecological, Social Cognitive Theory | X | ≤ 12 months | ||||
| De Ruyter 2012 | D (drinks) | Netherlands | NR | X | > 12 months | ||||
| Donnelly 2009 | PA | USA | Environmental Model | X | > 12 months | ||||
| Elder 2014 | D and PA | USA | NR | X | > 12 months | ||||
| Epstein 2001 | D | USA | NR | X | ≤ 12 months | ||||
| Fairclough 2013 | D and PA | UK | Social Cognitive Theory | X | ≤ 12 months | ||||
| Foster 2008 | D and PA | USA | Settings‐based | X | > 12 months | ||||
| Fulkerson 2010 | D | USA | Social Cognitive Theory | X | X | ≤ 12 months | |||
| Gentile 2009 | D and PA | USA | Socio‐ecological theory | X | X | X | ≤ 12 months | ||
| Gortmaker 1999a | D and PA | USA | Social Cognitive Theory | X | > 12 months | ||||
| Grydeland 2014 | D and PA | Norway | Socioecological framework | X | > 12 months | ||||
| Gutin 2008 | PA | USA | Environmental change | X | > 12 months | ||||
| Habib‐Mourad 2014 | D and PA | Lebanon | Social Cognitive Theory | X | ≤ 12 months | ||||
| Haire‐Joshu 2010 | D and PA | USA | Social Cognitive Theory, Ecological Model | X | ≤ 12 months | ||||
| Han 2006 | D | China | NR | X | > 12 months | ||||
| HEALTHY Study Gp 2010 | D and PA | USA | NR | X | > 12 months | ||||
| Hendy 2011 | D and PA | USA | Social Cognitive Theory, Self‐determination Theory, Group Socialization Theory | X | ≤ 12 months | ||||
| Herscovici 2013 | D and PA | Argentina | NR | X | ≤ 12 months | ||||
| Howe 2011 | PA | USA | NR | X | ≤ 12 months | ||||
| James 2004 | D | UK | NR | X | ≤ 12 months | ||||
| Jansen 2011 | D and PA | USA | Theory of Planned Behaviour and Ecological Model | X | ≤ 12 months | ||||
| Johnston 2013 | D and PA | USA | NR | X | > 12 months | ||||
| Kain 2014 | D and PA | Chile | NR | X | ≤ 12 months | ||||
| Khan 2014 | PA | USA | NR | X | ≤ 12 months | ||||
| Kipping 2008 | D and PA | UK | Social Cognitive Theory and Behavioural C | X | ≤ 12 months | ||||
| Kipping 2014 | D and PA | UK | Social Cognitive Theory | X | ≤ 12 months | ||||
| Klesges 2010 | D and PA | USA | NR | X | > 12 months | ||||
| Kriemler 2010 | PA | Switzerland | Socio‐ecological Model | X | ≤ 12 months | ||||
| Lazaar 2007 | PA | France | NR | X | ≤ 12 months | ||||
| Levy 2012 | D and PA | Mexico | NR | X | ≤ 12 months | ||||
| Li 2010a | PA | China | NR | X | X | ≤ 12 months | |||
| Llargues 2012 | D and PA | Spain | Investigation, Vision, Action and Change Methodology | X | > 12 months | ||||
| Macias‐Cervantes 2009 | PA | Mexico | NR | X | X | ≤ 12 months | |||
| Madsen 2013 | PA | USA | NR | X | ≤ 12 months | ||||
| Magnusson 2012 | D and PA | Iceland | NR | X | > 12 months | ||||
| Marcus 2009 | D and PA | Sweden | NR | X | > 12 months | ||||
| Martinez‐Vizcaino 2014 | PA | Spain | Socio‐ecological model | X | ≤ 12 months | ||||
| Meng 2013 | D, D and PA, PA | China | NR | X | ≤ 12 months | ||||
| Morgan 2011 | D and PA | Australia | Social Cognitive Theory | X | ≤ 12 months | ||||
| Muckelbauer 2010 | D (water) | Germany | Theory of Planned Behaviour | X | ≤ 12 months | ||||
| Nollen 2014 | D and PA | USA | NR | X | ≤ 12 months | ||||
| Nyberg 2015 | D and PA | Sweden | Social Cognitive Theory | X | ≤ 12 months | ||||
| Paineau 2008 | D | France | NR | X | X | ≤ 12 months | |||
| Papadaki 2010 | D | Netherlands, Denmark, UK, Greece, Germany, Spain, Bulgaria, and Czech Republic | NR | X | ≤ 12 months | ||||
| Reed 2008 | PA | Canada | Socio‐ecological model | X | ≤ 12 months | ||||
| Robbins 2006 | PA | USA | Health Promotion Model and the Transtheoretical Model | X | X | ≤ 12 months | |||
| Robinson 2003 | D and PA | USA | Social Cognitive Theory | X | ≤ 12 months | ||||
| Robinson 2010 | PA | USA | Social Cognitive Model | X | > 12 months | ||||
| Rodearmel 2006 | D and PA | USA | NR | X | ≤ 12 months | ||||
| Rosario 2012 | D | Portugal | Health Promotion Model and Social Cognitive Theory | X | ≤ 12 months | ||||
| Rosenkranz 2010 | D and PA | USA | Social Cognitive Theory | X | ≤ 12 months | ||||
| Roth 2015 | PA | Germany | NR | X | ≤ 12 months | ||||
| Rush 2012 | D and PA | New Zealand | NR | X | > 12 months | ||||
| Safdie 2013 | D and PA x 2 | Mexico | Ecological principles, Theory of Planned Behaviour, Social Cognitive Theory, Health Belief Model | X | > 12 months | ||||
| Sahota 2001 | D and PA | UK | Multicomponent health promotion programme, based on the Health Promoting Schools concept | X | ≤ 12 months | ||||
| Sallis 1993 | PA | USA | Behaviour Change and Self‐management | X | > 12 months | ||||
| Salmon 2008 | PA | Australia | Social Cognitive Theory and Behavioural Choice Theory | X | ≤ 12 months | ||||
| Santos 2014 | D and PA | Canada | NR | X | ≤ 12 months | ||||
| Sevinc 2011 | D and PA vs D | Turkey | NR | X | ≤ 12 months | ||||
| Sichieri 2009 | D | Brazil | NR | X | ≤ 12 months | ||||
| Siegrist 2013 | D and PA | Germany | NR | X | ≤ 12 months | ||||
| Simon 2008 | PA | France | Behaviour Change and Socio‐ecological Model | X | > 12 months | ||||
| Spiegel 2006 | D and PA | USA | Theory of reasoned action, constructivism | X | ≤ 12 months | ||||
| Stolley 1997 | D and PA | USA | NR | X | ≤ 12 months | ||||
| Story 2003 | D and PA | USA | Social Cognitive Theory, Youth Development, and Resiliency | X | X | ≤ 12 months | |||
| Telford 2012 | PA | Australia | NR | X | > 12 months | ||||
| Thivel 2011 | PA | France | NR | X | ≤ 12 months | ||||
| Vizcaino 2008 | PA | Spain | NR | X | ≤ 12 months | ||||
| Wang 2012 | D and PA | China | NR | X | ≤ 12 months | ||||
| Warren 2003 | D and PA | England | Social Learning Theory | X | X | > 12 months | |||
| Williamson 2012 | D and PA | USA | Social Learning Theory | X | > 12 months | ||||
| Study | Type | Country | Theory | Setting | Duration of intervention | ||||
| Childcare/ preschool | Primary/ secondary school | Health Service | Community | Home | |||||
| Andrade 2014 | D and PA | Ecuador | Social Cognitive Theory, Information‐Motivation Behavioral Skills Model, Control Theory, Trans‐ theoretical Model, Theory of Planned Behavior | X | > 12 months | ||||
| Black 2010 | D and PA | USA | Social Cognitive Theory and Motivational Interviewing | X | X | ≤ 12 months | |||
| Bonsergent 2013 | D and PA | France | NR | X | X | X | > 12 months | ||
| Christiansen 2013 | PA | Denmark | Social Ecological framework | X | > 12 months | ||||
| Dewar 2013 | D and PA | Australia | Social Cognitive Theory | X | ≤ 12 months | ||||
| Ebbeling 2006 | D | USA | NR | X | ≤ 12 months | ||||
| El Ansarai 2010 | PA | Egypt | NR | X | ≤ 12 months | ||||
| Ezendam 2012 | D and PA | Netherlands | Theory of Planned Behavior, Precaution Adoption Process Model, Implementation Intentions | X | ≤ 12 months | ||||
| Farias 2015 | PA | Brazil | NR | X | ≤ 12 months | ||||
| French 2011 | D and PA | USA | NR | X | X | ≤ 12 months | |||
| Haerens 2006 | D and PA | Belgium | Theory of Planned Behaviours and Transtheoretical Model | X | > 12 months | ||||
| Lana 2014 | D and PA (online) | Mexico, Spain | Attitude, Social influence and Self‐Efficacy (ASE model) and Transtheoretical Model | X | ≤ 12 months | ||||
| Lubans 2011 | PA | Australia | Social Cognitive Theory | X | > 12 months | ||||
| Mauriello 2010 | D and PA | USA | Transtheoretical Model of Behavior Change | X | ≤ 12 months | ||||
| Melnyk 2013 | D and PA | USA | Cognitive Theory | X | ≤ 12 months | ||||
| Mihas 2010 | D | Greece | Social Learning Theory | X | ≤ 12 months | ||||
| Neumark‐Sztainer 2003 | D and PA | USA | Social Cognitive Theory | X | ≤ 12 months | ||||
| Neumark‐Sztainer 2010 | D and PA | USA | Social Cognitive Theory, Theory of Planned Behaviour | X | > 12 months | ||||
| Pate 2005 | PA | USA | Socio‐ecological model and Social Cognitive Theory | X | ≤ 12 months | ||||
| Patrick 2006 | D and PA | USA | Behavioural Determinants model, Social Cognitive Theory and Transtheoretical Model | X | X | ≤ 12 months | |||
| Peralta 2009 | D and PA | Australia | Social Cognitive Theory | X | ≤ 12 months | ||||
| Shin 2015 | D | USA | Social Cognitive Theory | X | ≤ 12 months | ||||
| Singh 2009 | D and PA | Netherlands | Behaviour Change and Environmental | X | > 12 months | ||||
| Smith 2014 | PA | Australia | Self‐determination Theory and Social Cognitive Theory | X | ≤ 12 months | ||||
| Velez 2010 | PA | USA | NR | X | ≤ 12 months | ||||
| Viggiano 2015 | D and PA (board game) | Italy | NR | X | ≤ 12 months | ||||
| Weeks 2012 | PA | Australia | NR | X | ≤ 12 months | ||||
| Whittemore 2013 | D and PA | USA | Theory of Interactive Technology, Social Learning Theory | X | X | ≤ 12 months | |||
| Wilksch 2015 | D and PA | Australia | NR | X | ≤ 12 months | ||||
| Footnotes D: diet; NR: not reported; PA: physical activity | |||||||||
| Study | Type | Control |
| D and PA | Waitlist | |
| D | No intervention | |
| D and PA | Usual care | |
| PA | Usual care | |
| D and PA | Day camp | |
| D and PA | Health‐related video games | |
| D and PA | School‐readiness programme | |
| 1. D and PA child‐targeted 2. D and PA parent‐targeted | Self‐esteem | |
| PA (plus diet) | Diet intervention only | |
| PA (screen time) | Safe media use | |
| D and PA | No intervention | |
| D and PA | No intervention | |
| D and PA | Waitlist | |
|
| No intervention | |
| D (bottle use) | No intervention | |
| PA | Waitlist | |
| D and PA | Usual care presumed as intervention integrated into school curriculum | |
| D and PA (theory‐based) | Knowledge‐based D and PA | |
| D and PA | Alcohol and drug comparison | |
| D and PA | Usual care presumed as no details but school‐based intervention | |
| D and PA | Newsletters on non‐obesity‐focused themes | |
| D and PA | No intervention | |
| D and PA | Waitlist | |
| D and PA | General health information related to nutrition, dental care, safety, skin care, and risk‐taking behaviours | |
| PA | Usual care | |
| D and PA | No intervention (financial incentive to participate) | |
| D | Usual care presumed as no details but school‐based intervention | |
| 1. D + PA family‐only 2. D + PA community‐only 3. D + PA family + community | No intervention | |
| D | No intervention | |
| D | Packed lunch from home | |
| D | Usual care | |
| D | Waitlist | |
| D and PA | Usual care presumed as no details but primarily school‐based intervention | |
| D and PA | Health workbooks and incentives | |
| D (drink) | Similar sugar‐containing drink in participants who commonly drank them | |
| PA | Standard care without PA recommendations | |
| PA | Health and safety programme | |
| D and PA | Usual care? presumed as no details but school‐based intervention | |
| PA | Usual care ‐ regular classroom instruction without physically active lessons | |
| D (drink) | Usual drink consumption | |
| PA (plus ‘normal’ exercise schedule provided by the school) | Usual care ‘normal’ exercise schedule provided by the school | |
| D and PA | No intervention – measurement only | |
| D (fruit + veg) | D (fat + sugar) | |
| D and PA | No intervention | |
| D and PA | Did not teach a specific unit focused on healthy eating and PA | |
| PA | Usual care physical activity at school | |
| D and PA (education only) | No intervention ‐ translated | |
| D and PA | General health intervention | |
| D and PA | General health intervention | |
| D and PA | General health intervention | |
| D and PA | No intervention | |
| D and PA | No intervention | |
| D | No intervention | |
| D and PA (plus community component) | Community component only | |
| D and PA | Usual care health curricula and PE classes | |
| D and PA | Usual care presumed as no details but school‐based intervention | |
| PA | No intervention presumed as no details (after‐school intervention) | |
| D and PA | Usual curriculum | |
| 1. D+PA parent 2. D+PA child alone | Usual care presumed as no details but school‐based intervention | |
| D and PA | Mailed materials focused on child development | |
| D and PA | Usual care | |
| D | Usual care presumed as no details but school‐based intervention ‐ translated | |
| D and PA (plus parenting support) | Parenting support but refrained from discussing child or parent eating and exercise behaviour | |
| D and PA | No intervention ‐ assessment only | |
| D and PA (token rewards) | Token rewards for three ‘‘Good Citizenship Behaviors.’’ | |
| D and PA | Usual care presumed as no details but school‐based intervention | |
| PA | No intervention and were not allowed to stay for the after‐school intervention but rather instructed not to change their daily after‐school routine | |
| D (drinks) | Usual care presumed as no details but school‐based intervention | |
| D and PA | Usual care curriculum | |
| D and PA | Self‐help | |
| D and PA | Usual care presumed as no details but school‐based intervention | |
| D and PA | No intervention – study translated in previous version of review | |
| PA | Maintain regular after‐school routine, financial incentive for measurements | |
| D and PA | Waitlist | |
| D and PA | Standard teaching | |
| D and PA | No intervention | |
| D and PA | Self‐esteem and social efficacy | |
| PA | Not informed of an intervention group | |
| 1. D and PA online only 2. D and PA online plus texts | No intervention presumed as no details | |
| PA | Usual care presumed as no details but school‐based intervention | |
| D and PA | Usual care presumed as no details but school‐based intervention | |
| PA | No intervention | |
| D and PA | Usual care presumed as no details but school‐based intervention | |
| PA | Waitlist | |
| PA | Maintain the same level of physical activity | |
| PA | No intervention presumed as no details | |
| D and PA (plus 2 x 40‐min PA + incentives) | 2 x 40‐min PA + incentives | |
| D and PA | Normal curriculum | |
| PA (plus 2 h/week of physical activity at low to moderate intensity) | Standard physical education curriculum (2 h/week of physical activity at low to moderate intensity) | |
| D and PA (multimedia) | No intervention | |
| D and PA | Attention control programme ‐ common health topics | |
| 1. D 2. PA 3. D and PA | No intervention | |
| D | Usual care presumed as no details but school‐based intervention | |
| PA | Usual care presumed as no details but school‐based intervention | |
| D and PA | Waitlist | |
| D (water) | No intervention | |
| D and PA | Attention control ‐ safety education curriculum | |
| D and PA | Regular kindergarten schedule | |
| D and PA | Regular physical education class and minimal intervention (written materials on healthy eating and physical activity at baseline) | |
| D and PA (plus all‐girls PE class during the first semester) | All‐girls PE class during the first semester then usual PE | |
| D and PA (screen time only, via mobile technology) | Same content in a written manual but no prompting | |
| D and PA | Waitlist | |
| D and PA (plus financial incentives) | Monthly newsletters emphasising pre‐reading skills plus financial incentives | |
| 1. reduce fat + increase complex carbohydrate 2. reduce both fat+sugar+increase complex carbohydrate | No advice | |
| 1. low protein /low glycaemic index 2. low protein/high glycaemic index 3. high protein/low glycaemic index 4. high protein/high glycaemic index | National dietary guidelines, with medium protein content and no specific instructions on glycaemic index | |
| PA (plus enrolled in PE) | Enrolled in PE classes | |
| D and PA (plus lottery tickets for small cash prizes) | Sun protection plus lottery tickets for small cash prizes | |
| 1. soothe/sleep 2. introduction to solids 3. combination | No intervention | |
| PA | Physical activity curriculum sessions | |
| D and PA | Regular school curriculum | |
| PA | Usual care | |
| PA | Usual care curriculum | |
| PA | Handout listing the PA recommendations | |
| D and PA | Active comparison ‐ health education programme to promote healthful diet and activity patterns via newsletters and delivering health education lectures | |
| PA | Information‐based health education | |
| D and PA | Maintain usual eating and step patterns (given step counter and logs same as intervention group) | |
| D | Usual care presumed as no details but school‐based intervention | |
| D and PA | No intervention presumed (Girl Scouts USA) | |
| PA | Usual care presumed, pre‐school setting | |
| D and PA | No additional resourcing or information | |
| 1. Basic D and PA 2. Basic D and PA plus financial investment and resources | No changes were made to existing nutrition or physical activity practices | |
| D and PA | Usual care presumed as no details but school‐based intervention | |
| PA | Usual care PE | |
| 1. Behaviour modification of PA 2. Fundamental movement skills 3. Combination | Usual care curriculum | |
| D and PA | Usual care regular curriculum | |
| 1. D 2. D and PA | Usual care presumed as no details but school‐based intervention | |
| D | No intervention | |
| D (drinks) | 2 x 1‐h general sessions on health issues and printed general advices regarding healthy diets | |
| D and PA | Usual care | |
| PA | Usual care school curriculum | |
| D and PA | Usual care regular curriculum | |
| D and PA | Waitlist | |
| D and PA | Waitlist | |
| PA | Waitlist and usual practice (i.e. regularly scheduled school sports and PE) | |
| D and PA | Data collection only | |
| D and PA | Attention placebo group | |
| D and PA | ‘‘active placebo,’’ non‐nutrition/PA condition, promoting self‐esteem and cultural enrichment | |
| D and PA | Usual care presumed as no details but school‐based intervention | |
| PA | Usual care, common practice PE | |
| PA | Not aware of the intervention in other schools | |
| PA | No intervention | |
| D and PA | No intervention presumed as no details | |
| D and PA (board game) | No intervention | |
| PA (plus standard PE curriculum (3 h/week of PA at low to moderate intensity) | Standard PE curriculum (3 h/week of PA at low to moderate intensity) | |
| D and PA | Usual care presumed as no details but school‐based intervention ‐ translated | |
| 1. D 2. PA 3. D and PA | Educational programme about food in a ‘non‐nutrition’ sense | |
| PA | Regular PE warm‐up | |
| D and PA (plus usual childhood nursing service from community health service nurses) | Usual childhood nursing service from community health service nurses plus health promotion material | |
| D and PA ‐ coping skills training (plus health education and behavioral support) | Health education and behavioral support | |
| 1. D and PA, 'Media Smart' 2. D and PA, 'Life Smart' 3. D and PA, 'Helping, Encouraging, Listening and Protecting Peers' | Usual school class | |
| 1. D and PA, primary prevention + environmental modification 2. D and PA, primary + secondary prevention with an added classroom and internet education component | No intervention | |
| PA (screen time) | Not aware of the intervention | |
| D and PA | Waitlist | |
| D: diet; PA: physical activity; PE: physical education | ||
| Age group | Source of funding | Was the writing of reports and research independent from industry | Source of funding was from food/nutrition or intervention industry | ||||
| Non‐industrya: number (%) | Not reported: number (%) | Not funded: number (%) | Industryb: number (%) | Industry and non‐industry: number (%) | |||
| 0‐5 | 28 (71.8) | 6 (15.4) | 0 (0) | 0 (0) | 5 (12.8) | 2/5 | 3/5c |
| 6‐12 | 69 (81.2) | 7 (8.2) | 0 (0) | 1 (2.4) | 7 (8.2) | 3/8 | 6/8d |
| 13‐18 | 26 (89.7) | 1 (3.4) | 2 (6.9) | 0 (0) | 2 (6.9) | 1/2 | 2/2e |
aFunding from government organisations, not‐for‐profit organisations, charities etc.
bAny source that was from commercial or profit‐making organisations including trusts and foundation organisations originating from commercial sources.
cDaniels 2012 (Heinz), Paul 2011 (Gerber food – Nestlé), Puder 2011 (Wyeth foundation, Nestlé).
dDamsgaard 2014 (Danæg A/S, Naturmælk, Lantmännen A/S, Skærtoft Mølle A/S, Kartoffelpartnerskabet, AkzoNobel Danmark, Gloria Mundi and Rose Poultry A/S); Grydeland 2014 (Thorne‐Holst related to Chocolate manufacturer Marabou); Kain 2014 (Corporea Tesmontes A food processing company); Paineau 2008 (CEDUS Association for sugar beet producers France); Papadaki 2010 (Numerous food suppliers including Coca‐Cola, Unilever and Kellogs); Rodearmel 2006 (WK Kellogs Institute for Food and Nutrition Research).
eBonsergent 2013, Wyeth Foundation (Nestlé); and Patrick 2006 (the PACE trial) indicated that three authors received income from an organisation that developed the intervention used in the trial.
| Study name | Intervention type | Control | Adverse events (overall/any) | Sufficiency of infant weight gain | Injuries | Accidents | Infections |
| USA | D and PA Childcare 24 months N = 383 | General health intervention | No adverse events reported | ||||
| USA | D and PA Home 12 months N = 110 | No intervention | No Effect (< 5th percentile) | ||||
| Switzerland | D and PA Childcare Nil: end of intervention N = 652 | Regular school curriculum | No difference | No injuries occurred | |||
| Germany | D and PA Childcare 2‐4 months N = 709 | Usual care presumed, preschool setting | No difference | No difference | |||
| D: diet; PA: physical activity | |||||||
| Study name | Intervention type | Control | Adverse events (overall/any) | Number underweight/health of underweight children | Increased weight concern | Body satisfaction (body image) | Injuries | Depressive symptoms |
| USA | D and PA Community Nil: end of intervention I = 42 | Self‐esteem | Visit to healthcare provider | NR/NR | Unhealthy weight concern | Self‐perceived body shape and body shape dissatisfaction (Silhouettes) | C = 2 (11%) | NR |
| USA | D and PA School Nil: end of intervention I = 479 | No intervention | NR | No change in remission of underweight/NR | NR | Body dissatisfaction Eating Disorder Inventory MD = 0.14 (95% CI −0.73 to 0.45) | NR | NR |
| USA | D and PA I = 2307 | No intervention ‐ assessment only | < 3% adverse events, nearly similar between groups | NR/NR | NR | NR | NR | NR |
| China | PA 12 months I = 2092 | No intervention | NR | No effect on zBMI of underweight children | NR | NR | NR | NR |
| Spain | PA School I = 420 | Standard PE curriculum (2 h/week of PA at low to moderate intensity) | NR | NR/no difference in % underweight | NR | NR | Two minor ankle sprains risk 0.4% (group not specified) | NR |
| Sweden | PA School 6 months I =124 | Waitlist | NR | NR/NR | NR | NR | NR | NR |
| USA | PA Nil: end of intervention I = 107 | Active comparison ‐ health education programme to promote healthful diet and activity patterns via newsletters and delivering health education lectures | NR | NR/no change No difference in percent of underweight RR 1.11 (95% CI 0.3 to 4.0) | No effect Overconcern with | Self‐perceived body shape | NR | Children’s Depression Inventory |
| Germany | D and PA Nil: end of intervention I = 427 | Usual care | NR | Waist circumference of children < 10th centile for weight did not differ between the intervention and control group (P = 0.373)/NR | NR | NR | NR | NR |
| C: control; D: diet; I: intervention; MD: mean difference; NR: not reported; PA: physical activity; PE: physical education; RD: risk difference; RR: risk ratio; SE: standard error; zBMI: body‐mass index z score | ||||||||
| Study name | Intervention type | Control | Unhealthy weight control | Binge eating | Clinical levels of shape or weight concern | Body satisfaction (body image) | Self‐acceptance/self‐worth | Depressive symptoms | Anxiety |
| USA | D and PA School 6 months I = 358 | Attention control programme covering common health topics | NR | NR | NR | NR | NR | No effect: | No effect: P = 0.52 |
| USA | PA School 8 months I = 84 C = 106 | Regular PE class and minimal intervention (written materials on healthy eating and physical activity at baseline) | No difference | No difference Percent in past month I = 10.8%, n = 84; C = 19.3%, n = 106; P = 0.29 | NR | NR | No difference between groups (scale 5‐20; higher score is better) Self‐worth: mean I = 14.73, n=84; C = 14.16, n = 106; P = 0.33 | NR | NR |
| USA | PA School 5 months I = 182 | All‐girls PE class during the 1st semester then usual care PE | No difference | No difference Percent in past month I = 6.0%, n = 182; C = 11.4%, n = 174; ES = −5.41; P = 0.12* | NR | No difference | Different Improved self‐worth (Harter scale (scale 5‐20) | NR | NR |
| Australia | D and PA School 11 months I =347 | Usual school class | NR | NR | No differences between groups Girls: I = 28/65 (18%); C = 37/52 (19%) Boys: I = 2/100 (2%); C = 3/67 (2%) | NR | NR | NR | NR |
| C: control; D: diet; ES: Effect size Difference between intervention and control values at follow up*; I: intervention; MD: mean difference; NR: not reported; PA: physical activity; PE: physical education; RD: risk difference; RR: risk ratio; SE: standard error; zBMI: body‐mass index z score | |||||||||
NR=Not reported
ES Effect size* = Intervention effects are estimates that represent the difference in the outcome variable at post‐class or follow‐up in intervention condition compared to control condition, adjusted for age, race, and school as
a random effect in addition to baseline value of the outcome. P‐values are calculated from the associated t‐statistic having 10 df.
| Age group | Outcome | Intervention type | ||||
| Dietary | Physical activity | Diet and physical activity | Total BMI | Total zBMI | ||
| 0‐5 years | BMI | 1 | 4 | 11 | 16 | |
| zBMI | 1 | 4 | 15 | 20 | ||
| 6‐12 years | BMI | 5 | 13 | 25 | 43 | |
| zBMI | 7 | 6 | 18 | 31 | ||
| 13‐18 years | BMI | 2 | 5 | 6 | 13 | |
| zBMI | 0 | 1 | 6 | 7 | ||
| Total | 72 | 58 | ||||
| BMI: body‐mass index; zBMI: body‐mass index z score | ||||||
| Children aged 0‐5 years | |||
| Setting | Intervention type | ||
| Diet | Physical activity | Diet and physical activity | |
| Home | |||
| Childcare | |||
| Healthcare | |||
| Wider community | |||
| School | ‐ | ‐ | ‐ |
| Count | 1 | 4 | 11 |
| BMI: body‐mass index | |||
| Children aged 6‐12 | |||
| Setting | Intervention type | ||
| Diet | Physical activity | Diet and physical activity | |
| Home | ‐ | ‐ | ‐ |
| Childcare | ‐ | ‐ | ‐ |
| Healthcare | ‐ | ‐ | ‐ |
| Wider community | |||
| School | |||
| Count | 5 | 13 | 25 |
| BMI: body‐mass index | |||
| Children aged 13‐18 years | |||
| Setting | Intervention type | ||
| Diet | Physical activity | Diet and physical activity | |
| Home | |||
| Childcare | ‐ | ‐ | ‐ |
| Healthcare | ‐ | ‐ | ‐ |
| Wider community | ‐ | ‐ | ‐ |
| School | |||
| Count | 2 | 5 | 6 |
| BMI: body‐mass index | |||
| Children aged 0‐5 years | |||
| Setting | Intervention type | ||
| Diet | Physical activity | Diet and physical activity | |
| Home | |||
| Childcare | |||
| Healthcare | |||
| Wider community | |||
| School | ‐ | ‐ | ‐ |
| Count | 1 | 4 | 15 |
| zBMI: body‐mass index z score | |||
| Children aged 6‐12 years | |||
| Setting | Intervention type | ||
| Diet | Physical activity | Diet and physical activity | |
| Home | |||
| Childcare | |||
| Healthcare | |||
| Wider community | |||
| School | |||
| Count | 7 | 6 | 18 |
| zBMI: body‐mass index z score | |||
| Children aged 13‐18 years | |||
| Setting | Intervention type | ||
| Diet | Physical activity | Diet and physical activity | |
| Home | ‐ | ‐ | |
| School | ‐ | ||
| Count | 0 | 1 | 6 |
| zBMI: body‐mass index z score | |||
Study design
We included 108 cluster‐RCTs and 45 RCTs in this review (n=210 references).
Participants
Most RCTs were conducted in North America (n = 77, 50%), with most of these in the USA (n = 69; 45%); the remainder were conducted in Europe (n = 45, 29%), Australasia (n = 15, 10%), Asia (n = 7, 5%), South America (n = 6, 4%); and the Middle East and North Africa (n = 3, 2%) (Figure 3). Based on the World Bank classification of countries by income, most RCTs were conducted in high‐income countries (n = 139; 91%) with 13 (8%) in upper‐middle‐income countries, and one (1%) in a lower‐middle‐income country (Appendix 6). We categorised settings as 'school' including primary, middle and secondary schools (n = 91, 59%), 'community' (n = 23, 15%), 'health care' (n = 6, 4%), 'childcare' including nurseries; child‐care centres; kindergartens and preschools (n = 22, 14%) and 'home' (n = 11, 7%). Twenty‐two (14%) RCTs included more than one setting, for example school‐based RCTs with homework or parental involvement were also classed as ‘home‐based’. For the purpose of meta‐analyses, we placed RCTs into subgroups according to the main setting, that is, the setting where most of the intervention was carried out. Of the 153 included RCTs, 39 (25%) targeted children aged 0 to 5 years, 85 (56%) targeted children aged 6 to 12 years, one included children aged 0 to 5 and 6 to 12, and 29 (19%) RCTs targeted children aged 13 to 18 years (Figure 3).
Interventions
Ninety‐three (61%) RCTs included a combination of diet and physical activity intervention. Thirty‐nine (21%) RCTs compared physical activity with control and 21 (14%) RCTs compared diet‐only with control (Figure 3). Ninety‐one (59%) RCTs reported some form of theoretical underpinning, the most common being Social Cognitive Theory (Table 1, Table 2, Table 3). Thirty five (23%) RCTs took measures to address potential inequalities in the development of the intervention or the design of the RCT; 15 in the 0 to 5 age group, 17 in the 6 to 12 age group, and four in the 13 to 18 age group. One hundred and sixteen RCTs (76%) were interventions that were implemented for 12 months or less, 25 (16%) for one to two years, and 12 (8%) were implemented for more than two years.
There were 15 (10%) RCTs that had more than one intervention group; 12 of these types of RCTs evaluated various components such as targeting or including parents (Beech 2003; Haerens 2006), different strategies (Bonsergent 2013; Wilksch 2015; Williamson 2012), or settings (Crespo 2012), online only versus online plus text messaging (Lana 2014), different diets/nutrition advice (Epstein 2001; Paineau 2008; Papadaki 2010; Paul 2011), and different types/intensities of physical activity (Salmon 2008). We did not analyse the effects of these various components as they were outside the scope of the review. We did, however, include all the comparison groups (where data allowed) in the meta‐analyses compared to control.
Three (2%) RCTs (Meng 2013; Sevinc 2011; Warren 2003), directly evaluated dietary interventions versus physical activity interventions and were head‐to‐head comparisons that fulfilled our inclusion criteria (see Objectives). Unfortunately, only one of these RCTs (Meng 2013), reported data suitable for inclusion in meta‐analyses, so we did not undertake meta‐analysis of head‐to‐head comparisons of diet and physical activity but described the results narratively.
We have given additional details about the interventions for each study in the Characteristics of included studies tables.
Settings
In terms of settings, the included studies were conducted in a range of difference places: childcare (n = 22); healthcare (n = 6); home (n = 11); school (n = 90); and the wider community (n = 24). In children aged 0 to 5 years: childcare (n = 22); healthcare (n = 5); home (n = 6); school (n = 2); and the wider community (n = 4). In children aged 6 to 12 years: home (n = 3); school (n = 64); and the wider community (n = 18). In children aged 13‐18 years: healthcare (n = 1); home (n = 2); school (n = 24); and the wider community (n = 2).
We looked at the change in the profile of settings for interventions to prevent childhood obesity before 2011 (earlier) compared with 2011 to 2015 (later), given the call for more upstream interventions over the last 10 to 15 years. Overall, we did not see any clear trend for a shift towards more upstream interventions over time. In children aged 0 to 5 years, settings in earlier studies included childcare (n = 7) and home (n = 2); later studies included childcare (n = 15), healthcare (n = 5), home (n = 4), school (n = 2) and the wider community (n =4 ). In children aged 6 to 12 years, settings in earlier studies included home (n = 2), school (n = 29) and the wider community (n = 12); later studies included home (n = 1), school (n = 35) and the wider community (n = 6). In children aged 13 to 18 years, settings in earlier studies included healthcare (n = 1), home (n = 1), school (n = 10) and the wider community (n = 1); later studies included home (n = 1), school (n = 14) and the wider community (n = 1).
Comparisons
The type of control comparison groups varied across the 153 RCTs (Table 4), the vast majority of RCTs included ‘no intervention’, ‘usual care’ or ‘waiting list’ comparisons. We considered these three to be essentially similar because usual care in a prevention intervention is no intervention. There were also RCTs that included relatively more active control comparisons (not expected to affect outcomes of interest) such as school‐readiness programmes, self‐esteem programmes, an alcohol and drug programme, health and safety programmes, general health programmes and self‐help programmes. In many cases, particularly in school‐based RCTs, it was not always clear whether the intervention was instead of, or as well as, the usual care condition (i.e. standard diet and physical activity curriculum); for this reason we included these types of RCTs (i.e. those with a concomitant intervention component) along with those RCTs that included no‐intervention comparisons, usual‐care comparisons and waiting‐list comparisons. These variations in the type of control comparison groups should be borne in mind when considering the results of the meta‐analyses.
Outcomes
Details of all outcomes reported in RCTs can be found in Characteristics of included studies. The most common measures of adiposity reported were zBMI and BMI. Sixteen RCTs reported adverse events.
Funding sources
Funding sources 0 to 5 years
The majority of RCTs declared non‐industry funding in their publications, that is, not‐for‐profit charitable organisations and government institutes (n = 28; 72%). See Table 5. No RCTs were funded wholly by industry. Five RCTs (13%) (Daniels 2012; De Vries 2015; Paul 2011; Puder 2011; Roth 2015), described mixed funding from both industry and not‐for‐profit organisations, of which three included sponsorship from baby food manufacturers (Daniels 2012; Paul 2011; Puder 2011). Another two declared that both research and writing of the trial reports had been done independently from the funders: Puder 2011 received industry funding from two organisations that make infant nutrition, Wyeth Nutrition (https://www.wyethnutrition.com/), and Nestlé (www.nestlefoundation.org/e/research.html), and Roth 2015 was partially funded by a grant from a health insurance organisation, Barmer Ersatzkasse (www.barmer.de/en). Both RCTs had industry funding mediated through not‐for‐profit foundations, a grant from the Wyeth foundation, and an “unrestricted educational grant from Nestlé” (Puder 2011). Three RCTs that received some industry sponsorship did not report if the research and writing were independent of funding. Sponsorship for De Vries 2015 derived from a telecommunications firm, Hutchison‐Whampoa (www.ckh.com.hk), Daniels 2012 from an infant food manufacturer, HJ Heinz (www.heinzbaby.co.uk/), and the third, Paul 2011, was given infant food for the research by Gerber, a subsidiary of Nestlé (medical.gerber.com/).
Funding sources 6 to 12 years
The majority of RCTs declared non‐industry funding in their publications (69; 81%). See Table 5. One study reported being funded by industry (Damsgaard 2014). This funding came from food sponsors, who provided foods for the study (Danæg A/S, Naturmælk, Lantmännen A/S, Skærtoft Mølle A/S, Kartoffelpartnerskabet, AkzoNobel Danmark, Gloria Mundi, and Rose Poultry A/S), and a charitable trust from a bank (Nordea Foundation). Sponsorship was independent of the research and writing. Seven RCTs described mixed funding from both industry and not‐for‐profit organisations, of which two reported that both research and writing of the trial reports had been done independently from the funders. James 2004 had sponsorship from the pharmaceutical industry: Glaxo Smith Klein (www.gsk.com/en‐gb/); Aventis (www.sanofi.com/en/); and Pfizer (www.pfizer.com/). Paineau 2008 received funding from CEDUS (www.sucre‐info.com/le‐cedus/), the professional organisation for the sugar beet sector in France. Five RCTs did not report if research or writing were independent of funding: Grydeland 2014 (chocolate manufacture); Kain 2014 (food processing company); Muckelbauer 2010 (association of the German water and gas industries); Papadaki 2010 (food provided by numerous sponsors including Coca‐Cola, Kelloggs and Unilever); Rodearmel 2006 (W.K. Kellogs Institute for Food and Nutrition Research).
Funding sources 13 to 18 years
The majority of RCTs declared non‐industry funding in their publications (26; 90%). See Table 5. Two RCTs stated they received no funding at all for their research (Shin 2015; Weeks 2012). Two RCTs received funding from both non‐industry and industry sources. Bonsergent 2013 received industry funding from The Wyeth foundation (owned by Nestlé), and research and writing were independent of this funding. Patrick 2006 reported that three study authors were co‐owners and received income from The Centre for Health Interventions, San Diego, California, which was developing products related to the trial.
Theoretical basis of interventions
Forty‐nine per cent (19/39) of RCTs of children aged 0 to 5 years, 56% (48/85) of RCTs of children aged 6 to 12 years, and 70% (21/30) of RCTs of children aged 13 to 18 years reported a theoretical basis informing the study design. In total, we identified 35 different theories (Table 1; Table 2; Table 3; Appendix 7).
Included RCTs used three theories (precaution adaption process model, socioecological model, and theory of planned behaviour) in interventions given to children of 0 to 5, and 13 to 18 years. We found the health belief model in interventions given to 0 to 5 year olds, and 6 to 12 year olds; the social learning theory in RCTs given to children aged 6 to 12, and 13 to 18 years. All three age groups received interventions based on self‐determination theory and social cognitive theory (Table 1; Table 2; Table 3; Appendix 7).
There were 11 theories underpinning interventions for 0 to 5 year olds, of which four were unique (anticipatory guidance; attachment theory; exposure theory; theories of information processing).
There were 14 theories underpinning interventions of children aged 6 to 12, of which 10 were unique (family systems theory; sociocultural theory; ecological and developmental systems theories; environmental change theory; group socialisation theory; investigation, vision, action and change methodology; health promotion model; behavioural choice theory; theory of reasoned action, constructivism; and youth development and resiliency‐based approaches). Of the 85 RCTs of children aged 6 to 12, the most predominant theory used was social cognitive theory.
There were 12 theories underpinning interventions for 13 to 18 year olds, seven theories were unique (skills model; information‐motivation behavioural control theory; implementation intentions; attitude, social influence and self‐efficacy (ACE model); socio‐ecological model, self‐determination theory; and theory of interactive technology). Of the 29 RCTs of children aged 13 to 18 years the most predominant theory used was social cognitive theory.
Implementation factors
Economic information
All RCTs reported details of personnel who delivered the intervention (Characteristics of included studies). Only one study out of all 153 RCTS included a formal economic evaluation (Llargues 2012). This was for the AVall programme for 6 to 12 year olds (Llargues 2011; Mora 2015). Six of 39 RCTs for children aged 0 to 5 years reported on intervention costs (Bonvin 2013; Campbell 2013; Klein 2010; Natale 2014; Reilly 2006; Rush 2012). Seven of 85 RCTs for children aged 6 to 12 years reported intervention costs (Brandstetter 2012; Coleman 2005; Hendy 2011; Kipping 2008; Martinez‐Vizcaino 2014; Rush 2012; Vizcaino 2008). Two of 30 RCTs for children aged 13 to 18 years, reported on direct intervention costs (Christiansen 2013; Ebbeling 2006).
Strategies to address disadvantage/diversity 0 to 5 years
Fifteen RCTs adopted a range of methods to ensure diversity or to moderate the effects of disadvantage. Seven RCTs included either cultural training for staff delivering interventions (Fitzgibbon 2011; Harvey‐Berino 2003), or had modified, tailored or specifically designed interventions for specific cultural settings (Fitzgibbon 2006; Natale 2014; Puder 2011; Slusser 2012; Story 2012). Two RCTs specifically set out to address diversity by selecting specific communities (Fitzgibbon 2005; Fitzgibbon 2006), and seven adopted recruitment strategies aimed at increasing diversity (Annesi 2013; Bellows 2013a; Haines 2013; Nemet 2011; Ostbye 2012; Skouteris 2016; Wen 2012). Two RCTs described methods they used to overcome environmental barriers to participation related to inequality (Fitzgibbon 2005; Fitzgibbon 2011).
Strategies to address disadvantage/diversity 6 to 12 years
Seventeen RCTs adopted strategies to address disadvantage/diversity. Methods to address issues of diversity and inequity included involving participant groups in the design and delivery of the intervention (Baranowski 2003; Beech 2003; Robinson 2003; Story 2003), specifically tailoring the interventions to be culturally relevant (Brown 2013; Caballero 2003; Coleman 2005; De Heer 2011; Gutin 2008; Habib‐Mourad 2014; Robbins 2006; Robinson 2003; Robinson 2010; Stolley 1997; Story 2003), consideration of language (Spiegel 2006), and specifically addressing the intervention for populations at risk of inequity (Habib‐Mourad 2014; Haire‐Joshu 2010; Levy 2012; Madsen 2013). In addition to the RCTs that reported intervention strategies to address disadvantage/diversity, 15 RCTs reported on recruitment strategies to address disadvantage/diversity.
Strategies to address disadvantage/diversity 13 to 18 years
Of the 30 RCTs targeted towards the 13 to 18 years age group, one study reported incorporating intervention strategies (Shin 2015), and three RCTs reported on recruitment strategies to address disadvantage/diversity (Lubans 2011; Singh 2009; Smith 2014).
Other aspects of implementation from process evaluations
It is worth noting that many of the included RCTs across all age groups reported one or more elements of process evaluation, including dose, exposure, attendance, adherence, intervention fidelity, feasibility of intervention, child satisfaction or acceptability, reach, and retention.
Donnelly 2009 reported intensity of lesson delivery. This RCT also investigated the effect of teacher participation in classroom physical activity. They found that teacher participation in the activity appeared to positively influence student activity levels in the study.
Child or teacher (or intervention deliverer) satisfaction with the intervention was a relatively common factor to measure in the studies we included in this review. In previous versions of this Cochrane Review, we highlighted the important link between how much the child and teacher enjoy the intervention (and, particularly for younger children, whether they consider it to be ‘fun’), and recruitment, adherence and retention.
Many of the process evaluations raised practical issues relating to the intervention, which were barriers or facilitators of implementation. For example, Kipping 2008 reported that teachers found it difficult to adhere to the intervention requirements as intervention lessons were difficult to accommodate into the school timetable. Robbins 2006 similarly identified important barriers to increasing physical activity in some girls, with lack of suitable places, resources and social support for physical activity limiting compliance with the intervention programme. Robinson 2003 explored barriers to attendance and found transportation to be an important factor. Coleman 2005 published implementation‐related information in a separate paper (Heath 2002), and provided recommendations to practitioners covering some of the contextual factors to consider when adapting the programme to their own context.
Habib‐Mourad 2014 reported on implementation, dose and context. Failure to succeed in modifying the school’s food environment was due to lobbying and lack of support of some of the school authorities. The study was based in Lebanon which is a politically unstable context, with security threats and social unrest.
Studies awaiting classification
Two RCTs require translation and are awaiting classification; these RCTs are listed in Characteristics of studies awaiting classification(Lichtenstein 2011; Walther 2011). RCTs identified that were ongoing at the time of the 2015 search have been listed under Characteristics of studies awaiting classification. We ran an update search from May 2015 to January 2018 to identify all potential RCTs for this review. This search identified 6342 unique records and we identified 315 papers to read in full (Figure 1). We have added these records to the category 'Studies awaiting classification'. Because we have not yet assessed these records for inclusion to the review, the table entries for these records are empty. Ongoing RCTs and those awaiting classification will be incorporated into future updates of this review.
Excluded studies
Studies excluded at full‐text stage are listed in Characteristics of excluded studies.
Risk of bias in included studies
The Characteristics of included studies reports the risk of bias results for the 153 included RCTs. We present a 'Risk of bias' graph (Figure 4) with review authors' judgements about each 'Risk of bias' item presented as percentages across all included RCTs. We present a 'Risk of bias' summary (Figure 5), with review authors' judgements about each 'Risk of bias' item for each included study. When a study included insufficient information in the relevant papers to allow us to make a judgement for a particular domain, we gave RCTs a rating of unclear.

'Risk of bias' graph: review authors' judgements about each 'Risk of bias' item presented as percentages across all included studies

'Risk of bias' summary: review authors' judgements about each 'Risk of bias' item for each included study
Allocation
In RCTs included in the meta‐analyses, we rated relatively few RCTs as ‘high’ risk of bias. Often, study reports did not clearly specify sequence generation and allocation concealment; half of the RCTs (55/110) were at ‘low’ risk of bias for generation of random sequence, with nearly half, 47% (52/110) without enough information to allow us to make a judgement. There were similar proportions for allocation concealment, 38% (42/110) at ‘low’ risk of bias and 52% (57/110) at ‘unclear’. For those RCTs that were not included in the meta‐analyses, 10% (4/42) were at high risk of bias for random sequence generation and the proportion with insufficient information on which to make a judgement 32/42 (76%) was much higher than for RCTs that were included in the meta‐analysis; 74% (31/42) of RCTs did not report enough information for allocation concealment.
Blinding
We rated a quarter (27/110) of RCTs included in the meta‐analyses as ‘high’ risk of bias. With 44% providing insufficient information to judge bias and 30% (34/110) rated as ‘low’ risk of bias. For RCTs not included in the meta‐analyses the proportions were similar, with a higher proportion reporting insufficient information to judge bias (50% (21/42). It is feasible to obscure how interventions were allocated from the outcome assessors; however it is not possible to conceal allocation of interventions from the participants themselves. Especially in RCTs with individual randomisation. Therefore, a 'high' risk of bias judgement is to be expected for this item.
Incomplete outcome data
We rated 26% (29/110) of RCTs, included in the meta‐analyses, as high for attrition bias. In most cases this was because more than 30% of participants were lost to follow‐up and analyses did not account for attrition. Other reasons included: unbalanced completion rates in study groups; not providing reasons for missing data; not providing missing data by study group; and differences in characteristics related to study outcomes between completers and non‐completers. We rated 62% (68/110) of RCTs as low risk of bias from missing data. We based our decisions on the provision of an adequate description of participant flow through the study and with missing outcome data relatively balanced between groups and judged to be unlikely to be related to the outcomes of interest.
We assessed similar proportions of RCTs, not included in the meta‐analyses, as high risk of bias (29%, 12/42) but there were fewer at low risk of bias (52%, 22/42).
We rated relatively few RCTs, included in the meta‐analysis, 12% (13/110) as unclear for attrition bias, mainly because they did not adequately report participant flow. Of RCTs, not included in the meta‐analyses, we assessed a greater proportion (19%; 8/43) as unclear risk of bias.
Selective reporting
We rated 51% (56/110) of RCTs included in the meta‐analyses as ‘low’ risk of bias whereas a much lower proportion of 21% (9/42) were ‘low’ risk of bias for RCTs that were not included in the meta‐analyses. Only four RCTs included in the meta‐analyses were recorded as high risk of bias whereas 14% (6/42) of those not included in the meta‐analyses were high risk of bias. The reasons that studies, in the meta‐analyses, acquired a grade of 'High' risk of bias included: failure to report outcomes of BMI or zBMI despite these outcomes being listed, a priori, in trial registers/ protocols or reporting of BMI or zBMI when these outcomes had not been prespecified in trials registers or protocols. There were many RCTs, 64% of those in the meta‐analyses and 45% for those not included in the meta‐analyses, that had no prespecified record, either protocol or trial registration report, of the planned clinical trial.
Other potential sources of bias
We categorised 'other' bias as risk of study contamination and the majority, 90% (99/110) of RCTs in the meta‐analyses, were low risk of bias. We rated three RCTs (3%) as 'high' risk and eight (7%) as 'unclear' risk. The proportions of RCTs assessed as low (93%), high (0%) or unclear (7%) risk were very similar for RCTs without data in the meta‐analyses, and those judged to be at ‘high’ risk were at risk of contamination.
Timing of recruitment of clusters
This assessment related only to cluster‐RCTs. We judged RCTs as high risk of bias if they had recruited the clusters after randomisation. The majority of RCTs, both those included in the meta‐analyses (69%) and those not included in the analyses (74%), were at low risk of bias. Approximately a third of RCTs did not have enough information to allow us to make a judgement: 26% (21/81) of RCTs in the meta‐analyses, and 26% (7/27) of RCTs not in the meta‐analyses. Six per cent (5/81) of RCTs in the meta‐analyses had recruited participants after randomisation and were at 'high' risk of bias. No RCTs not in the meta‐analyses had recruited participants after randomisation.
Publication bias, or small study effect
None of the meta‐analyses with more than 10 studies had evidence of funnel plot asymmetry as tested using the Egger test (Egger 1997a). P values ranged from 0.304 to 0.958. This indicates we could find no evidence of small study effects or publication bias. See Figure 6.

Funnel plots of all comparisons with more than 10 studies. A Funnel plot of comparison 3. Diet and physical activity interventions versus control in children aged 0‐5 years. Outcome: zBMI. No evidence of asymmetry (Egger test P = 0.958). B Funnel plot of comparison 3. Diet and physical activity interventions versus control in children aged 0‐5 years. Outcome: BMI. No evidence of asymmetry (Egger test P = 0.529). C Funnel plot of comparison 5. Physical activity interventions versus control in children aged 6‐12. Outcome: BMI. No evidence of asymmetry (Egger test P = 0.763). D Funnel plot of comparison 6. Physical activity interventions versus control in children aged 6‐12. Outcome: zBMI. No evidence of asymmetry (Egger test P = 0.304). E Funnel plot of comparison 6. Physical activity interventions versus control in children aged 6‐12. Outcome: BMI. No evidence of asymmetry (Egger test P = 0.768).
Effects of interventions
See: Summary of findings for the main comparison Dietary interventions compared to control for preventing obesity in children aged 0 to 5 years; Summary of findings 2 Physical activity interventions compared to control for preventing obesity in children aged 0 to 5 years; Summary of findings 3 Diet and physical activity interventions combined compared to control for preventing obesity in children aged 0 to 5 years; Summary of findings 4 Adverse event outcomes for dietary combined with physical activity interventions compared to control in children aged 0 to 5 years; Summary of findings 5 Dietary interventions compared to control for preventing obesity in children aged 6 to 12 years; Summary of findings 6 Physical activity interventions compared to control for preventing obesity in children aged 6 to 12 years; Summary of findings 7 Adverse event outcomes for physical activity interventions compared to no intervention in children aged 6 to 12 years; Summary of findings 8 Diet and physical activity interventions combined compared to control for preventing obesity in children aged 6 to 12 years; Summary of findings 9 Adverse event outcomes for dietary combined with physical activity interventions compared to no intervention or usual care for preventing obesity in children aged 6 to 12 years; Summary of findings 10 Diet interventions compared to control for preventing obesity in children aged 13 to 18 years; Summary of findings 11 Physical activity interventions compared to control for preventing obesity in children aged 13 to 18 years; Summary of findings 12 Adverse events outcomes for physical activity interventions compared to control in children aged 13 to 18 years; Summary of findings 13 Diet and physical activity interventions combined compared to control for preventing obesity in children aged 13 to 18 years; Summary of findings 14 Adverse event outcomes for dietary combined with physical activity interventions compared to control for preventing obesity in children aged 13 to 18 years; Summary of findings 15 Dietary interventions compared to physical activity interventions for preventing obesity in children aged 6 to 12 years; Summary of findings 16 Diet and physical activity interventions combined compared to physical activity interventions alone for preventing obesity in children aged 6 to 12 years; Summary of findings 17 Dietary interventions alone compared to diet and physical activity interventions combined for preventing obesity in children aged 6 to 12 years
Summary of outcomes
zBMI
Fifty‐eight RCTs reported zBMI, 20 in the age group 0 to 5, 31 in the age group 6 to 12, and seven in the age group 13 to 18 years. We have given a full breakdown of RCTs reporting zBMI grouped by intervention type, and age group in Table 9 and Table 10.
BMI
Seventy‐two RCTs reported BMI, 16 in the age group 0 to 5; 43 in the age group 6 to 12; and 13 in the age group 13 to 18 years. We have given a full breakdown of RCTs reporting BMI grouped by intervention type and age group in Table 9 and Table 11.
Adverse events
Sixteen RCTs reported adverse events, four in the 0 to 5 age group (Table 6), eight in the 6 to 12 age group (Table 7), and four in the 13 to 18 age group (Table 8).
Comparison 1: age 0 to 5 years, dietary interventions versus control
zBMI
Moderate‐certainty evidence from one RCT (520 participants) indicated that dietary interventions versus control for preventing obesity did not reduce zBMI scores in children aged 0 to 5 years. The mean difference in zBMI was −0.14 (95% confidence interval (CI) −0.32 to 0.04). See Analysis 1.1 and summary of findings Table for the main comparison.
BMI
No studies reported BMI.
Adverse events
No studies reported adverse events.
Comparison 2: age 0 to 5 years, physical activity interventions versus control
zBMI
High‐certainty evidence from four RCTs (1053 participants) indicated that physical activity interventions versus control for preventing obesity did not reduce zBMI in children aged 0 to 5 years. The mean difference in zBMI was 0.01 (95% CI −0.10 to 0.13). See Analysis 2.1 and summary of findings Table 2. We found no differences in subgroup by setting.
BMI
High‐certainty evidence from five RCTs (2233 participants) indicated that physical activity interventions versus control for preventing obesity did not reduce BMI in children aged 0 to 5 years. The mean difference in BMI was −0.22 kg/m2 (95% CI −0.44 kg/m2 to 0.01 kg/m2). See Analysis 2.2 and summary of findings Table 2. We found no differences in subgroup by setting.
Adverse events
No studies reported adverse events.
Comparison 3: age 0 to 5 years, diet and physical activity interventions versus control
zBMI
Moderate‐certainty evidence from 16 RCTs (6261 participants) indicated that combined diet and physical activity interventions versus control for preventing obesity lead to a small reduction of zBMI in children aged 0 to 5 years. The mean difference in zBMI was −0.07 (95% CI −0.14 to −0.01). See Analysis 3.1 and summary of findings Table 3. We found no differences in subgroup by setting or duration of intervention.
BMI
Moderate‐certainty evidence from 11 RCTs (5536 participants) indicated that combined diet and physical activity interventions versus control for preventing obesity reduce BMI in children aged 0 to 5 years. The mean difference in BMI was −0.11 kg/m2 (95% CI −0.21 kg/m2 to 0.00 kg/m2). See Analysis 3.3 and summary of findings Table 3. We found no differences in subgroup by duration of intervention.
Subgroup analyses of settings revealed that there were differences in effect of interventions based upon setting in which they were delivered (Chi² = 12.31, df = 2 (P = 0.002), I² = 83.8%). Evidence from two RCTs delivered at home (778 participants) indicated that diet and physical activity interventions reduced BMI (mean difference (MD) −0.33 kg/m2, 95% CI −0.55 kg/m2 to −0.10 kg/m2) and one RCT of 75 participants set in the wider community, found a large reduction in BMI (MD −0.59 kg/m2, 95% CI −0.94 kg/m2 to −0.24 kg/m2) but this RCT was at high risk of bias for blinding and with just 75 participants was also imprecise. Data from eight RCTs of diet and physical activity interventions delivered in a childcare or preschool setting showed no evidence of effect on BMI (MD −0.05 kg/m2, 95% CI −0.14 kg/m2 to 0.05 kg/m2). See Analysis 3.3 and summary of findings Table 3.
Adverse events
Four RCTs reported five types of adverse event; infection, injury, accident, sufficiency of weight gain in infants and a catch‐all of 'adverse events’. See Table 6 and summary of findings Table 4. In assessing the safety of the ‘Soothe/Sleep’ and introduction of solids’ interventions on weight status in terms of sufficiency of weight gain, Paul 2011 reported that they had detected no significant differences among treatment groups for insufficient weight gain. Fitzgibbon 2006 reported there were no adverse events during the study although they provided no data or information on what measures they used. Puder 2011 reported that there were no injuries or other adverse events during physical activity sessions in the intervention classes. Roth 2015 reported that the physical activity intervention did not lead to a significant difference between the intervention and control group in rates of accidents and infections.
None of the RCTs reported that the interventions led to more adverse events than the control. There is no evidence that diet and physical activity interventions adversely affect any of these outcomes. However, for the outcomes of insufficient weight gain and infections we have little certainty of the evidence because it is drawn from few participants, a single RCT or RCTs at high risk of bias.
Comparison 4: age 6 to 12 years, dietary interventions versus control
zBMI
High‐certainty evidence from nine RCTs (7231 participants) indicated that dietary interventions versus control for preventing obesity do not affect zBMI in children aged 0 to 5 years (MD −0.03, 95% CI −0.06 to 0.01). See Analysis 4.1 and summary of findings Table 5. We found no differences in subgroup by setting.
BMI
High‐certainty evidence from six RCTs (5061 participants) indicated that dietary interventions versus control for preventing obesity do not affect BMI in children aged 0 to 5 years (MD −0.02 kg/m2, 95% CI −0.11 kg/m2 to 0.06 kg/m2). See Analysis 4.2 and summary of findings Table 5. We found no differences in subgroup by setting.
Adverse events
No studies reported adverse events.
Comparison 5: age 6 to 12 years, physical activity interventions versus control
zBMI
Moderate‐certainty evidence from eight RCTs (6841 participants) indicated that physical activity interventions versus control for preventing obesity do not affect zBMI in children aged 6 to 12 years (MD −0.02, 95% CI −0.06 to 0.02). See Analysis 5.1 and summary of findings Table 6. We found no differences in subgroup by setting.
BMI
Moderate‐certainty evidence from 14 RCTs (16,410 participants) indicated that physical activity interventions versus control for preventing obesity reduce BMI in children aged 6 to 12 years (MD −0.10kg/m2, 95% CI −0.14 kg/m2 to −0.05 kg/m2). See Analysis 5.3 and summary of findings Table 6. We found no differences in subgroup by setting.
Adverse events
One RCT (Li 2010a), reported that children who received physical activity interventions versus control did not have any additional physical injuries compared to those who were assigned to the control group. However, we are a little uncertain of the evidence as it is drawn from a single RCT with one domain at high risk of bias. Three RCTs reported that their physical activity interventions did not cause underweight (high‐certainty evidence). A culturally tailored after‐school dance and screen‐time‐reduction intervention (Robinson 2010), for low‐income, preadolescent African‐American girls significantly reduced depressive symptoms, and there was no evidence for increased weight concerns or body dissatisfaction. However, we have little confidence in the evidence because it is drawn from few participants. See Table 7 and summary of findings Table 7.
Comparison 6: age 6 to 12 years, diet and physical activity interventions versus control
zBMI
Low‐certainty evidence from 20 RCTs (24,043 participants) indicated that combined diet and physical activity interventions versus control for preventing obesity reduce zBMI in children aged 6 to 12 years (MD −0.05, 95% CI −0.10 to −0.01). See Analysis 6.1 and summary of findings Table 8. We found no differences in subgroup by setting.
BMI
Low‐certainty evidence from 25 RCTs (19,498 participants) indicated that combined diet and physical activity interventions versus control for preventing obesity did not reduce BMI in children aged 6 to 12 years (MD −0.05kg/m2, 95% CI −0.11 kg/m2 to 0.01 kg/m2). See Analysis 6.3, and summary of findings Table 8. We found no differences in subgroup by setting.
Adverse events
Five of the 52 studies targeting children aged 6 to 12 years assessed adverse or unintended consequences of the interventions. The studies used a variety of measures to assess adverse effects, including prevalence of underweight, unhealthy eating practices, teasing, stigmatisation, body image perceptions, satisfaction and self‐worth. The majority of studies did not report any adverse outcomes. One study (Beech 2003), reported similar numbers of visits to a healthcare provider in the intervention and control groups, but this evidence is very uncertain as the study was small and the number of events low. One study (HEALTHY Study Gp 2010), reported similar numbers of adverse events related to collection of blood samples in the intervention and control groups. This evidence is uncertain as, although the study was large (4603 participants), there were few events.
Two studies reported that the proportion of children underweight was similar among children who received the intervention and those who had the control (Foster 2008; HEALTHY Study Gp 2010; moderate‐certainty evidence). There is moderate‐certainty evidence from a third study, Siegrist 2013, who measured waist circumference of children below the 10th centile for weight, and several underweight children in both intervention and control groups showed a decrease in waist circumference. There were no significant differences between the intervention and control groups however. This suggests that these reductions were not related to the intervention. The study authors reported that this finding may indicate that normal and underweight children are attempting to lose weight independent of and during participation in lifestyle‐change interventions and they found no evidence that this was affected by the intervention.
Two studies reported high‐certainty evidence that concern about weight among the participants was similar between those children who received the intervention compared to those who did not (Beech 2003; Robinson 2010).
High‐certainty evidence from three studies reported no differences between children in the intervention groups and those in the control groups in the measure of body satisfaction (Beech 2003; Foster 2008;Robinson 2010). One RCT (Beech 2003), reported that children who received physical activity interventions did not have any additional physical injuries compared to those who were assigned to the control group. However, we are uncertain of the evidence as it is drawn from a single RCT with only 60 participants. See Table 7 and summary of findings Table 9.
Comparison 7: age 13 to 18 years, dietary interventions versus control
zBMI
No studies reported zBMI.
BMI
Low‐certainty evidence from two RCTs (294 participants) indicated that dietary interventions versus control for preventing obesity do not affect BMI in children aged 0 to 5 years (MD −0.13 kg/m2, 95% CI −0.50 kg/m2 to 0.23 kg/m2). See Analysis 7.1 and summary of findings Table 10. We found no differences in subgroup by setting.
Adverse events
No studies reported adverse events.
Comparison 8: age 13 to 18 years, physical activity interventions versus control
zBMI
Low‐certainty evidence from one RCT (100 participants) set in school indicated that physical activity interventions versus control for preventing obesity reduce zBMI score in children aged 13 to 18 years (MD −0.20, 95% CI −0.30 to −0.10). See Analysis 8.1. and summary of findings Table 11.
BMI
Very low‐certainty evidence from four RCTs (720 participants) indicated that physical activity interventions versus control for preventing obesity reduce BMI in children aged 13 to 18 years (MD −1.53 kg/m2, 95% CI −2.67 kg/m2 to −0.39 kg/m2). See Analysis 8.3 and summary of findings Table 11. We found no differences in subgroup by setting.
Adverse events
Two RCTs (Neumark‐Sztainer 2003; Neumark‐Sztainer 2010), reported four types of adverse event: unhealthy weight control behaviour, body satisfaction, unhealthy weight gain, self‐acceptance and binge eating (Table 8summary of findings Table 12). None reported that the interventions led to more adverse events than the control. However, for the outcome of body satisfaction we have little confidence in the evidence because it is drawn from one RCT of 190 participants (low‐certainty evidence). One RCT (Neumark‐Sztainer 2010), reported that unhealthy weight control behaviour in girls was improved as part of an evaluation of the impact of the New Moves school‐based intervention aimed at preventing weight‐related problems in adolescent girls. See Table 8 and summary of findings Table 12.
Comparison 9: age 13 to 18 years, diet and physical activity interventions versus control
zBMI
Low‐certainty evidence from six RCTs (16,543 participants) indicated that combined dietary and physical activity interventions versus control for preventing obesity do not affect zBMI score in children aged 13 to 18 years (MD 0.01, 95% CI −0.05 to 0.07). See Analysis 9.1 and summary of findings Table 13. We found no differences in subgroup by setting.
BMI
Low‐certainty evidence from eight RCTs (16,583 participants) indicated that combined dietary and physical activity interventions versus control for preventing obesity do not affect BMI in children aged 13 to 18 years (MD −0.02 kg/m2, 95% CI −0.10 kg/m2 to 0.05 kg/m2). See Analysis 9.3. and summary of findings Table 14. All studies were in one setting, school.
Adverse events
Two RCTs (Melnyk 2013; Wilksch 2015), reported three types of adverse event: depression; anxiety; and clinical levels of shape and weight concern (Table 8; summary of findings Table 14). None reported that the interventions led to more adverse events than the control. However, for the outcome of clinical levels of shape and weight concern we have little confidence in the evidence because it is drawn from one RCT of 282 participants (low‐certainty evidence). Wilksch 2015 reported on the efficacy of a five‐week obesity‐prevention programme (Life Smart) and two eating disorder‐prevention programmes (Media Smart and HELPP) against each other and a no‐intervention control condition. ‘Media Smart’ was the only programme to show benefit on disordered eating. Melnyk 2013 reported on the efficacy of a 15‐week COPE (Creating Opportunities for Personal Empowerment) programme, versus an attention control programme (Healthy Teens), on the healthy lifestyle behaviours, psychosocial outcomes, social skills, and academic performance of a culturally diverse sample of high school adolescents. Teens in the COPE group with extremely elevated depression scores at pre‐intervention had significantly lower depression scores than the Healthy Teens group (P = 0.02). See Table 8 and summary of findings Table 14.
Comparison 10: age 0 to 5 years, dietary interventions versus physical activity interventions
zBMI
No studies reported zBMI.
BMI
No studies reported BMI.
Comparison 11: age 6 to 12 years, dietary interventions versus physical activity interventions
zBMI
High‐certainty evidence from one RCT (1205 participants) indicated that dietary interventions have a similar effect to physical activity interventions on zBMI in children aged 6 to 12 years (MD −0.11, 95% CI −0.62 to 0.4). See Analysis 10.1 and summary of findings Table 15.
BMI
High‐certainty evidence from two RCTs (4917 participants) indicated that dietary interventions have a similar effect to physical activity interventions on BMI in children aged 6 to 12 years (MD −0.03 kg/m2, 95% CI −0.25 kg/m2 to 0.20 kg/m2). See Analysis 10.2 and summary of findings Table 15.
Comparison 12: age 13 to 18 years, dietary interventions versus physical activity interventions
zBMI
No studies reported zBMI.
BMI
No studies reported BMI.
Comparison 13: age 0 to 5 years, diet and physical activity interventions combined versus physical activity interventions
zBMI
No studies reported zBMI.
BMI
No studies reported BMI.
Comparison 14: age 6 to 12 years, diet and physical activity interventions combined versus physical activity interventions
zBMI
High‐certainty evidence from one RCT (3946 participants) indicated that combined diet and physical activity interventions have a similar effect to physical activity interventions on zBMI in children aged 6 to 12 years (MD −0.16, 95% CI −0.57 to 0.25). See Analysis 11.1 and summary of findings Table 16.
BMI
High‐certainty evidence from one RCT (3946 participants) indicated that combined diet and physical activity interventions have a similar effect to physical activity interventions on BMI in children aged 6 to 12 years (MD −0.04 kg/m2, 95% CI −1.05 kg/m2 to 0.97 kg/m2). See Analysis 11.2 and summary of findings Table 16.
Comparison 15: age 13 to 18 years, diet and physical activity interventions combined versus physical activity interventions
zBMI
No studies reported zBMI.
BMI
No studies reported BMI.
Comparison 16: age 0 to 5 years, diet and physical activity interventions combined versus dietary interventions
zBMI
No studies reported zBMI.
BMI
No studies reported BMI.
Comparison 17: age 6 to 12 years, diet and physical activity interventions combined versus dietary interventions
zBMI
High‐certainty evidence from one RCT (3971 participants) indicated that combined diet and physical interventions have a similar effect to dietary interventions on zBMI in children aged 6 to 12 years (MD 0.05, 95% CI −0.38 to 0.48). See Analysis 12.1 and summary of findings Table 17.
BMI
High‐certainty evidence from one RCT (3971 participants) indicated that combined diet and physical interventions have a similar effect to dietary interventions on BMI in children aged 6 to 12 years (MD −0.28 kg/m2, 95% CI −1.67 kg/m2 to 1.11 kg/m2). See Analysis 12.2 and summary of findings Table 17.
Comparison 18: age 13 to 18 years, diet and physical activity interventions combined versus dietary interventions
zBMI
No studies reported zBMI.
BMI
No studies reported BMI.
Heterogeneity
Age 0 to 5 years
There was only one study for the comparison of dietary interventions versus control, outcome BMI (Analysis 1.1), so an assessment of heterogeneity was not applicable. Heterogeneity measured using the I2 statistic was 0% for the meta‐analysis of zBMI of studies assessing physical activity versus control (Analysis 2.1). For Analysis 2.2, physical activity versus control, heterogeneity for the outcome BMI was 54%, and it was not reduced by the introduction of subgroups of setting or duration. We found moderate heterogeneity for the comparison diet and physical activity versus control, outcome zBMI, of I2 = 66% (Analysis 3.1), which was reduced in the subgroups 'childcare/preschool' to 16%, and 'wider community' to 0%, but increased to substantial levels in the subgroup 'home' to I2 = 86%. This subgroup had just three studies with divergent intervention effects. We found moderate heterogeneity for the comparison diet and physical activity versus control for the outcome BMI (Analysis 3.3), of I2 = 69%, which was reduced only for the subgroup 'home' to 0% but remained moderate for the subgroup 'childcare/preschool', which included most of the studies (I2 = 63%). Subgrouping by duration of intervention did not reduce heterogeneity for any comparison.
Age 6 to 12 years
We found no heterogeneity for the comparison of dietary interventions versus control, outcome BMI (Analysis 4.2), and moderate heterogeneity of I2 = 42% for the outcome zBMI (Analysis 4.1). All the RCTs in these comparisons were 12 months or less in duration and subgroups were not applicable. For Analysis 5.1, physical activity versus control, outcome zBMI, heterogeneity was moderate (I2 = 33%) and it was not reduced by the introduction of subgroups of setting or duration. There was very low heterogeneity for Analysis 5.3, physical activity versus control, outcome BMI, of I2 = 5%.
We found substantial heterogeneity for the comparison, diet and physical activity versus control, outcome zBMI (Analysis 6.1), of I2 = 87%. The heterogeneity was reduced in subgroup 'school' Just exceeding moderate levels I2 = 77%; however, for the subgroup 'wider community', heterogeneity increased to substantial levels, I2 = 94%. There was very low heterogeneity for Analysis 6.3, diet and physical activity versus control, outcome BMI, of I2 = 17%.
Age 13 to 18 years
We found no heterogeneity for the comparison of dietary interventions versus control, outcome BMI (I2 = 0%) (Analysis 7.1). There was only one study for the comparison of physical activity interventions versus control, outcome BMI (Analysis 8.1), and an assessment of heterogeneity was not applicable. For Analysis 8.3, physical activity versus control, outcome BMI, there were only four studies and heterogeneity was substantial, I2 = 93%. All four RCTs were in the 'school' setting subgroup with a duration of 12 months or less.
For Analysis 9.1, dietary and physical activity interventions combined versus control, outcome zBMI, there was substantial heterogeneity of the meta‐analysis of six RCTs I2 = 92%. All bar one of the studies was set in 'school', and subgrouping did not reduce heterogeneity measured by the I2 statistic value. However, subgrouping by duration (Analysis 9.2) reduced heterogeneity, those with interventions of 12 months or less had an I2 of 60% and for studies with a duration of more than 12 months, I2 = 57%.
For Analysis 9.3, dietary and physical activity interventions combined versus control, outcome BMI, there were only eight RCTs and heterogeneity was moderate at I2 = 58%. All were set in schools. Subgrouping by duration reduced heterogeneity in the studies that were less than 12 months (I2 = 18%) with studies of greater duration having higher heterogeneity, (I2 = 75%).
Equity and disadvantage
This review sought to identify studies that had reported on characteristics known to be important from an equity and disadvantage perspective. For this process, we utilised the PROGRESS (Place, Race, Occupation, Gender, Religion, Education, Socio‐economic status (SES), Social status) framework (Ueffing 2009). Where reported, interventions did not appear to increase health inequalities. We recorded where outcomes were analysed by any of the eight PROGRESS categories. For gender (the G in PROGRESS), 30 studies reported outcomes analysed by gender; seven studies in the 0 to 5 age group, 14 studies in the 6 to 12 age group, and nine studies in the 13 to 18 age group.
Subgroup analyses by gender in children aged 0 to 5 years
Seven of the 39 RCTs analysed the effects of the intervention by gender. One RCT indicated that their intervention had a greater effect in girls compared to boys for reducing BMI (Mo‐suwan 1998), and another for reducing skinfold thickness (De Vries 2015). In contrast, one study reported that BMI reduction in the intervention group occurred only in the boys (Klein 2010). Four RCTs reported no difference in the effect of the intervention, compared to control, on adiposity measures between boys and girls (Crespo 2012; Keller 2009; Nemet 2011; Story 2012).
Subgroup analyses by gender in children aged 6 to 12 years
Four of the 85 RCTs analysed the effects of the intervention by gender. Some of those RCTs that did not were interventions that only targeted boys or girls. Of the RCTs that did not undertake analysis by gender, 9 RCTs reported post hoc, subgroup analyses on gender and measures of adiposity, and reported no effect of the intervention compared to control on: zBMI (Elder 2014; Herscovici 2013; Johnston 2013; Khan 2014); BMI (Elder 2014; Herscovici 2013; Johnston 2013; Llargues 2012; Martinez‐Vizcaino 2014; Sevinc 2011); per cent body fat changes or weight gain in white girls only (Telford 2012).
Two RCTs indicated that, after the intervention, girls were less likely to be obese than boys (Cao 2015; Levy 2012), and three RCTs indicated that zBMI, BMI or per cent body fat were reduced, compared to control, in girls but not in boys (Grydeland 2014, Li 2010a; Williamson 2012). In contrast, two RCTs indicated that outcomes for boys were improved compared with those for girls for zBMI (Kain 2014), and per cent body fat (Williamson 2012). Martinez‐Vizcaino 2014 analysed several secondary adiposity‐related outcomes and found that some improved more in girls (skinfold thickness, per cent body fat) while others improved more in boys (waist circumference).
Subgroup analyses of gender in children age 13 to 18 years
Nine of the 29 RCTs for children aged 13 to 18 analysed results by gender. Five RCTs found no effect of intervention compared to control, by gender, on zBMI or BMI (Ebbeling 2006; Patrick 2006; Viggiano 2015; Weeks 2012; Wilksch 2015). Four RCTs assessed the effect of intervention by gender on secondary measures such as per cent body fat and skinfold thickness, and reported some differences in these measures between genders but no differences on zBMI or BMI (Black 2010; El Ansarai 2010; Haerens 2006; Singh 2009).
Subgroup analysis by socio‐economic status, migrant status, ethnicity and rural/urban setting in children aged 0 to 5 years
Five of the 39 RCTs reported on the effect of the intervention by socio‐economic status (SES). Two RCTs reported that interventions had greater effects in children from families with better educational levels or SES (Puder 2011; Rush 2012), one study reported that the intervention reduced zBMI more in children from a lower SES background compared to those from high‐SES (De Coen 2012). Two RCTs found no difference in the effect of the intervention by parental education level on zBMI (Campbell 2013), or BMI (Bonvin 2013).
Of the five RCTs that reported on the effect of interventions by SES, three of these studies also reported on other PROGRESS categories. Two RCTs reported the effect of the intervention by migrant status and found no difference on BMI (Bonvin 2013; Puder 2011). One study (Rush 2012), reported that children of Maori ethnicity had a slightly (but not significantly) greater increase in BMI and per cent body fat compared with children from European origin. This intervention also reported a more favourable, but not statistically significant, effect of the intervention in children attending rural schools compared with urban schools, and in children attending schools in less deprived areas compared with schools in areas of deprivation.
Subgroup analysis by socio‐economic status, migrant status, ethnicity and rural/urban setting in children aged 6 to 12 years
Six of the 85 RCTs reported on the effect of the intervention by SES. Two RCTs reported no interaction between SES and BMI (De Heer 2011; Simon 2008). Two RCTs in high‐income countries reported that higher parental SES related to more favourable outcomes: reduced child waist circumference, per cent body fat (Elder 2014), BMI and waist to hip ratio (Grydeland 2014). Two RCTs in upper‐middle‐income countries (Mexico and Turkey) reported that higher parental SES was related to less favourable outcomes; the probability of moving from overweight to obese (Levy 2012), and increase in BMI (Sevinc 2011).
Five of the 85 RCTs reported on the effect of the intervention by ethnicity. Two RCTs found no interaction of intervention effect with ethnicity (Johnston 2013; Rush 2012); two RCTs reported that the intervention was more effective for African American participants (Foster 2008; Gortmaker 1999a), and one RCT reported that the intervention worked better at preventing weight gain (zBMI) in white girls (Williamson 2012).
Subgroup analysis by socio‐economic status, migrant status, ethnicity and rural/urban setting in children aged 13 to 18 years
Two of the 29 RCTs reported that they had conducted analyses to assess the effect of the intervention by ethnicity, and did not find any significant difference (Pate 2005; Singh 2009).
Discusión
Resumen de los resultados principales
Esta revisión incluye 153 ECA de programas dirigidos a prevenir la obesidad en niños de cero a 18 años de edad. De ellos, 39 ECA (25%) se dirigieron a niños de cero a cinco años, 85 ECA (56%) a niños de seis a 12 años y 29 ECA (19%) a niños de 13 a 18 años. Un estudio reclutó niños de cinco y diez años de edad. La duración de 116 intervenciones fue de 12 meses o menos, 25 intervenciones duraron entre uno y dos años y 12 intervenciones se realizaron durante más de dos años. Noventa y tres ECA (61%) incluyeron una combinación de intervenciones de dieta y actividad física. Treinta y nueve ECA (21%) compararon la actividad física con control y 21 ECA (14%) compararon solo dieta con control. Los estudios realizaron intervenciones principalmente en la escuela (n = 91; 59%), en contextos comunitarios (n = 24; 15%), en centros de cuidado infantil o preescolares (n = 22; 14%), y en una minoría en el hogar (n = 11; 7%) o en centros de salud (n = 6; 4%). Veintidós ECA (14%) incluyeron más de un contexto. Todas estas intervenciones se dirigieron al nivel individual o interpersonal del Modelo Socioecológico (MSE) (Stokols 1992), o a ambos. Se examinó el cambio en el perfil de los contextos de las intervenciones para prevenir la obesidad infantil antes de 2011 en comparación con 2011 y 2015, debido a la necesidad de realizar más intervenciones preliminares en los últimos diez a 15 años. Solo se identificaron 11 estudios que se categorizaron como realizados en un contexto más amplio (no en una guardería, escuela, hogar ni en un contexto de atención sanitaria). Es de señalar que no se identificaron ECA realizados en un contexto religioso.
Esta revisión sistemática de ECA para la prevención de la obesidad en niños encontró que hubo alguna evidencia de que la combinación de intervenciones dietéticas y de actividad física podía reducir las medidas de adiposidad en niños de cero a cinco años. Para los niños de seis a 12 años, las intervenciones de actividad física redujeron las medidas de adiposidad en comparación con control. Una combinación de intervenciones dietéticas y de actividad física puede reducir la adiposidad, pero existe mucha incertidumbre sobre este tema. Para los niños entre 13 y 18 años, las intervenciones de actividad física pueden reducir la adiposidad, pero existe mucha incertidumbre sobre este tema. Los efectos observados en esta revisión se deben analizar con cierta precaución debido a los hallazgos de una revisión reciente realizada por McCrabb 2019, que realizó una revisión sistemática para evaluar la diferencia entre la eficacia de las intervenciones para la obesidad cuando se evalúan en un ECA, en comparación con la efectividad de esa intervención cuando se amplía y se implementa en un entorno real. En todas las medidas del estado del peso, las intervenciones ampliadas informados en general efectos del 75% o menos con respecto a los efectos informados en los ensayos de eficacia (McCrabb 2019).
Niños entre cero y cinco años de edad
Esta revisión sistemática de ECA para la prevención de la obesidad en niños de cero a cinco años encontró evidencia de certeza moderada de que las intervenciones dietéticas y de actividad física combinadas, comparadas con control, reducen la puntuación z del IMC y el IMC en niños de cero a cinco años. Sin embargo, la reducción es muy pequeña. El examen de los efectos de las intervenciones dietéticas combinadas con actividad física sobre el IMC muestra que dichas intervenciones difirieron entre los contextos, de manera que no parece haber un efecto de las intervenciones dietéticas y físicas combinadas sobre el IMC establecido en el cuidado infantil o preescolar (n = ocho ECA), pero las intervenciones realizadas en el domicilio o en la comunidad en general redujeron el IMC. Sin embargo, cuando se eliminó un estudio que informó una reducción muy grande del IMC, el efecto general se redujo. Hubo evidencia de certeza moderada de que las intervenciones dietéticas solas comparadas con control, y evidencia de certeza alta de que las intervenciones de actividad física solas comparadas con control, no redujeron el IMC ni la puntuación z del IMC.
Niños entre seis y 12 años de edad
Las intervenciones de actividad física comparadas con control redujeron el IMC en niños de seis a 12 años de edad, y existe certeza moderada de este efecto; sin embargo, no se encontró una reducción en la puntuación z del IMC. La dieta combinada con intervenciones de actividad física, en comparación con control, redujo la puntuación z del IMC en los niños de seis a 12 años evidencia de certeza baja). Se encontró evidencia de certeza muy alta de que las intervenciones dietéticas no redujeron el IMC ni la puntuación z del IMC en los niños de seis a 12 años.
Niños entre 13 y 18 años de edad
Se encontró que las intervenciones de actividad física administradas por sí solas, comparadas con control, podrían o no reducir el IMC (evidencia de certeza muy baja) y podrían reducir el IMC (evidencia de certeza baja) en niños de 13 a 18 años de edad. Las intervenciones dietéticas solas y las intervenciones dietéticas combinadas con actividad física no tienen efecto sobre el IMC ni sobre la puntuación z del IMC, pero la confianza en esta evidencia es limitada.
Hubo una variabilidad considerable en los ECA medida con la estadística I2 y muchos metanálisis se caracterizaron por valores de heterogeneidad moderada o baja. El análisis de subgrupos según la duración de la intervención redujo la heterogeneidad en una sola comparación: Dieta y actividad física combinadas versus control para los niños de 13 a 18 años de edad, donde la heterogeneidad sustancial se redujo a moderada para el resultado de IMC. El examen de la heterogeneidad según el contexto no redujo sistemáticamente la heterogeneidad, y en algunos subgrupos la heterogeneidad aumentó.
No es sencillo caracterizar un tamaño del efecto clínicamente relevante en la adiposidad en los niños. Hay pocas publicaciones relevantes que discutan este tema y la mayoría se han realizado en una población de niños obesos. En una muestra de niños obesos (media de edad 10,7 años, rango 4 a 15 años; puntuación z del IMC 2,5, rango 2,0 a 4,0), la pérdida de peso se asoció con una mejora en el perfil aterogénico y en la resistencia a la insulina, pero solo cuando la puntuación z del IMC disminuyó en al menos 0,5 unidades en un período de un año (Reinehr 2004). En otra muestra de niños con obesidad, Ford 2010 utilizó una reducción de la puntuación z del IMC de 0,25. El estudio de prevención de la obesidad WAVES aplicó una reducción de la puntuación z del IMC de 0,25 para calcular el poder estadístico y detectar cualquier diferencia clínicamente significativa en la puntuación z del IMC entre los grupos intervención y control (Adab 2015b). Otro estudio de prevención de la obesidad utilizó una reducción de 0,125 en la puntuación z del IMC (Williamson 2008). Por lo tanto, la reducción de la puntuación z del IMC observada en esta revisión es aproximadamente la mitad de la estimación más conservadora. La significación clínica de esta reducción a nivel poblacional (incluidos los niños de todos los pesos) no está clara. Podría corresponder a un cambio pequeño pero clínicamente importante en el IMC de la población si se mantiene durante varios años; sin embargo, la mayor parte de la evidencia se relaciona con intervenciones de 12 meses o menos y solo una minoría de los ECA informó el seguimiento posterior a la intervención, lo que dificulta que exista certeza en que los resultados de las intervenciones, a menudo a corto plazo, se mantengan a largo plazo. Debido a que el IMC de los niños varía con su trayectoria de crecimiento, no existen ejemplos de una diferencia clínicamente significativa en el IMC.
Solo tres ECA en niños de seis a 12 años de edad compararon un tipo de intervención activa con otro. No se encontró evidencia de que alguno de los tres tipos de intervención (dieta, actividad física o dieta y actividad física combinadas) fuera más efectivo que otro. Sin embargo, vale la pena destacar que las descripciones de la mayoría de las intervenciones (cuando se informan con suficiente detalle) incluyeron algún elemento de asesoramiento sobre la dieta o la actividad física, independientemente de si la intervención se categorizó como una intervención dietética o de actividad física.
Existe una gran variedad en los tipos de enfoques utilizados en las intervenciones, incluso dentro de las categorías "dieta" y "actividad física", lo que limita la capacidad para comparar las intervenciones entre los ECA. Además, los componentes de las intervenciones suelen evaluarse como un todo, y no de forma aislada. Este hecho dificulta la elaboración de hipótesis firmes sobre la efectividad de los distintos componentes de la intervención. Podría darse el caso de que son los componentes de las intervenciones que actúan en sinergia, y no los componentes individuales, los que dan lugar al éxito de la intervención. Lo que se puede decir (si el foco se sitúa en los efectos beneficiosos que se producen en la puntuación z del IMC y en el IMC) es que las intervenciones dietéticas o de actividad física, o ambas, para prevenir la obesidad, son efectivas para reducir la puntuación z del IMC y el IMC en niños de hasta 12 años. Para los adolescentes y jóvenes de 13 a 18 años de edad, las intervenciones dietéticas o de actividad física por sí solas no son efectivas para reducir la puntuación z del IMC ni el IMC.
La evidencia de ECA recientemente identificados de países de ingresos bajos y medios para esta revisión actualizada es una contribución importante, en términos de contexto y validez externa, en particular para los responsables de la formulación de políticas en esos países. Esta revisión actualizada también confirma de manera importante que las intervenciones para prevenir la obesidad infantil no parecen producir efectos adversos ni desigualdades en la salud, pero se observó que en muy pocas ocasiones se realizó el análisis de los resultados según los factores PROGRESS (incluido el estado socioeconómico) y aún es un problema difícil. Los responsables de las políticas y la práctica deben saber qué intervenciones no son solo viables, efectivas y asequibles, sino cuáles abordan también las desigualdades.
Solo 15 estudios (9,8%) informaron los costes, y solo uno informó una evaluación económica completa. La mayoría de los estudios de costes se publicaron después de 2011.
Compleción y aplicabilidad general de las pruebas
Esta actualización incluyó 13 estudios de países de ingresos medios‐altos (Andrade 2014; Crespo 2012; Cunha 2013; Farias 2015; Habib‐Mourad 2014; Lana 2014; Levy 2012; Macias‐Cervantes 2009; Mo‐suwan 1998; Safdie 2013; Sevinc 2011; Sichieri 2009; Yilmaz 2015), y uno de un país de ingresos medios‐bajos (El Ansarai 2010). La información de estos estudios contribuye de manera importante, en términos de contexto y validez externa, a la base de datos existente para los responsables de la formulación de políticas.
El tipo y la intensidad de las intervenciones variaron considerablemente, y quizás es demasiado simple categorizar las intervenciones como de tipo "dietética" o "actividad física" o una combinación de ambas. Por ejemplo, dentro de la categoría de intervenciones de "actividad física", la intensidad de la actividad puede variar considerablemente, desde la educación sobre el valor de la actividad física hasta sesiones diarias de actividad física de intensidad específica. Las intervenciones de actividad física también podrían incluir la reducción de la conducta sedentaria, que podría ser "tiempo frente a la pantalla". Las intervenciones dietéticas se podrían centrar en el agua o en las bebidas endulzadas con azúcar. Esta actualización incluye intervenciones realizadas en línea, o a través de teléfonos móviles/texto, y juegos interactivos ("exergaming"); algunas intervenciones incluyen otros componentes del estilo de vida que son determinantes conocidos de las conductas relacionadas con el equilibrio energético, como las rutinas para el sueño y las comidas, los estilos de crianza y las conductas de alimentación. Se recomienda que las categorizaciones futuras sean más sofisticadas y tengan en cuenta los factores que podrían influir en la capacidad de los participantes para participar en las intervenciones.
La mayoría de las intervenciones revisadas para esta actualización se centraron en el nivel individual (personal) del MSE (Stokols 1992), más que en los niveles preliminares (medio ambiente, política), debido a la naturaleza de los criterios de inclusión (ECA). Se examinó el cambio en el perfil de los contextos de las intervenciones para prevenir la obesidad infantil antes de 2011 en comparación con 2011 y 2015, debido a la necesidad de realizar más intervenciones preliminares en los últimos diez a 15 años. Solo se identificaron 11 estudios que se categorizaron como realizados en un contexto más amplio (no en una guardería, escuela, hogar ni en un contexto de atención sanitaria). Es de señalar que no se identificaron ECA realizados en un contexto religioso. Debido a la importancia que se le concede a la salud y el bienestar en muchas religiones, en particular para los musulmanes, se observó que ninguna de las intervenciones que examinamos se realizó en un contexto religioso. Una revisión de alcance reciente expone hasta qué punto se realiza la promoción de la salud, incluidas las intervenciones para prevenir la obesidad infantil, en los entornos religiosos islámicos (Rai 2019). En general no se observó una tendencia clara a un cambio hacia intervenciones más tempranas entre estos dos períodos de tiempo. Se recomiendan los hallazgos de las revisiones de alta calidad de intervenciones comunitarias y políticas para abordar la obesidad infantil (Wolfenden 2016a), junto con los de esta revisión.
Los métodos de implementación son menos variados, y las intervenciones las realiza el personal, los profesores, académicos, investigadores, o a través de medios electrónicos, o una combinación de estos métodos. Para proporcionar evidencia útil a los responsables de la toma de decisiones y a quienes desean replicar intervenciones efectivas, se ha intentado proporcionar una síntesis de varios factores relacionados con la implementación informados en los estudios. Se considera que esta información es necesaria para ir, más allá de la simple pregunta de qué funciona en la prevención de la obesidad, a otras preguntas importantes sobre cómo funcionó, si funcionará en otro contexto o bajo otras condiciones, y si es factible o apropiado que otros la implementen.
La evaluación de los sesgos de publicación y los efectos de los estudios pequeños mediante los gráficos en embudo no mostró asimetría aparente de los gráficos en embudo que pudiera indicar una muestra de estudios sin sesgo de publicación. Sin embargo, se sabe que el 28% de los estudios de esta revisión no proporcionaron datos para los metanálisis. Además, las búsquedas actualizadas de esta revisión han identificado potencialmente muchos más ECA con datos para agregar (Estudios en espera de clasificación).
Calidad de la evidencia
Los datos de 43 estudios (28%) incluidos no se incluyeron en los metanálisis debido al informe inadecuado de los datos que resumen los efectos de las intervenciones. No fue posible valorar el riesgo de sesgo para 379 (37%) de 1021 aspectos del "Riesgo de sesgo" evaluados en los ECA. Para los estudios del metanálisis no fue posible valorar el riesgo de sesgo para 250 (33%) de 742 aspectos del "Riesgo de sesgo". Esta cifra es mayor, en casi la mitad, en aquellos estudios que no proporcionaron datos para los metanálisis (129 de 279 [46%]). Aproximadamente la mitad de las valoraciones (rango 45% a 52%) para la generación de la secuencia aleatoria, el ocultamiento de la asignación, el cegamiento y el informe selectivo de resultado fueron inciertas para los ECA incluidos en el metanálisis. Para los ECA que no contribuyeron al metanálisis, el número de aspectos inciertos para estos dominios fue mucho mayor (rango 50% a 76%). Se conoce que la valoración de un aspecto del "Riesgo de sesgo" como "incierto" podría indicar que no hay sesgo en absoluto, o que hay un alto riesgo de sesgo. La certeza de la evidencia de los efectos (mediante GRADE) se redujo a "moderada" o "baja" según el nivel de heterogeneidad y el efecto de extraer los estudios calificados como de "alto" riesgo de sesgo del análisis. La heterogeneidad no se explicó adecuadamente mediante los análisis de subgrupos.
Sesgos potenciales en el proceso de revisión
Se hicieron varios cambios a los métodos planificados establecidos en el protocolo. Este hecho se debió en parte a que los métodos del protocolo ahora están muy desactualizados. Por ejemplo, las actualizaciones publicadas de los métodos Cochrane para la evaluación del riesgo de sesgo se han revisado dos veces desde la primera publicación de esta revisión (Higgins 2011c; Higgins 2016). Todos los cambios se describieron en la sección Diferencias entre el protocolo y la revisión. Se hicieron otros cambios porque al parecer la tasa de publicación de estudios nuevos y relevantes sobre este tema ha aumentado de manera exponencial. Este hecho ha superado los recursos con los que se contaba para realizar la actualización. El análisis de los ECA se limitó a los resultados puntuación z del IMC e IMC. Se conoce el problema del sesgo en el informe de los resultados (Dwan 2010; Kirkham 2010). Debido a que se examinaron poblaciones saludables de niños, y a que las intervenciones de interés podrían estar dirigidas a temas de atención sanitaria distintos de la prevención de la obesidad, muchos ECA podrían informar una amplia variedad de medidas de resultado que no son relevantes para esta revisión. Lo anterior, junto con el aumento exponencial de los estudios de investigación en esta área (Figura 2), significa que no fue factible incluir todos los ECA que podrían haber informado todos los resultados de adiposidad. Además, es importante no incluir resultados que puedan abrumar a los lectores o que sean triviales para los responsables de la toma de decisiones, y esta revisión ya tiene 32 metanálisis (McKenzie 2016). Los enfoques de las revisiones sistemáticas de los temas de prevención de la salud pública han incluido la restricción de la selección de estudios o los análisis por resultado por estas razones (McKenzie 2016; Verbeek 2017). En el futuro, esta revisión Cochrane se dividirá en revisiones más pequeñas, cada una de las cuales se centrará en grupos de edad/etapas de desarrollo específicos de los niños. En estas revisiones se reevaluarán la pregunta de la revisión, los criterios de inclusión, los objetivos, los métodos y los resultados.
Acuerdos y desacuerdos con otros estudios o revisiones
Otras revisiones exhaustivas sobre este tema han encontrado resultados similares, en el sentido de que hay un efecto modesto o ningún efecto de las intervenciones que se centran en el cambio individual, para prevenir la obesidad en los niños. Por supuesto, siempre se puede encontrar el estudio poco común que muestra que una intervención es efectiva, pero la base de la evidencia en conjunto indica que el efecto de estas intervenciones es, en el mejor de los casos, modesto. La Comisión de la OMS para la Erradicación de la Obesidad Infantil (OMS 2016) indica que parte del fracaso de las intervenciones centradas en el cambio conductual individual, como las incluidas en esta revisión Cochrane, se debe al hecho de que se centran en el cambio conductual individual. La Comisión de la OMS indica que las intervenciones preliminares pueden ser particularmente importantes, por lo que se requiere un mayor esfuerzo en esta área. Los ejemplos de intervenciones para los adolescentes incluyen la lucha contra la comercialización de alimentos poco saludables como las bebidas azucaradas, y el entorno obesogénico como los puntos de venta de alimentos para llevar. Puede ser particularmente importante proporcionar orientación y formación a los cuidadores que trabajan en contextos e instituciones de cuidado infantil sobre la dieta, la actividad física y el sueño. Actualmente se reconoce que la lucha contra la obesidad requiere de un enfoque sistémico y de iniciativas políticas en todos los departamentos gubernamentales de manera conjunta (Rutter 2016; Rutter 2017). La incorporación de la evidencia de las intervenciones a un nivel de políticas en una revisión Cochrane tradicional de ECA es un desafío, y la comunidad investigadora necesita ayudar y apoyar a los responsables de la formulación de políticas, así como a las partes interesadas, a reunir la totalidad de la base de la evidencia en un formato equilibrado y accesible.


Increase in number of records retrieved and studies included in this systematic review from 2001 until 2017

Distribution of studies by location, age of children and type of intervention. * Total number of locations is 154 and not 153 (number of studies) as one study, Lana 2014, was located in both Spain and Mexico. Papadaki 2010 was located in 7 countries across Europe.

'Risk of bias' graph: review authors' judgements about each 'Risk of bias' item presented as percentages across all included studies

'Risk of bias' summary: review authors' judgements about each 'Risk of bias' item for each included study

Funnel plots of all comparisons with more than 10 studies. A Funnel plot of comparison 3. Diet and physical activity interventions versus control in children aged 0‐5 years. Outcome: zBMI. No evidence of asymmetry (Egger test P = 0.958). B Funnel plot of comparison 3. Diet and physical activity interventions versus control in children aged 0‐5 years. Outcome: BMI. No evidence of asymmetry (Egger test P = 0.529). C Funnel plot of comparison 5. Physical activity interventions versus control in children aged 6‐12. Outcome: BMI. No evidence of asymmetry (Egger test P = 0.763). D Funnel plot of comparison 6. Physical activity interventions versus control in children aged 6‐12. Outcome: zBMI. No evidence of asymmetry (Egger test P = 0.304). E Funnel plot of comparison 6. Physical activity interventions versus control in children aged 6‐12. Outcome: BMI. No evidence of asymmetry (Egger test P = 0.768).
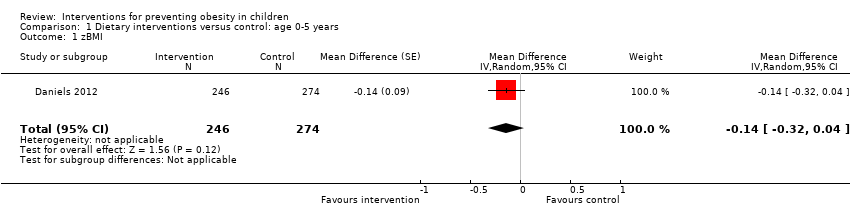
Comparison 1 Dietary interventions versus control: age 0‐5 years, Outcome 1 zBMI.

Comparison 2 Physical activity interventions versus control: age 0‐5 years, Outcome 1 zBMI. Physical activity vs control ‐ setting.

Comparison 2 Physical activity interventions versus control: age 0‐5 years, Outcome 2 BMI. Physical activity vs control ‐ setting.

Comparison 3 Diet and physical activity interventions versus control: age 0‐5 years, Outcome 1 zBMI. Diet and physical activity vs control ‐ setting.

Comparison 3 Diet and physical activity interventions versus control: age 0‐5 years, Outcome 2 zBMI. Diet and physical activity vs control ‐ duration.

Comparison 3 Diet and physical activity interventions versus control: age 0‐5 years, Outcome 3 BMI. Diet and physical activity vs control ‐ setting.

Comparison 3 Diet and physical activity interventions versus control: age 0‐5 years, Outcome 4 BMI. Diet and physical activity vs control ‐ duration.

Comparison 4 Dietary interventions versus control: age 6‐12 years, Outcome 1 zBMI ‐ setting.

Comparison 4 Dietary interventions versus control: age 6‐12 years, Outcome 2 BMI ‐ setting.

Comparison 5 Physical activity interventions versus control: age 6‐12, Outcome 1 zBMI. Physical activity vs control ‐ setting.

Comparison 5 Physical activity interventions versus control: age 6‐12, Outcome 2 zBMI. Physical activity vs control ‐ duration.

Comparison 5 Physical activity interventions versus control: age 6‐12, Outcome 3 BMI. Physical activity vs control ‐ setting.

Comparison 5 Physical activity interventions versus control: age 6‐12, Outcome 4 BMI. Physical activity vs control ‐ duration.

Comparison 6 Diet and physical activity interventions vs control: age 6‐12 years, Outcome 1 zBMI. Diet and physical activity vs control ‐ setting.

Comparison 6 Diet and physical activity interventions vs control: age 6‐12 years, Outcome 2 zBMI. Diet and physical activity vs control ‐ duration.

Comparison 6 Diet and physical activity interventions vs control: age 6‐12 years, Outcome 3 BMI. Diet and physical activity vs control ‐ setting.

Comparison 6 Diet and physical activity interventions vs control: age 6‐12 years, Outcome 4 BMI. Diet and physical activity vs control ‐ duration.

Comparison 7 Diet interventions versus control: age 13‐18 years, Outcome 1 BMI ‐ setting.

Comparison 8 Physical activity interventions versus control: age 13‐18 years, Outcome 1 zBMI ‐ setting.

Comparison 8 Physical activity interventions versus control: age 13‐18 years, Outcome 2 zBMI ‐ duration.

Comparison 8 Physical activity interventions versus control: age 13‐18 years, Outcome 3 BMI ‐ setting.

Comparison 8 Physical activity interventions versus control: age 13‐18 years, Outcome 4 BMI ‐ duration.

Comparison 9 Diet and physical activity interventions versus control: age 13‐18 years, Outcome 1 zBMI ‐ setting.

Comparison 9 Diet and physical activity interventions versus control: age 13‐18 years, Outcome 2 zBMI ‐ duration.

Comparison 9 Diet and physical activity interventions versus control: age 13‐18 years, Outcome 3 BMI ‐ setting.

Comparison 9 Diet and physical activity interventions versus control: age 13‐18 years, Outcome 4 BMI ‐ duration.

Comparison 10 Dietary interventions versus physical activity interventions: age 6‐12 years, Outcome 1 zBMI.

Comparison 10 Dietary interventions versus physical activity interventions: age 6‐12 years, Outcome 2 BMI.

Comparison 11 Diet and physical activity versus physical activity interventions: age 6‐12 years, Outcome 1 zBMI.

Comparison 11 Diet and physical activity versus physical activity interventions: age 6‐12 years, Outcome 2 BMI.

Comparison 12 Dietary interventions versus diet and physical activity interventions: age 6‐12 years, Outcome 1 zBMI.

Comparison 12 Dietary interventions versus diet and physical activity interventions: age 6‐12 years, Outcome 2 BMI.
| Dietary interventions compared to control for preventing obesity in children aged 0 to 5 years | |||||
| Patient or population: children aged 0‐5 years | |||||
| Outcomes | Anticipated absolute effects* (95% CI) | № of participants | Certainty of the evidence | Comments | |
| Risk with control | Risk with dietary interventions | ||||
| Body‐mass index z score (zBMI) | The mean zBMI was 0.75 | MD 0.14 lower (0.32 lower to 0.04 higher) | 520 | ⊕⊕⊕⊝ | Dietary interventions likely result in little to no difference in zBMI |
| *The risk in the intervention group (and its 95% confidence interval) is based on the assumed risk in the comparison group and the relative effect of the intervention (and its 95% CI). | |||||
| GRADE Working Group grades of evidence | |||||
| 1Risk of bias: there is only one study and it has one domain (incomplete outcome data) rated as high risk of bias, with 22% of participants dropping out of the study. | |||||
| Physical activity interventions compared to control for preventing obesity in children aged 0 to 5 years | |||||
| Patient or population: children aged 0‐5 years | |||||
| Outcomes | Anticipated absolute effects* (95% CI) | № of participants | Certainty of the evidence | Comments | |
| Risk with control | Risk with physical activity interventions | ||||
| Body‐mass index (BMI) | The mean BMI ranged from 15.94 to 16.4 kg/m2 | MD 0.22 kg/m2 lower | 2233 | ⊕⊕⊕⊕ | Physical activity interventions likely do not reduce BMI |
| Body‐mass index z score (zBMI) | The mean zBMI ranged from −0.15 to −0.22 | MD 0.01 higher | 1053 | ⊕⊕⊕⊕ | Physical activity interventions likely do not reduce zBMI |
| *The risk in the intervention group (and its 95% confidence interval) is based on the assumed risk in the comparison group and the relative effect of the intervention (and its 95% CI). | |||||
| GRADE Working Group grades of evidence | |||||
| Diet and physical activity interventions combined compared to control for preventing obesity in children age 0‐5 years | |||||
| Patient or population: children aged 0‐5 years | |||||
| Outcomes | Anticipated absolute effects* (95% CI) | № of participants | Certainty of the evidence | Comments | |
| Risk with control | Risk with diet and physical activity interventions | ||||
| Body‐mass index z score (zBMI) | The mean zBMI ranged from 0.15 to 0.98 | MD 0.07 lower (0.14 lower to 0.01 lower) | 6261 | ⊕⊕⊕⊝ | Diet and physical activity interventions potentially slightly reduce zBMI |
| Body‐mass index (BMI) | The mean BMI ranged from 15.8 to 17.62 kg/m2 | MD −0.11 kg/m2 lower | 5536 | ⊕⊕⊕⊝ | Diet and physical activity interventions likely result in little to no difference in BMI |
| *The risk in the intervention group (and its 95% confidence interval) is based on the assumed risk in the comparison group and the relative effect of the intervention (and its 95% CI). | |||||
| GRADE Working Group grades of evidence | |||||
| 1Heterogeneity of this analysis as measured with I2 statistic was 66%, and therefore at high risk of bias. | |||||
| Adverse event outcomes for dietary combined with physical activity interventions compared to control for preventing obesity in children aged 0 to 5 years | |||
| Patient or population: children aged 0 to 5 years | |||
| Outcomes | Impact | № of participants | Certainty of the evidence |
| Insufficient weight gain in infants | One study of an infant feeding intervention. There was no difference in numbers of infants with weight < 5th percentile between intervention and control groups nor in the numbers of children dropping by 2 major centiles between year 1 and year 2, but this was just 80 participants. | 110 | ⊕⊝⊝⊝ |
| Physical injuries | No effect of intervention on numbers of physical injuries reported in the control and intervention arms | 652 | ⊕⊕⊝⊝ |
| Adverse events | No 'adverse events' reported | 983 | ⊕⊕⊝⊝ |
| Infections | No effect of intervention on numbers of reported infections. These data are very uncertain. A single study of just 41 participants found similar numbers of (parent‐reported) infections in children in the intervention and control groups. | 709 | ⊕⊕⊝⊝ |
| Accidents | No effect on number of accidents. These data are very uncertain. A single study of just 41 participants found similar numbers of (parent‐reported) accidents in children in the intervention and control groups. | 42 | ⊕⊝⊝⊝ |
| RCT: randomised controlled trial | |||
| GRADE Working Group grades of evidence | |||
| 1Downgraded three times. Twice for imprecision, as evidence based on just one study with only 110 participants. Downloaded once for risk of bias as we judged three domains at high risk of bias and two unclear from a total of six items. | |||
| Dietary interventions compared to control for preventing obesity in children aged 6 to 12 years | |||||
| Patient or population: children aged 6‐12 years | |||||
| Outcomes | Anticipated absolute effects* (95% CI) | № of participants | Certainty of the evidence | Comments | |
| Risk with control | Risk with dietary interventions | ||||
| Body‐mass index z score (zBMI) | The mean zBMI ranged from 0.09 to 0.41 | MD 0.03 lower (0.06 lower to 0.01 higher) | 7231 | ⊕⊕⊕⊕ | Dietary interventions alone do not reduce zBMI |
| Body‐mass index (BMI) | The mean BMI ranged from 17.9 to 25.1 kg/m2 | MD 0.02 kg/m2 lower (0.11 lower to 0.06 higher) | 5061 | ⊕⊕⊕⊕ | Dietary interventions alone do not reduce BMI |
| *The risk in the intervention group (and its 95% confidence interval) is based on the assumed risk in the comparison group and the relative effect of the intervention (and its 95% CI). | |||||
| GRADE Working Group grades of evidence | |||||
| Physical activity interventions compared to control for preventing obesity in children aged 6 to 12 years | |||||
| Patient or population: children aged 6‐12 years | |||||
| Outcomes | Anticipated absolute effects* (95% CI) | № of participants | Certainty of the evidence | Comments | |
| Risk with control | Risk with physical activity interventions | ||||
| Body‐mass index z score (zBMI) | The mean zBMI ranged from 0.09 to 1.75 | MD 0.02 lower (0.06 lower to 0.02 higher) | 6841 | ⊕⊕⊕⊝ | Physical activity interventions likely result in little to no difference in zBMI. Physical activity vs control ‐ setting |
| Body‐mass index (BMI) | The mean BMI ranged from 15.7 to 20.41 kg/m2 | MD 0.1 kg/m2 lower | 16,410 | ⊕⊕⊕⊝ | Physical activity interventions likely reduce BMI |
| *The risk in the intervention group (and its 95% confidence interval) is based on the assumed risk in the comparison group and the relative effect of the intervention (and its 95% CI). | |||||
| GRADE Working Group grades of evidence | |||||
| 1Four of seven studies have at least one domain judged to be high risk of bias. In addition removal of these studies substantially changes the effect of having an intervention, from no effect to there being a positive effect of the intervention. | |||||
| Adverse event outcomes for physical activity interventions compared to control for preventing obesity in children aged 6 to 12 years | |||
| Patient or population: children aged 6‐12 years | |||
| Outcomes | Impact | № of participants | Certainty of the evidence |
| Physical injuries | No effect on numbers of children with physical injuries in the control and intervention arms | 912 | ⊕⊕⊝⊝ |
| Underweight | No effect on number (proportion) of children designated as underweight | 5266 | ⊕⊕⊕⊕ |
| Depression | Depression was reduced in children in the intervention group (MD −0.21, 95% CI −0.42 to −0.001) | 225 | ⊕⊕⊝⊝ |
| Body satisfaction | No effect of intervention on reported body satisfaction at the end of the intervention | 225 | ⊕⊕⊝⊝ |
| Increased weight concerns | No effect of intervention on reported body satisfaction at the end of the intervention | 225 | ⊕⊕⊝⊝ |
| CI: confidence interval; MD: mean difference; RCT: randomised controlled trial | |||
| GRADE Working Group grades of evidence | |||
| 1Downgraded for risk of bias because this study has one domain at high risk of bias. Downgraded for imprecision because only one of 22 studies reported this outcome. | |||
| Diet and physical activity interventions combined compared to control for preventing obesity in children aged 6 to 12 years | |||||
| Patient or population: children aged 6‐12 years | |||||
| Outcomes | Anticipated absolute effects* (95% CI) | № of participants | Certainty of the evidence | Comments | |
| Risk with control | Risk with diet and physical activity interventions | ||||
| Body‐mass index z score (zBMI) | The mean zBMI ranged from 0.05 to 0.9 | MD 0.05 lower (0.10 lower to 0.01 lower) | 24,043 | ⊕⊕⊝⊝ | Diet and physical activity interventions combined may reduce zBMI slightly |
| Body‐mass index (BMI) | The mean BMI ranged from 17.57 to 24.8 kg/m2 | MD 0.05 kg/m2 lower (0.11 lower to 0.01 higher) | 19,498 | ⊕⊕⊝⊝ | Diet and physical activity interventions combined may result in little to no difference in BMI |
| *The risk in the intervention group (and its 95% confidence interval) is based on the assumed risk in the comparison group and the relative effect of the intervention (and its 95% CI). | |||||
| GRADE Working Group grades of evidence | |||||
| 1Heterogeneity was very high with an I2 statistic of 87%. | |||||
| Adverse event outcomes for dietary combined with physical activity interventions compared to control for preventing obesity in children aged 6 to 12 years | |||
| Patient or population: children aged 6 to 12 years | |||
| Outcomes | Impact | № of participants | Certainty of the evidence |
| Underweight | No effect on number (proportion) of children designated as underweight | 784 | ⊕⊕⊕⊝ |
| Depression | Depression was reduced in children in the intervention group (MD −0.21, 95% CI −0.42 to −0.001) Baseline depression score of the control group was 2.09 (SD 2.74) | 225 | ⊕⊕⊝⊝ |
| Increased weight concern | No effect of the intervention on concern about weight | 285 | ⊕⊕⊕⊕ |
| Body satisfaction | No effect of intervention (diet and physical activity) on reported body satisfaction at the end of the intervention | 1128 | ⊕⊕⊕⊕ |
| Visits to a healthcare provider | Visits to a healthcare provider were similar in the intervention and control groups; N = 1 in intervention and N = 2 in control | 60 | ⊕⊕⊝⊝ |
| Adverse events related to taking of blood samples | < 3%, similar numbers in the intervention (1.6%) and control (1.7%) groups (RD 0.00, 95% CI −0.01 to 0.01) | 4603 | ⊕⊕⊕⊝ |
| Underweight | Waist circumference of children < 10th centile for weight did not differ between the intervention and control group (P = 0.373) | 724 | ⊕⊕⊕⊝ |
| Injuries | Similar numbers of children were reported with injuries in the intervention (11%, N = 2) and control (4.7%, N = 1) groups | 60 | ⊕⊕⊝⊝ |
| *The risk in the intervention group (and its 95% confidence interval) is based on the assumed risk in the comparison group and the relative effect of the intervention (and its 95% CI). | |||
| GRADE Working Group grades of evidence | |||
| 1Downgraded for risk of bias because one of the studies had an outcome rated as high risk of bias. | |||
| Diet interventions compared to control for preventing obesity in children aged 13 to 18 years | |||||
| Patient or population: children aged 13‐18 years | |||||
| Outcomes | Anticipated absolute effects* (95% CI) | № of participants | Certainty of the evidence | Comments | |
| Risk with control | Risk with diet interventions | ||||
| Body‐mass index (BMI) | The mean BMI was 24.8 kg/m2 | MD 0.13 kg/m2 lower (0.50 lower to 0.23 higher) | 294 | ⊕⊕⊝⊝ | Diet interventions may result in little to no difference in BMI |
| *The risk in the intervention group (and its 95% confidence interval) is based on the assumed risk in the comparison group and the relative effect of the intervention (and its 95% CI). | |||||
| GRADE Working Group grades of evidence | |||||
| 1There are two studies and one has two domains at high risk of bias. | |||||
| Physical activity interventions compared to control for preventing obesity in children aged 13 to 18 years | |||||
| Patient or population: children aged 13‐18 years | |||||
| Outcomes | Anticipated absolute effects* (95% CI) | № of participants | Certainty of the evidence | Comments | |
| Risk with control | Risk with physical activity interventions | ||||
| Body‐mass index z score (zBMI) | The mean zBMI was 0.21 to 0.81 | MD 0.2 lower (0.3 lower to 0.1 lower) | 100 | ⊕⊕⊝⊝ | The evidence suggests physical activity interventions reduce zBMI |
| Body‐mass index (BMI) | The mean BMI was 20.4 to 26.65 kg/m2 | MD 1.53 kg/m2 lower | 720 | ⊕⊝⊝⊝ | The evidence is very uncertain about the effect of physical activity interventions on BMI |
| *The risk in the intervention group (and its 95% confidence interval) is based on the assumed risk in the comparison group and the relative effect of the intervention (and its 95% CI). | |||||
| GRADE Working Group grades of evidence | |||||
| 1One study with only 100 participants. | |||||
| Adverse event outcomes for physical activity interventions compared to control for preventing obesity in children age 13 to 18 years | |||
| Patient or population: children aged 13‐18 years | |||
| Outcomes | Impact | № of participants | Certainty of the evidence |
| Body satisfaction | No effect of intervention on reported body satisfaction at the end of the intervention | 190 | ⊕⊕⊝⊝ |
| Unhealthy weight gain | No effect of intervention on unhealthy gains in weight | 546 | ⊕⊕⊕⊝ |
| Self‐acceptance/self‐worth | One study (N = 190) reported no effect of intervention on self‐acceptance. A second CRt of the same intervention reported improved self‐worth in those children who received the intervention | 546 | ⊕⊕⊕⊝ |
| Binge eating | No effect of intervention on binge eating | 556 | ⊕⊕⊕⊝ |
| RCT: randomised controlled trial | |||
| GRADE Working Group grades of evidence | |||
| 1Downgraded as this study has two domains at high risk of bias. | |||
| Diet and physical activity interventions combined compared to control for preventing obesity in children aged 13 to 18 years | |||||
| Patient or population: children aged 13‐18 years | |||||
| Outcomes | Anticipated absolute effects* (95% CI) | № of participants | Certainty of the evidence | Comments | |
| Risk with control | Risk with diet and physical activity interventions combined | ||||
| Body‐mass index z score (zBMI) | The mean zBMI ranged from 0.21 to 0.81 | MD 0.01 higher (0.05 lower to 0.07 higher) | 16,543 | ⊕⊕⊝⊝ | Combined diet and physical activity interventions may result in little to no difference in zBMI |
| Body‐mass index (BMI) | The mean BMI ranged from 18.99 to 24.57 kg/m2 | MD 0.02 kg/m2 lower (0.1 lower to 0.05 higher) | 16,583 | ⊕⊕⊝⊝ | Combined diet and physical activity interventions may result in little to no difference in BMI |
| *The risk in the intervention group (and its 95% confidence interval) is based on the assumed risk in the comparison group and the relative effect of the intervention (and its 95% CI). | |||||
| GRADE Working Group grades of evidence | |||||
| 1Heterogeneity is very high, measured at 92% with I2 statistic. | |||||
| Adverse events outcomes for dietary combined with physical activity interventions compared to control for preventing obesity in children aged13 to 18 years | |||
| Patient or population: children aged 13‐18 years | |||
| Outcomes | Impact | № of participants | Certainty of the evidence |
| Depression | No effects of the intervention on depression | 779 | ⊕⊕⊕⊕ |
| Clinical levels of shape and weight concern | No effect of intervention on clinical numbers of shape or weight concern | 282 | ⊕⊕⊝⊝ |
| Anxiety | No effect of the intervention on anxiety | 779 | ⊕⊕⊕⊕ |
| RCT: randomised controlled trial | |||
| GRADE Working Group grades of evidence | |||
| 1Downgraded for risk of bias because these data appear to be from a post hoc subgroup analysis. | |||
| Dietary interventions compared to physical activity interventions for preventing obesity in children aged 6 to 12 years | |||||
| Patient or population: children aged 6‐12 years | |||||
| Outcomes | Anticipated absolute effects* (95% CI) | № of participants | Certainty of the evidence | Comments | |
| Risk with physical activity interventions | Risk with dietary intervention | ||||
| Body‐mass index (BMI) | The mean BMI ranged from 17.4 to 18.8 kg/m2 | MD 0.03 kg/m2 lower (0.25 lower to 0.2 higher) | 4917 | ⊕⊕⊕⊕ | Dietary interventions result in little to no difference in BMI compared to physical activity interventions when delivered in schools to children aged 6‐12 years |
| Body‐mass index z score (zBMI) | The mean zBMI was 0.2 | MD 0.11 lower | 1205 | ⊕⊕⊕⊕ | 'Dietary interventions' results in little to no difference in zBMI compared to physical activity interventions when delivered in schools to children aged 6‐12 years |
| *The risk in the intervention group (and its 95% confidence interval) is based on the assumed risk in the comparison group and the relative effect of the intervention (and its 95% CI). | |||||
| GRADE Working Group grades of evidence | |||||
| Diet and physical activity interventions combined compared to physical activity interventions alone for preventing obesity in children aged 6 to 12 years | |||||
| Patient or population: children aged 6‐12 years | |||||
| Outcomes | Anticipated absolute effects* (95% CI) | № of participants | Certainty of the evidence | Comments | |
| Risk with physical activity interventions | Risk with diet and physical activity interventions combined | ||||
| Body‐mass index (BMI) | The mean BMI was 17.7 kg/m2 | MD 0.04 kg/m2 lower (1.05 lower to 0.97 higher) | 3946 | ⊕⊕⊕⊕ | Combined dietary and physical activity interventions result in little to no difference in BMI compared to physical activity interventions when delivered in schools to children aged 6‐12 years |
| Body‐mass index z score (zBMI) | The mean zBMI was 0.15 | MD 0.16 lower (0.57 lower to 0.25 higher) | 3946 | ⊕⊕⊕⊕ | Combined dietary and physical activity intrventions result in little to no difference in zBMI compared to physical activity interventions when delivered in schools to children aged 6‐12 years |
| *The risk in the intervention group (and its 95% confidence interval) is based on the assumed risk in the comparison group and the relative effect of the intervention (and its 95% CI). | |||||
| GRADE Working Group grades of evidence | |||||
| Dietary interventions alone compared to diet and physical activity interventions combined for preventing obesity in children aged 6 to 12 years | |||||
| Patient or population: children aged 6‐12 years | |||||
| Outcomes | Anticipated absolute effects* (95% CI) | № of participants | Certainty of the evidence | Comments | |
| Risk with diet and physical activity interventions combined | Risk with dietary intervention | ||||
| Body‐mass index (BMI) | The mean BMI was 17.4 kg/m2 | MD 0.28 kg/m2 lower (1.67 lower to 1.11 higher) | 3971 | ⊕⊕⊕⊕ | Dietary interventions alone result in little to no difference in BMI compared to diet and physical activity interventions combined when delivered in schools to children aged 6‐12 years |
| Body‐mass index z score (zBMI) | The mean zBMI was 0.2 | MD 0.05 higher (0.38 lower to 0.48 higher) | 3971 | ⊕⊕⊕⊕ | Dietary interventions alone result in little to no difference in zBMI compared to diet and physical activity interventions combined when delivered in schools to children aged 6‐12 years |
| *The risk in the intervention group (and its 95% confidence interval) is based on the assumed risk in the comparison group and the relative effect of the intervention (and its 95% CI). | |||||
| GRADE Working Group grades of evidence | |||||
| Study | Type | Country | Theory | Setting | |||||
| Childcare/ preschool | Primary/ secondary school | Health Service | Community | Home | Duration of intervention | ||||
| Alkon 2014 | D and PA | USA | NR | X | ≤ 12 months | ||||
| Annesi 2013 | PA | USA | Social Cognitive and Self‐efficacy Theory | X | ≤ 12 months | ||||
| Barkin 2012 | D and PA | USA | Social Cognitive Theory, Transtheoretical Model of Change | X | ≤ 12 months | ||||
| Bellows 2013a | PA | USA | NR | X | > 12 months | ||||
| Birken 2012 | PA (screen time) | Canada | NR | X | ≤ 12 months | ||||
| Bonis 2014 | D and PA | USA | NR | X | ≤ 12 months | ||||
| Bonuck 2014 | D (bottle use) | USA | NR | X | ≤ 12 months | ||||
| Bonvin 2013 | PA | Switzerland | Socioecological Model | X | ≤ 12 months | ||||
| Campbell 2013 | D and PA | Australia | Social Cognitive Theory | X | > 12 months | ||||
| Crespo 2012 | D and PA | US‐Mexico border | Social Cognitive Theory and Health Belief Model | X | X | X | ≤ 12 months | ||
| Daniels 2012 | D | Australia | Attachment theory, Anticipatory Guidance, Social Cognitive Approach | X | > 12 months | ||||
| De Bock 2012 | D | Germany | Social Learning Theory and Exposure theory | X | ≤ 12 months | ||||
| De Coen 2012 | D and PA | Belgium | Socio‐ecological model | X | > 12 months | ||||
| Dennison 2004 | PA | USA | Behaviour change | X | ≤ 12 months | ||||
| De Vries 2015 | PA | Netherlands | NR | X | X | ≤ 12 months | |||
| Feng 2004 | D and PA (education only) | China | NR | X | > 12 months | ||||
| Fitzgibbon 2005 | D and PA | USA | Social Cognitive Theory | X | ≤ 12 months | ||||
| Fitzgibbon 2006 | D and PA | USA | Social Cognitive Theory | X | ≤ 12 months | ||||
| Fitzgibbon 2011 | D and PA | USA | Social Cognitive Theory, Self‐determination theory | X | X | ≤ 12 months | |||
| Haines 2013 | D and PA | USA | NR | X | ≤ 12 months | ||||
| Harvey‐Berino 2003 | D and PA | USA | Behaviour Change | X | ≤ 12 months | ||||
| Keller 2009 | D and PA | Germany | NR | X | X | ≤ 12 months | |||
| Klein 2010 | D and PA | Germany | Theory of Planned Behaviour, Precaution Adoption Process | X | > 12 months | ||||
| Mo‐suwan 1998 | PA | Thailand | Environmental Change | X | ≤ 12 months | ||||
| Natale 2014 | D and PA | USA | Socio‐ecological model | X | ≤ 12 months | ||||
| Nemet 2011 | D and PA | Israel | NR | X | ≤ 12 months | ||||
| Ostbye 2012 | D and PA | USA | Social Cognitive Theory | X | ≤ 12 months | ||||
| Paul 2011 | D | USA | NR | X | ≤ 12 months | ||||
| Puder 2011 | D and PA | Switzerland | Social Ecological model | X | > 12 months | ||||
| Reilly 2006 | PA | Scotland | Environmental Change and Behaviour Change | X | ≤ 12 months | ||||
| Roth 2015 | PA | Germany | NR | X | ≤ 12 months | ||||
| Rush 2012 | D and PA | New Zealand | NR | X | > 12 months | ||||
| Skouteris 2016 | D and PA | Australia | Learning and Social Cognitive Theories | X | ≤ 12 months | ||||
| Slusser 2012 | D and PA | USA | Social Learning Theory | X | X | X | ≤ 12 months | ||
| Story 2012 | D and PA | USA | NR | X | > 12 months | ||||
| Verbestel 2014 | D and PA | Belgium | Theories of Information Processing; the Elaboration Likelihood Model; and the Precaution‐Adoption Process Model | X | ≤ 12 months | ||||
| Wen 2012 | D and PA | Australia | NR | X | > 12 months | ||||
| Yilmaz 2015 | PA (screen time) | Turkey | Social Cognitive theory | X | X | ≤ 12 months | |||
| Zask 2012 | D and PA | Australia | NR | X | ≤ 12 months | ||||
| Study | Type | Country | Theory | Setting | |||||
| Childcare/ preschool | Primary/ secondary school | Health Service | Community | Home | Duration of intervention | ||||
| Amaro 2006 | D | Italy | NR | X | ≤ 12 months | ||||
| Baranowski 2003 | D and PA | USA | Social Cognitive Theory and Family Systems Theory | X | X | ≤ 12 months | |||
| Baranowski 2011 | D and PA | USA | Social Cognitive, Self‐determination, Persuasion Theories | X | ≤ 12 months | ||||
| Beech 2003 | D and PA | USA | Social Cognitive Theory and Family Systems Theory | X | ≤ 12 months | ||||
| Bohnert 2013 | D and PA | USA | Social Cognitive Theory and Sociocultural Theory | X | ≤ 12 months | ||||
| Brandstetter 2012 | D and PA | Germany | Social Cognitive Theory | X | X | ≤ 12 months | |||
| Branscum 2013 | D and PA | USA | Social Cognitive Theory | X | ≤ 12 months | ||||
| Brown 2013 | D and PA | USA | Transtheoretical Model‐Stages of Change, Social Cognitive Theory | X | X | ≤ 12 months | |||
| Caballero 2003 | D and PA | USA | Social Learning Theory | X | > 12 months | ||||
| Cao 2015 | D and PA | China | NR | X | X | > 12 months | |||
| Chen 2010 | D and PA | USA | Social Cognitive Theory | X | ≤ 12 months | ||||
| Coleman 2005 | D and PA | USA | NR | X | > 12 months | ||||
| Coleman 2012 | D | USA | Ecological and Developmental Systems Theories, Behavioural Ecological Models | X | > 12 months | ||||
| Cunha 2013 | D | Brazil | Transtheoretical Model | X | ≤ 12 months | ||||
| Damsgaard 2014 | D | Denmark | NR | X | ≤ 12 months | ||||
| De Heer 2011 | D and PA | USA | Ecological, Social Cognitive Theory | X | ≤ 12 months | ||||
| De Ruyter 2012 | D (drinks) | Netherlands | NR | X | > 12 months | ||||
| Donnelly 2009 | PA | USA | Environmental Model | X | > 12 months | ||||
| Elder 2014 | D and PA | USA | NR | X | > 12 months | ||||
| Epstein 2001 | D | USA | NR | X | ≤ 12 months | ||||
| Fairclough 2013 | D and PA | UK | Social Cognitive Theory | X | ≤ 12 months | ||||
| Foster 2008 | D and PA | USA | Settings‐based | X | > 12 months | ||||
| Fulkerson 2010 | D | USA | Social Cognitive Theory | X | X | ≤ 12 months | |||
| Gentile 2009 | D and PA | USA | Socio‐ecological theory | X | X | X | ≤ 12 months | ||
| Gortmaker 1999a | D and PA | USA | Social Cognitive Theory | X | > 12 months | ||||
| Grydeland 2014 | D and PA | Norway | Socioecological framework | X | > 12 months | ||||
| Gutin 2008 | PA | USA | Environmental change | X | > 12 months | ||||
| Habib‐Mourad 2014 | D and PA | Lebanon | Social Cognitive Theory | X | ≤ 12 months | ||||
| Haire‐Joshu 2010 | D and PA | USA | Social Cognitive Theory, Ecological Model | X | ≤ 12 months | ||||
| Han 2006 | D | China | NR | X | > 12 months | ||||
| HEALTHY Study Gp 2010 | D and PA | USA | NR | X | > 12 months | ||||
| Hendy 2011 | D and PA | USA | Social Cognitive Theory, Self‐determination Theory, Group Socialization Theory | X | ≤ 12 months | ||||
| Herscovici 2013 | D and PA | Argentina | NR | X | ≤ 12 months | ||||
| Howe 2011 | PA | USA | NR | X | ≤ 12 months | ||||
| James 2004 | D | UK | NR | X | ≤ 12 months | ||||
| Jansen 2011 | D and PA | USA | Theory of Planned Behaviour and Ecological Model | X | ≤ 12 months | ||||
| Johnston 2013 | D and PA | USA | NR | X | > 12 months | ||||
| Kain 2014 | D and PA | Chile | NR | X | ≤ 12 months | ||||
| Khan 2014 | PA | USA | NR | X | ≤ 12 months | ||||
| Kipping 2008 | D and PA | UK | Social Cognitive Theory and Behavioural C | X | ≤ 12 months | ||||
| Kipping 2014 | D and PA | UK | Social Cognitive Theory | X | ≤ 12 months | ||||
| Klesges 2010 | D and PA | USA | NR | X | > 12 months | ||||
| Kriemler 2010 | PA | Switzerland | Socio‐ecological Model | X | ≤ 12 months | ||||
| Lazaar 2007 | PA | France | NR | X | ≤ 12 months | ||||
| Levy 2012 | D and PA | Mexico | NR | X | ≤ 12 months | ||||
| Li 2010a | PA | China | NR | X | X | ≤ 12 months | |||
| Llargues 2012 | D and PA | Spain | Investigation, Vision, Action and Change Methodology | X | > 12 months | ||||
| Macias‐Cervantes 2009 | PA | Mexico | NR | X | X | ≤ 12 months | |||
| Madsen 2013 | PA | USA | NR | X | ≤ 12 months | ||||
| Magnusson 2012 | D and PA | Iceland | NR | X | > 12 months | ||||
| Marcus 2009 | D and PA | Sweden | NR | X | > 12 months | ||||
| Martinez‐Vizcaino 2014 | PA | Spain | Socio‐ecological model | X | ≤ 12 months | ||||
| Meng 2013 | D, D and PA, PA | China | NR | X | ≤ 12 months | ||||
| Morgan 2011 | D and PA | Australia | Social Cognitive Theory | X | ≤ 12 months | ||||
| Muckelbauer 2010 | D (water) | Germany | Theory of Planned Behaviour | X | ≤ 12 months | ||||
| Nollen 2014 | D and PA | USA | NR | X | ≤ 12 months | ||||
| Nyberg 2015 | D and PA | Sweden | Social Cognitive Theory | X | ≤ 12 months | ||||
| Paineau 2008 | D | France | NR | X | X | ≤ 12 months | |||
| Papadaki 2010 | D | Netherlands, Denmark, UK, Greece, Germany, Spain, Bulgaria, and Czech Republic | NR | X | ≤ 12 months | ||||
| Reed 2008 | PA | Canada | Socio‐ecological model | X | ≤ 12 months | ||||
| Robbins 2006 | PA | USA | Health Promotion Model and the Transtheoretical Model | X | X | ≤ 12 months | |||
| Robinson 2003 | D and PA | USA | Social Cognitive Theory | X | ≤ 12 months | ||||
| Robinson 2010 | PA | USA | Social Cognitive Model | X | > 12 months | ||||
| Rodearmel 2006 | D and PA | USA | NR | X | ≤ 12 months | ||||
| Rosario 2012 | D | Portugal | Health Promotion Model and Social Cognitive Theory | X | ≤ 12 months | ||||
| Rosenkranz 2010 | D and PA | USA | Social Cognitive Theory | X | ≤ 12 months | ||||
| Roth 2015 | PA | Germany | NR | X | ≤ 12 months | ||||
| Rush 2012 | D and PA | New Zealand | NR | X | > 12 months | ||||
| Safdie 2013 | D and PA x 2 | Mexico | Ecological principles, Theory of Planned Behaviour, Social Cognitive Theory, Health Belief Model | X | > 12 months | ||||
| Sahota 2001 | D and PA | UK | Multicomponent health promotion programme, based on the Health Promoting Schools concept | X | ≤ 12 months | ||||
| Sallis 1993 | PA | USA | Behaviour Change and Self‐management | X | > 12 months | ||||
| Salmon 2008 | PA | Australia | Social Cognitive Theory and Behavioural Choice Theory | X | ≤ 12 months | ||||
| Santos 2014 | D and PA | Canada | NR | X | ≤ 12 months | ||||
| Sevinc 2011 | D and PA vs D | Turkey | NR | X | ≤ 12 months | ||||
| Sichieri 2009 | D | Brazil | NR | X | ≤ 12 months | ||||
| Siegrist 2013 | D and PA | Germany | NR | X | ≤ 12 months | ||||
| Simon 2008 | PA | France | Behaviour Change and Socio‐ecological Model | X | > 12 months | ||||
| Spiegel 2006 | D and PA | USA | Theory of reasoned action, constructivism | X | ≤ 12 months | ||||
| Stolley 1997 | D and PA | USA | NR | X | ≤ 12 months | ||||
| Story 2003 | D and PA | USA | Social Cognitive Theory, Youth Development, and Resiliency | X | X | ≤ 12 months | |||
| Telford 2012 | PA | Australia | NR | X | > 12 months | ||||
| Thivel 2011 | PA | France | NR | X | ≤ 12 months | ||||
| Vizcaino 2008 | PA | Spain | NR | X | ≤ 12 months | ||||
| Wang 2012 | D and PA | China | NR | X | ≤ 12 months | ||||
| Warren 2003 | D and PA | England | Social Learning Theory | X | X | > 12 months | |||
| Williamson 2012 | D and PA | USA | Social Learning Theory | X | > 12 months | ||||
| Study | Type | Country | Theory | Setting | Duration of intervention | ||||
| Childcare/ preschool | Primary/ secondary school | Health Service | Community | Home | |||||
| Andrade 2014 | D and PA | Ecuador | Social Cognitive Theory, Information‐Motivation Behavioral Skills Model, Control Theory, Trans‐ theoretical Model, Theory of Planned Behavior | X | > 12 months | ||||
| Black 2010 | D and PA | USA | Social Cognitive Theory and Motivational Interviewing | X | X | ≤ 12 months | |||
| Bonsergent 2013 | D and PA | France | NR | X | X | X | > 12 months | ||
| Christiansen 2013 | PA | Denmark | Social Ecological framework | X | > 12 months | ||||
| Dewar 2013 | D and PA | Australia | Social Cognitive Theory | X | ≤ 12 months | ||||
| Ebbeling 2006 | D | USA | NR | X | ≤ 12 months | ||||
| El Ansarai 2010 | PA | Egypt | NR | X | ≤ 12 months | ||||
| Ezendam 2012 | D and PA | Netherlands | Theory of Planned Behavior, Precaution Adoption Process Model, Implementation Intentions | X | ≤ 12 months | ||||
| Farias 2015 | PA | Brazil | NR | X | ≤ 12 months | ||||
| French 2011 | D and PA | USA | NR | X | X | ≤ 12 months | |||
| Haerens 2006 | D and PA | Belgium | Theory of Planned Behaviours and Transtheoretical Model | X | > 12 months | ||||
| Lana 2014 | D and PA (online) | Mexico, Spain | Attitude, Social influence and Self‐Efficacy (ASE model) and Transtheoretical Model | X | ≤ 12 months | ||||
| Lubans 2011 | PA | Australia | Social Cognitive Theory | X | > 12 months | ||||
| Mauriello 2010 | D and PA | USA | Transtheoretical Model of Behavior Change | X | ≤ 12 months | ||||
| Melnyk 2013 | D and PA | USA | Cognitive Theory | X | ≤ 12 months | ||||
| Mihas 2010 | D | Greece | Social Learning Theory | X | ≤ 12 months | ||||
| Neumark‐Sztainer 2003 | D and PA | USA | Social Cognitive Theory | X | ≤ 12 months | ||||
| Neumark‐Sztainer 2010 | D and PA | USA | Social Cognitive Theory, Theory of Planned Behaviour | X | > 12 months | ||||
| Pate 2005 | PA | USA | Socio‐ecological model and Social Cognitive Theory | X | ≤ 12 months | ||||
| Patrick 2006 | D and PA | USA | Behavioural Determinants model, Social Cognitive Theory and Transtheoretical Model | X | X | ≤ 12 months | |||
| Peralta 2009 | D and PA | Australia | Social Cognitive Theory | X | ≤ 12 months | ||||
| Shin 2015 | D | USA | Social Cognitive Theory | X | ≤ 12 months | ||||
| Singh 2009 | D and PA | Netherlands | Behaviour Change and Environmental | X | > 12 months | ||||
| Smith 2014 | PA | Australia | Self‐determination Theory and Social Cognitive Theory | X | ≤ 12 months | ||||
| Velez 2010 | PA | USA | NR | X | ≤ 12 months | ||||
| Viggiano 2015 | D and PA (board game) | Italy | NR | X | ≤ 12 months | ||||
| Weeks 2012 | PA | Australia | NR | X | ≤ 12 months | ||||
| Whittemore 2013 | D and PA | USA | Theory of Interactive Technology, Social Learning Theory | X | X | ≤ 12 months | |||
| Wilksch 2015 | D and PA | Australia | NR | X | ≤ 12 months | ||||
| Footnotes D: diet; NR: not reported; PA: physical activity | |||||||||
| Study | Type | Control |
| D and PA | Waitlist | |
| D | No intervention | |
| D and PA | Usual care | |
| PA | Usual care | |
| D and PA | Day camp | |
| D and PA | Health‐related video games | |
| D and PA | School‐readiness programme | |
| 1. D and PA child‐targeted 2. D and PA parent‐targeted | Self‐esteem | |
| PA (plus diet) | Diet intervention only | |
| PA (screen time) | Safe media use | |
| D and PA | No intervention | |
| D and PA | No intervention | |
| D and PA | Waitlist | |
|
| No intervention | |
| D (bottle use) | No intervention | |
| PA | Waitlist | |
| D and PA | Usual care presumed as intervention integrated into school curriculum | |
| D and PA (theory‐based) | Knowledge‐based D and PA | |
| D and PA | Alcohol and drug comparison | |
| D and PA | Usual care presumed as no details but school‐based intervention | |
| D and PA | Newsletters on non‐obesity‐focused themes | |
| D and PA | No intervention | |
| D and PA | Waitlist | |
| D and PA | General health information related to nutrition, dental care, safety, skin care, and risk‐taking behaviours | |
| PA | Usual care | |
| D and PA | No intervention (financial incentive to participate) | |
| D | Usual care presumed as no details but school‐based intervention | |
| 1. D + PA family‐only 2. D + PA community‐only 3. D + PA family + community | No intervention | |
| D | No intervention | |
| D | Packed lunch from home | |
| D | Usual care | |
| D | Waitlist | |
| D and PA | Usual care presumed as no details but primarily school‐based intervention | |
| D and PA | Health workbooks and incentives | |
| D (drink) | Similar sugar‐containing drink in participants who commonly drank them | |
| PA | Standard care without PA recommendations | |
| PA | Health and safety programme | |
| D and PA | Usual care? presumed as no details but school‐based intervention | |
| PA | Usual care ‐ regular classroom instruction without physically active lessons | |
| D (drink) | Usual drink consumption | |
| PA (plus ‘normal’ exercise schedule provided by the school) | Usual care ‘normal’ exercise schedule provided by the school | |
| D and PA | No intervention – measurement only | |
| D (fruit + veg) | D (fat + sugar) | |
| D and PA | No intervention | |
| D and PA | Did not teach a specific unit focused on healthy eating and PA | |
| PA | Usual care physical activity at school | |
| D and PA (education only) | No intervention ‐ translated | |
| D and PA | General health intervention | |
| D and PA | General health intervention | |
| D and PA | General health intervention | |
| D and PA | No intervention | |
| D and PA | No intervention | |
| D | No intervention | |
| D and PA (plus community component) | Community component only | |
| D and PA | Usual care health curricula and PE classes | |
| D and PA | Usual care presumed as no details but school‐based intervention | |
| PA | No intervention presumed as no details (after‐school intervention) | |
| D and PA | Usual curriculum | |
| 1. D+PA parent 2. D+PA child alone | Usual care presumed as no details but school‐based intervention | |
| D and PA | Mailed materials focused on child development | |
| D and PA | Usual care | |
| D | Usual care presumed as no details but school‐based intervention ‐ translated | |
| D and PA (plus parenting support) | Parenting support but refrained from discussing child or parent eating and exercise behaviour | |
| D and PA | No intervention ‐ assessment only | |
| D and PA (token rewards) | Token rewards for three ‘‘Good Citizenship Behaviors.’’ | |
| D and PA | Usual care presumed as no details but school‐based intervention | |
| PA | No intervention and were not allowed to stay for the after‐school intervention but rather instructed not to change their daily after‐school routine | |
| D (drinks) | Usual care presumed as no details but school‐based intervention | |
| D and PA | Usual care curriculum | |
| D and PA | Self‐help | |
| D and PA | Usual care presumed as no details but school‐based intervention | |
| D and PA | No intervention – study translated in previous version of review | |
| PA | Maintain regular after‐school routine, financial incentive for measurements | |
| D and PA | Waitlist | |
| D and PA | Standard teaching | |
| D and PA | No intervention | |
| D and PA | Self‐esteem and social efficacy | |
| PA | Not informed of an intervention group | |
| 1. D and PA online only 2. D and PA online plus texts | No intervention presumed as no details | |
| PA | Usual care presumed as no details but school‐based intervention | |
| D and PA | Usual care presumed as no details but school‐based intervention | |
| PA | No intervention | |
| D and PA | Usual care presumed as no details but school‐based intervention | |
| PA | Waitlist | |
| PA | Maintain the same level of physical activity | |
| PA | No intervention presumed as no details | |
| D and PA (plus 2 x 40‐min PA + incentives) | 2 x 40‐min PA + incentives | |
| D and PA | Normal curriculum | |
| PA (plus 2 h/week of physical activity at low to moderate intensity) | Standard physical education curriculum (2 h/week of physical activity at low to moderate intensity) | |
| D and PA (multimedia) | No intervention | |
| D and PA | Attention control programme ‐ common health topics | |
| 1. D 2. PA 3. D and PA | No intervention | |
| D | Usual care presumed as no details but school‐based intervention | |
| PA | Usual care presumed as no details but school‐based intervention | |
| D and PA | Waitlist | |
| D (water) | No intervention | |
| D and PA | Attention control ‐ safety education curriculum | |
| D and PA | Regular kindergarten schedule | |
| D and PA | Regular physical education class and minimal intervention (written materials on healthy eating and physical activity at baseline) | |
| D and PA (plus all‐girls PE class during the first semester) | All‐girls PE class during the first semester then usual PE | |
| D and PA (screen time only, via mobile technology) | Same content in a written manual but no prompting | |
| D and PA | Waitlist | |
| D and PA (plus financial incentives) | Monthly newsletters emphasising pre‐reading skills plus financial incentives | |
| 1. reduce fat + increase complex carbohydrate 2. reduce both fat+sugar+increase complex carbohydrate | No advice | |
| 1. low protein /low glycaemic index 2. low protein/high glycaemic index 3. high protein/low glycaemic index 4. high protein/high glycaemic index | National dietary guidelines, with medium protein content and no specific instructions on glycaemic index | |
| PA (plus enrolled in PE) | Enrolled in PE classes | |
| D and PA (plus lottery tickets for small cash prizes) | Sun protection plus lottery tickets for small cash prizes | |
| 1. soothe/sleep 2. introduction to solids 3. combination | No intervention | |
| PA | Physical activity curriculum sessions | |
| D and PA | Regular school curriculum | |
| PA | Usual care | |
| PA | Usual care curriculum | |
| PA | Handout listing the PA recommendations | |
| D and PA | Active comparison ‐ health education programme to promote healthful diet and activity patterns via newsletters and delivering health education lectures | |
| PA | Information‐based health education | |
| D and PA | Maintain usual eating and step patterns (given step counter and logs same as intervention group) | |
| D | Usual care presumed as no details but school‐based intervention | |
| D and PA | No intervention presumed (Girl Scouts USA) | |
| PA | Usual care presumed, pre‐school setting | |
| D and PA | No additional resourcing or information | |
| 1. Basic D and PA 2. Basic D and PA plus financial investment and resources | No changes were made to existing nutrition or physical activity practices | |
| D and PA | Usual care presumed as no details but school‐based intervention | |
| PA | Usual care PE | |
| 1. Behaviour modification of PA 2. Fundamental movement skills 3. Combination | Usual care curriculum | |
| D and PA | Usual care regular curriculum | |
| 1. D 2. D and PA | Usual care presumed as no details but school‐based intervention | |
| D | No intervention | |
| D (drinks) | 2 x 1‐h general sessions on health issues and printed general advices regarding healthy diets | |
| D and PA | Usual care | |
| PA | Usual care school curriculum | |
| D and PA | Usual care regular curriculum | |
| D and PA | Waitlist | |
| D and PA | Waitlist | |
| PA | Waitlist and usual practice (i.e. regularly scheduled school sports and PE) | |
| D and PA | Data collection only | |
| D and PA | Attention placebo group | |
| D and PA | ‘‘active placebo,’’ non‐nutrition/PA condition, promoting self‐esteem and cultural enrichment | |
| D and PA | Usual care presumed as no details but school‐based intervention | |
| PA | Usual care, common practice PE | |
| PA | Not aware of the intervention in other schools | |
| PA | No intervention | |
| D and PA | No intervention presumed as no details | |
| D and PA (board game) | No intervention | |
| PA (plus standard PE curriculum (3 h/week of PA at low to moderate intensity) | Standard PE curriculum (3 h/week of PA at low to moderate intensity) | |
| D and PA | Usual care presumed as no details but school‐based intervention ‐ translated | |
| 1. D 2. PA 3. D and PA | Educational programme about food in a ‘non‐nutrition’ sense | |
| PA | Regular PE warm‐up | |
| D and PA (plus usual childhood nursing service from community health service nurses) | Usual childhood nursing service from community health service nurses plus health promotion material | |
| D and PA ‐ coping skills training (plus health education and behavioral support) | Health education and behavioral support | |
| 1. D and PA, 'Media Smart' 2. D and PA, 'Life Smart' 3. D and PA, 'Helping, Encouraging, Listening and Protecting Peers' | Usual school class | |
| 1. D and PA, primary prevention + environmental modification 2. D and PA, primary + secondary prevention with an added classroom and internet education component | No intervention | |
| PA (screen time) | Not aware of the intervention | |
| D and PA | Waitlist | |
| D: diet; PA: physical activity; PE: physical education | ||
| Age group | Source of funding | Was the writing of reports and research independent from industry | Source of funding was from food/nutrition or intervention industry | ||||
| Non‐industrya: number (%) | Not reported: number (%) | Not funded: number (%) | Industryb: number (%) | Industry and non‐industry: number (%) | |||
| 0‐5 | 28 (71.8) | 6 (15.4) | 0 (0) | 0 (0) | 5 (12.8) | 2/5 | 3/5c |
| 6‐12 | 69 (81.2) | 7 (8.2) | 0 (0) | 1 (2.4) | 7 (8.2) | 3/8 | 6/8d |
| 13‐18 | 26 (89.7) | 1 (3.4) | 2 (6.9) | 0 (0) | 2 (6.9) | 1/2 | 2/2e |
| aFunding from government organisations, not‐for‐profit organisations, charities etc. | |||||||
| Study name | Intervention type | Control | Adverse events (overall/any) | Sufficiency of infant weight gain | Injuries | Accidents | Infections |
| USA | D and PA Childcare 24 months N = 383 | General health intervention | No adverse events reported | ||||
| USA | D and PA Home 12 months N = 110 | No intervention | No Effect (< 5th percentile) | ||||
| Switzerland | D and PA Childcare Nil: end of intervention N = 652 | Regular school curriculum | No difference | No injuries occurred | |||
| Germany | D and PA Childcare 2‐4 months N = 709 | Usual care presumed, preschool setting | No difference | No difference | |||
| D: diet; PA: physical activity | |||||||
| Study name | Intervention type | Control | Adverse events (overall/any) | Number underweight/health of underweight children | Increased weight concern | Body satisfaction (body image) | Injuries | Depressive symptoms |
| USA | D and PA Community Nil: end of intervention I = 42 | Self‐esteem | Visit to healthcare provider | NR/NR | Unhealthy weight concern | Self‐perceived body shape and body shape dissatisfaction (Silhouettes) | C = 2 (11%) | NR |
| USA | D and PA School Nil: end of intervention I = 479 | No intervention | NR | No change in remission of underweight/NR | NR | Body dissatisfaction Eating Disorder Inventory MD = 0.14 (95% CI −0.73 to 0.45) | NR | NR |
| USA | D and PA I = 2307 | No intervention ‐ assessment only | < 3% adverse events, nearly similar between groups | NR/NR | NR | NR | NR | NR |
| China | PA 12 months I = 2092 | No intervention | NR | No effect on zBMI of underweight children | NR | NR | NR | NR |
| Spain | PA School I = 420 | Standard PE curriculum (2 h/week of PA at low to moderate intensity) | NR | NR/no difference in % underweight | NR | NR | Two minor ankle sprains risk 0.4% (group not specified) | NR |
| Sweden | PA School 6 months I =124 | Waitlist | NR | NR/NR | NR | NR | NR | NR |
| USA | PA Nil: end of intervention I = 107 | Active comparison ‐ health education programme to promote healthful diet and activity patterns via newsletters and delivering health education lectures | NR | NR/no change No difference in percent of underweight RR 1.11 (95% CI 0.3 to 4.0) | No effect Overconcern with | Self‐perceived body shape | NR | Children’s Depression Inventory |
| Germany | D and PA Nil: end of intervention I = 427 | Usual care | NR | Waist circumference of children < 10th centile for weight did not differ between the intervention and control group (P = 0.373)/NR | NR | NR | NR | NR |
| C: control; D: diet; I: intervention; MD: mean difference; NR: not reported; PA: physical activity; PE: physical education; RD: risk difference; RR: risk ratio; SE: standard error; zBMI: body‐mass index z score | ||||||||
| Study name | Intervention type | Control | Unhealthy weight control | Binge eating | Clinical levels of shape or weight concern | Body satisfaction (body image) | Self‐acceptance/self‐worth | Depressive symptoms | Anxiety |
| USA | D and PA School 6 months I = 358 | Attention control programme covering common health topics | NR | NR | NR | NR | NR | No effect: | No effect: P = 0.52 |
| USA | PA School 8 months I = 84 C = 106 | Regular PE class and minimal intervention (written materials on healthy eating and physical activity at baseline) | No difference | No difference Percent in past month I = 10.8%, n = 84; C = 19.3%, n = 106; P = 0.29 | NR | NR | No difference between groups (scale 5‐20; higher score is better) Self‐worth: mean I = 14.73, n=84; C = 14.16, n = 106; P = 0.33 | NR | NR |
| USA | PA School 5 months I = 182 | All‐girls PE class during the 1st semester then usual care PE | No difference | No difference Percent in past month I = 6.0%, n = 182; C = 11.4%, n = 174; ES = −5.41; P = 0.12* | NR | No difference | Different Improved self‐worth (Harter scale (scale 5‐20) | NR | NR |
| Australia | D and PA School 11 months I =347 | Usual school class | NR | NR | No differences between groups Girls: I = 28/65 (18%); C = 37/52 (19%) Boys: I = 2/100 (2%); C = 3/67 (2%) | NR | NR | NR | NR |
| C: control; D: diet; ES: Effect size Difference between intervention and control values at follow up*; I: intervention; MD: mean difference; NR: not reported; PA: physical activity; PE: physical education; RD: risk difference; RR: risk ratio; SE: standard error; zBMI: body‐mass index z score | |||||||||
| NR=Not reported ES Effect size* = Intervention effects are estimates that represent the difference in the outcome variable at post‐class or follow‐up in intervention condition compared to control condition, adjusted for age, race, and school as | |||||||||
| Age group | Outcome | Intervention type | ||||
| Dietary | Physical activity | Diet and physical activity | Total BMI | Total zBMI | ||
| 0‐5 years | BMI | 1 | 4 | 11 | 16 | |
| zBMI | 1 | 4 | 15 | 20 | ||
| 6‐12 years | BMI | 5 | 13 | 25 | 43 | |
| zBMI | 7 | 6 | 18 | 31 | ||
| 13‐18 years | BMI | 2 | 5 | 6 | 13 | |
| zBMI | 0 | 1 | 6 | 7 | ||
| Total | 72 | 58 | ||||
| BMI: body‐mass index; zBMI: body‐mass index z score | ||||||
| Children aged 0‐5 years | |||
| Setting | Intervention type | ||
| Diet | Physical activity | Diet and physical activity | |
| Home | |||
| Childcare | |||
| Healthcare | |||
| Wider community | |||
| School | ‐ | ‐ | ‐ |
| Count | 1 | 4 | 11 |
| BMI: body‐mass index | |||
| Children aged 6‐12 | |||
| Setting | Intervention type | ||
| Diet | Physical activity | Diet and physical activity | |
| Home | ‐ | ‐ | ‐ |
| Childcare | ‐ | ‐ | ‐ |
| Healthcare | ‐ | ‐ | ‐ |
| Wider community | |||
| School | |||
| Count | 5 | 13 | 25 |
| BMI: body‐mass index | |||
| Children aged 13‐18 years | |||
| Setting | Intervention type | ||
| Diet | Physical activity | Diet and physical activity | |
| Home | |||
| Childcare | ‐ | ‐ | ‐ |
| Healthcare | ‐ | ‐ | ‐ |
| Wider community | ‐ | ‐ | ‐ |
| School | |||
| Count | 2 | 5 | 6 |
| BMI: body‐mass index | |||
| Children aged 0‐5 years | |||
| Setting | Intervention type | ||
| Diet | Physical activity | Diet and physical activity | |
| Home | |||
| Childcare | |||
| Healthcare | |||
| Wider community | |||
| School | ‐ | ‐ | ‐ |
| Count | 1 | 4 | 15 |
| zBMI: body‐mass index z score | |||
| Children aged 6‐12 years | |||
| Setting | Intervention type | ||
| Diet | Physical activity | Diet and physical activity | |
| Home | |||
| Childcare | |||
| Healthcare | |||
| Wider community | |||
| School | |||
| Count | 7 | 6 | 18 |
| zBMI: body‐mass index z score | |||
| Children aged 13‐18 years | |||
| Setting | Intervention type | ||
| Diet | Physical activity | Diet and physical activity | |
| Home | ‐ | ‐ | |
| School | ‐ | ||
| Count | 0 | 1 | 6 |
| zBMI: body‐mass index z score | |||
| Outcome or subgroup title | No. of studies | No. of participants | Statistical method | Effect size |
| 1 zBMI Show forest plot | 1 | 520 | Mean Difference (Random, 95% CI) | ‐0.14 [‐0.32, 0.04] |
| Outcome or subgroup title | No. of studies | No. of participants | Statistical method | Effect size |
| 1 zBMI. Physical activity vs control ‐ setting Show forest plot | 4 | 1053 | Mean Difference (Random, 95% CI) | 0.01 [‐0.10, 0.13] |
| 1.1 Health system | 2 | 495 | Mean Difference (Random, 95% CI) | 0.02 [‐0.14, 0.17] |
| 1.2 Childcare/preschool | 2 | 558 | Mean Difference (Random, 95% CI) | 0.01 [‐0.17, 0.19] |
| 2 BMI. Physical activity vs control ‐ setting Show forest plot | 5 | 2233 | Mean Difference (Random, 95% CI) | ‐0.22 [‐0.44, 0.01] |
| 2.1 Health system | 1 | 143 | Mean Difference (Random, 95% CI) | ‐0.2 [‐0.59, 0.19] |
| 2.2 Childcare/preschool | 4 | 2090 | Mean Difference (Random, 95% CI) | ‐0.23 [‐0.50, 0.05] |
| Outcome or subgroup title | No. of studies | No. of participants | Statistical method | Effect size |
| 1 zBMI. Diet and physical activity vs control ‐ setting Show forest plot | 16 | 6261 | Mean Difference (Random, 95% CI) | ‐0.07 [‐0.14, ‐0.01] |
| 1.1 Childcare/preschool | 10 | 4913 | Mean Difference (Random, 95% CI) | ‐0.04 [‐0.09, 0.01] |
| 1.2 Health system | 1 | 121 | Mean Difference (Random, 95% CI) | ‐0.24 [‐0.46, ‐0.02] |
| 1.3 Wider community | 2 | 632 | Mean Difference (Random, 95% CI) | ‐0.02 [‐0.13, 0.09] |
| 1.4 Home | 3 | 595 | Mean Difference (Random, 95% CI) | ‐0.13 [‐0.35, 0.09] |
| 2 zBMI. Diet and physical activity vs control ‐ duration Show forest plot | 16 | 6261 | Mean Difference (Random, 95% CI) | ‐0.07 [‐0.14, ‐0.01] |
| 2.1 Duration of intervention ≤ 12 months | 13 | 4235 | Mean Difference (Random, 95% CI) | ‐0.09 [‐0.17, ‐0.01] |
| 2.2 Duration of intervention > 12 months | 3 | 2026 | Mean Difference (Random, 95% CI) | ‐0.02 [‐0.09, 0.06] |
| 3 BMI. Diet and physical activity vs control ‐ setting Show forest plot | 11 | 5536 | Mean Difference (Random, 95% CI) | ‐0.11 [‐0.21, ‐0.00] |
| 3.1 Home | 2 | 778 | Mean Difference (Random, 95% CI) | ‐0.33 [‐0.55, ‐0.10] |
| 3.2 Wider community | 1 | 75 | Mean Difference (Random, 95% CI) | ‐0.59 [‐0.94, ‐0.24] |
| 3.3 Childcare/preschool | 8 | 4683 | Mean Difference (Random, 95% CI) | ‐0.05 [‐0.14, 0.05] |
| 4 BMI. Diet and physical activity vs control ‐ duration Show forest plot | 11 | 5536 | Mean Difference (Random, 95% CI) | ‐0.11 [‐0.21, ‐0.00] |
| 4.1 Duration of intervention > 12 months | 1 | 667 | Mean Difference (Random, 95% CI) | ‐0.29 [‐0.56, ‐0.02] |
| 4.2 Duration of intervention ≤ 12 months | 10 | 4869 | Mean Difference (Random, 95% CI) | ‐0.09 [‐0.20, 0.01] |
| Outcome or subgroup title | No. of studies | No. of participants | Statistical method | Effect size |
| 1 zBMI ‐ setting Show forest plot | 9 | 7231 | Mean Difference (Random, 95% CI) | ‐0.03 [‐0.06, 0.01] |
| 1.1 School | 8 | 6771 | Mean Difference (Random, 95% CI) | ‐0.02 [‐0.06, 0.01] |
| 1.2 Wider community | 1 | 460 | Mean Difference (Random, 95% CI) | ‐0.16 [‐0.35, 0.04] |
| 2 BMI ‐ setting Show forest plot | 6 | 5061 | Mean Difference (Random, 95% CI) | ‐0.02 [‐0.11, 0.06] |
| 2.1 School | 5 | 4601 | Mean Difference (Random, 95% CI) | ‐0.02 [‐0.10, 0.07] |
| 2.2 Wider community | 1 | 460 | Mean Difference (Random, 95% CI) | ‐0.74 [‐1.68, 0.19] |
| Outcome or subgroup title | No. of studies | No. of participants | Statistical method | Effect size |
| 1 zBMI. Physical activity vs control ‐ setting Show forest plot | 7 | 6841 | Mean Difference (Random, 95% CI) | ‐0.02 [‐0.06, 0.02] |
| 1.1 Wider community | 2 | 481 | Mean Difference (Random, 95% CI) | ‐0.07 [‐0.19, 0.05] |
| 1.2 School | 5 | 6360 | Mean Difference (Random, 95% CI) | ‐0.03 [‐0.07, 0.00] |
| 2 zBMI. Physical activity vs control ‐ duration Show forest plot | 7 | 6841 | Mean Difference (Random, 95% CI) | ‐0.02 [‐0.06, 0.02] |
| 2.1 Duration of intervention ≤ 12 months | 2 | 995 | Mean Difference (Random, 95% CI) | 0.00 [‐0.09, 0.09] |
| 2.2 Duration of intervention > 12 months | 5 | 5846 | Mean Difference (Random, 95% CI) | ‐0.03 [‐0.08, 0.02] |
| 3 BMI. Physical activity vs control ‐ setting Show forest plot | 14 | 16410 | Mean Difference (Random, 95% CI) | ‐0.10 [‐0.14, ‐0.05] |
| 3.1 Wider community | 2 | 481 | Mean Difference (Random, 95% CI) | ‐0.19 [‐0.50, 0.12] |
| 3.2 School | 12 | 15929 | Mean Difference (Random, 95% CI) | ‐0.10 [‐0.14, ‐0.06] |
| 4 BMI. Physical activity vs control ‐ duration Show forest plot | 14 | 16410 | Mean Difference (Random, 95% CI) | ‐0.10 [‐0.14, ‐0.05] |
| 4.1 Duration of intervention ≤ 12 months | 11 | 13705 | Mean Difference (Random, 95% CI) | ‐0.11 [‐0.15, ‐0.06] |
| 4.2 Duration of intervention > 12 months | 3 | 2705 | Mean Difference (Random, 95% CI) | 0.00 [‐0.14, 0.14] |
| Outcome or subgroup title | No. of studies | No. of participants | Statistical method | Effect size |
| 1 zBMI. Diet and physical activity vs control ‐ setting Show forest plot | 20 | 24043 | Mean Difference (Random, 95% CI) | ‐0.05 [‐0.10, ‐0.01] |
| 1.1 Home | 1 | 134 | Mean Difference (Random, 95% CI) | 0.03 [‐0.04, 0.10] |
| 1.2 Wider community | 4 | 657 | Mean Difference (Random, 95% CI) | ‐0.04 [‐0.39, 0.31] |
| 1.3 School | 15 | 23252 | Mean Difference (Random, 95% CI) | ‐0.04 [‐0.08, ‐0.01] |
| 2 zBMI. Diet and physical activity vs control ‐ duration Show forest plot | 20 | 24043 | Mean Difference (Random, 95% CI) | ‐0.05 [‐0.10, ‐0.01] |
| 2.1 Duration of intervention > 12 months | 8 | 11779 | Mean Difference (Random, 95% CI) | ‐0.05 [‐0.10, 0.00] |
| 2.2 Duration of intervention ≤ 12 months | 12 | 12264 | Mean Difference (Random, 95% CI) | ‐0.06 [‐0.12, 0.01] |
| 3 BMI. Diet and physical activity vs control ‐ setting Show forest plot | 25 | 19498 | Mean Difference (Random, 95% CI) | ‐0.05 [‐0.11, 0.01] |
| 3.1 School | 16 | 18747 | Mean Difference (Random, 95% CI) | ‐0.04 [‐0.10, 0.02] |
| 3.2 Wider community | 9 | 751 | Mean Difference (Random, 95% CI) | ‐0.08 [‐0.29, 0.13] |
| 4 BMI. Diet and physical activity vs control ‐ duration Show forest plot | 25 | 19498 | Mean Difference (Random, 95% CI) | ‐0.05 [‐0.11, 0.01] |
| 4.1 Duration of intervention > 12 months | 8 | 5704 | Mean Difference (Random, 95% CI) | ‐0.08 [‐0.18, 0.03] |
| 4.2 Duration of intervention ≤ 12 months | 17 | 13794 | Mean Difference (Random, 95% CI) | ‐0.04 [‐0.11, 0.04] |
| Outcome or subgroup title | No. of studies | No. of participants | Statistical method | Effect size |
| 1 BMI ‐ setting Show forest plot | 2 | 294 | Mean Difference (Random, 95% CI) | ‐0.13 [‐0.50, 0.23] |
| 1.1 Home | 1 | 103 | Mean Difference (Random, 95% CI) | ‐0.14 [‐0.54, 0.26] |
| 1.2 School | 1 | 191 | Mean Difference (Random, 95% CI) | ‐0.1 [‐0.99, 0.79] |
| Outcome or subgroup title | No. of studies | No. of participants | Statistical method | Effect size |
| 1 zBMI ‐ setting Show forest plot | 1 | 100 | Mean Difference (Random, 95% CI) | ‐0.20 [‐0.30, ‐0.10] |
| 1.1 School | 1 | 100 | Mean Difference (Random, 95% CI) | ‐0.20 [‐0.30, ‐0.10] |
| 2 zBMI ‐ duration Show forest plot | 1 | 100 | Mean Difference (Random, 95% CI) | ‐0.20 [‐0.30, ‐0.10] |
| 2.1 Duration of intervention ≤ 12 months | 1 | 100 | Mean Difference (Random, 95% CI) | ‐0.20 [‐0.30, ‐0.10] |
| 3 BMI ‐ setting Show forest plot | 4 | 720 | Mean Difference (Random, 95% CI) | ‐1.53 [‐2.67, ‐0.39] |
| 3.1 School | 4 | 720 | Mean Difference (Random, 95% CI) | ‐1.53 [‐2.67, ‐0.39] |
| 4 BMI ‐ duration Show forest plot | 4 | 720 | Mean Difference (Random, 95% CI) | ‐1.53 [‐2.67, ‐0.39] |
| 4.1 Duration of intervention ≤ 12 months | 4 | 720 | Mean Difference (Random, 95% CI) | ‐1.53 [‐2.67, ‐0.39] |
| Outcome or subgroup title | No. of studies | No. of participants | Statistical method | Effect size |
| 1 zBMI ‐ setting Show forest plot | 6 | 16543 | Mean Difference (Random, 95% CI) | 0.01 [‐0.05, 0.07] |
| 1.1 Home | 1 | 75 | Mean Difference (Random, 95% CI) | 0.06 [‐0.13, 0.26] |
| 1.2 School | 5 | 16468 | Mean Difference (Random, 95% CI) | 0.00 [‐0.06, 0.06] |
| 2 zBMI ‐ duration Show forest plot | 6 | 16543 | Mean Difference (Random, 95% CI) | 0.01 [‐0.05, 0.07] |
| 2.1 Duration of intervention ≤ 12 months | 3 | 2525 | Mean Difference (Random, 95% CI) | ‐0.09 [‐0.18, 0.00] |
| 2.2 Duration of intervention > 12 months | 3 | 14018 | Mean Difference (Random, 95% CI) | 0.01 [‐0.02, 0.04] |
| 3 BMI ‐ setting Show forest plot | 8 | 16583 | Mean Difference (Random, 95% CI) | ‐0.02 [‐0.10, 0.05] |
| 3.1 School | 8 | 16583 | Mean Difference (Random, 95% CI) | ‐0.02 [‐0.10, 0.05] |
| 4 BMI ‐ duration Show forest plot | 8 | 16583 | Mean Difference (Random, 95% CI) | ‐0.02 [‐0.10, 0.05] |
| 4.1 Duration of intervention > 12 months | 2 | 12904 | Mean Difference (Random, 95% CI) | ‐0.04 [‐0.17, 0.09] |
| 4.2 Duration of intervention ≤ 12 months | 6 | 3679 | Mean Difference (Random, 95% CI) | ‐0.03 [‐0.11, 0.05] |
| Outcome or subgroup title | No. of studies | No. of participants | Statistical method | Effect size |
| 1 zBMI Show forest plot | 1 | 1205 | Mean Difference (Random, 95% CI) | ‐0.11 [‐0.62, 0.40] |
| 2 BMI Show forest plot | 2 | 4917 | Mean Difference (Random, 95% CI) | ‐0.03 [‐0.25, 0.20] |
| Outcome or subgroup title | No. of studies | No. of participants | Statistical method | Effect size |
| 1 zBMI Show forest plot | 1 | 3946 | Mean Difference (Random, 95% CI) | ‐0.16 [‐0.57, 0.25] |
| 2 BMI Show forest plot | 1 | 3946 | Mean Difference (Random, 95% CI) | ‐0.04 [‐1.05, 0.97] |
| Outcome or subgroup title | No. of studies | No. of participants | Statistical method | Effect size |
| 1 zBMI Show forest plot | 1 | 3971 | Mean Difference (Random, 95% CI) | 0.05 [‐0.38, 0.48] |
| 2 BMI Show forest plot | 1 | 3971 | Mean Difference (Random, 95% CI) | ‐0.28 [‐1.67, 1.11] |