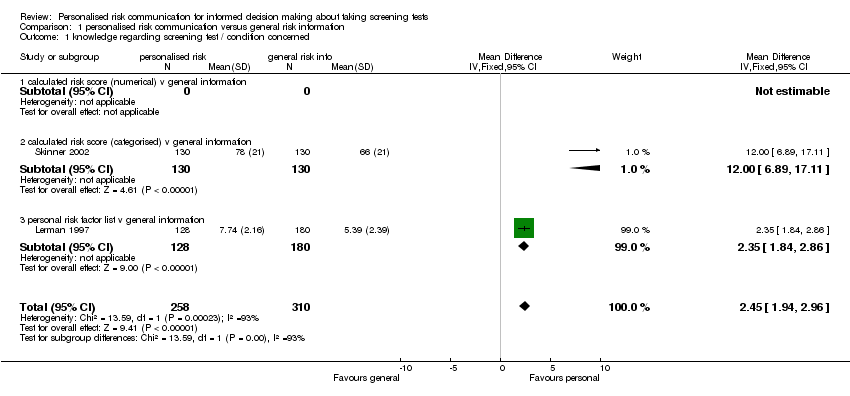
| 1 knowledge regarding screening test / condition concerned Show forest plot | 2 | 568 | Mean Difference (IV, Fixed, 95% CI) | 2.45 [1.94, 2.96] |
|
| 1.1 calculated risk score (numerical) v general information | 0 | 0 | Mean Difference (IV, Fixed, 95% CI) | 0.0 [0.0, 0.0] |
| 1.2 calculated risk score (categorised) v general information | 1 | 260 | Mean Difference (IV, Fixed, 95% CI) | 12.0 [6.89, 17.11] |
| 1.3 personal risk factor list v general information | 1 | 308 | Mean Difference (IV, Fixed, 95% CI) | 2.35 [1.84, 2.86] |
| 2 knowledge regarding screening test / condition concerned Show forest plot | 1 | 804 | Odds Ratio (M‐H, Fixed, 95% CI) | 1.44 [0.95, 2.19] |
|
| 2.1 calculated risk score (numerical) v general information | 1 | 804 | Odds Ratio (M‐H, Fixed, 95% CI) | 1.44 [0.95, 2.19] |
| 2.2 calculated risk score (categorised) v general information | 0 | 0 | Odds Ratio (M‐H, Fixed, 95% CI) | 0.0 [0.0, 0.0] |
| 2.3 personal risk factor list v general information | 0 | 0 | Odds Ratio (M‐H, Fixed, 95% CI) | 0.0 [0.0, 0.0] |
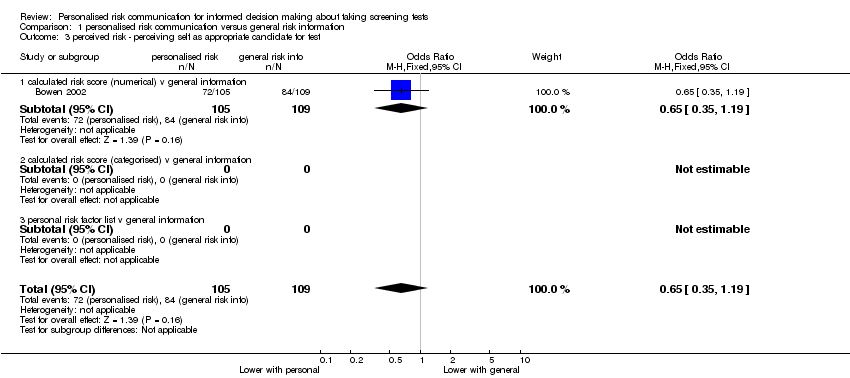
| 3 perceived risk ‐ perceiving self as appropriate candidate for test Show forest plot | 1 | 214 | Odds Ratio (M‐H, Fixed, 95% CI) | 0.65 [0.35, 1.19] |
|
| 3.1 calculated risk score (numerical) v general information | 1 | 214 | Odds Ratio (M‐H, Fixed, 95% CI) | 0.65 [0.35, 1.19] |
| 3.2 calculated risk score (categorised) v general information | 0 | 0 | Odds Ratio (M‐H, Fixed, 95% CI) | 0.0 [0.0, 0.0] |
| 3.3 personal risk factor list v general information | 0 | 0 | Odds Ratio (M‐H, Fixed, 95% CI) | 0.0 [0.0, 0.0] |
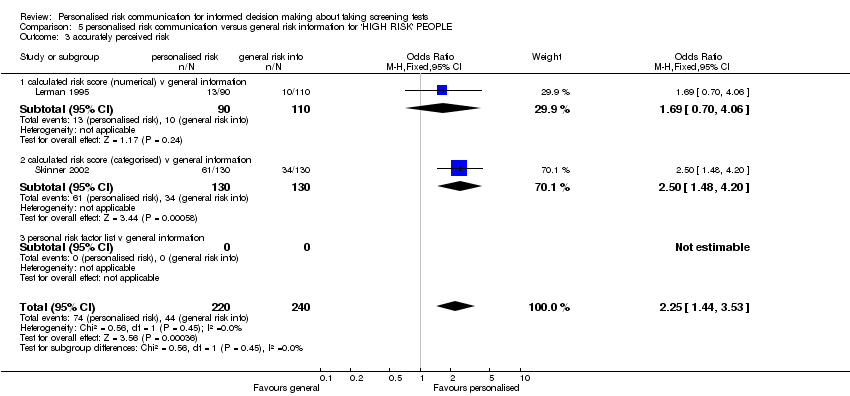
| 4 accurately perceived risk Show forest plot | 3 | 1264 | Odds Ratio (M‐H, Fixed, 95% CI) | 1.46 [1.13, 1.88] |
|
| 4.1 calculated risk score (numerical) v general information | 2 | 1004 | Odds Ratio (M‐H, Fixed, 95% CI) | 1.22 [0.91, 1.64] |
| 4.2 calculated risk score (categorised) v general information | 1 | 260 | Odds Ratio (M‐H, Fixed, 95% CI) | 2.50 [1.48, 4.20] |
| 4.3 personal risk factor list v general information | 0 | 0 | Odds Ratio (M‐H, Fixed, 95% CI) | 0.0 [0.0, 0.0] |
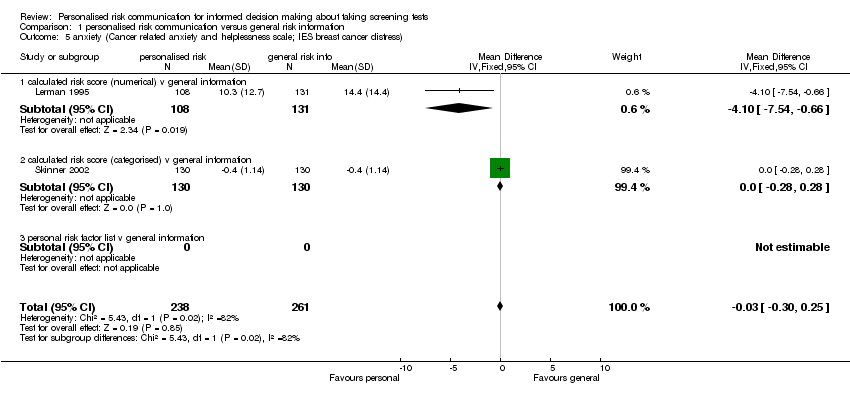
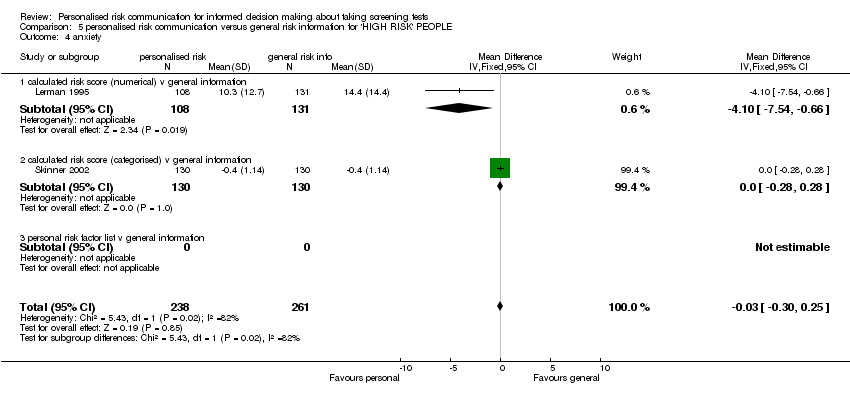
| 5 anxiety (Cancer related anxiety and helplessness scale; IES breast cancer distress) Show forest plot | 2 | 499 | Mean Difference (IV, Fixed, 95% CI) | ‐0.03 [‐0.30, 0.25] |
|
| 5.1 calculated risk score (numerical) v general information | 1 | 239 | Mean Difference (IV, Fixed, 95% CI) | ‐4.1 [‐7.54, ‐0.66] |
| 5.2 calculated risk score (categorised) v general information | 1 | 260 | Mean Difference (IV, Fixed, 95% CI) | 0.0 [‐0.28, 0.28] |
| 5.3 personal risk factor list v general information | 0 | 0 | Mean Difference (IV, Fixed, 95% CI) | 0.0 [0.0, 0.0] |
| 6 satisfaction with decision | 0 | 0 | Mean Difference (IV, Fixed, 95% CI) | 0.0 [0.0, 0.0] |
| 6.1 calculated risk score (numerical) v general information | 0 | 0 | Mean Difference (IV, Fixed, 95% CI) | 0.0 [0.0, 0.0] |
| 6.2 calculated risk score (categorised) v general information | 0 | 0 | Mean Difference (IV, Fixed, 95% CI) | 0.0 [0.0, 0.0] |
| 6.3 personal risk factor list v general information | 0 | 0 | Mean Difference (IV, Fixed, 95% CI) | 0.0 [0.0, 0.0] |
| 7 decision conflict | 0 | 0 | Mean Difference (IV, Fixed, 95% CI) | 0.0 [0.0, 0.0] |
| 7.1 calculated risk score (numerical) v general information | 0 | 0 | Mean Difference (IV, Fixed, 95% CI) | 0.0 [0.0, 0.0] |
| 7.2 calculated risk score (categorised) v general information | 0 | 0 | Mean Difference (IV, Fixed, 95% CI) | 0.0 [0.0, 0.0] |
| 7.3 personal risk factor list v general information | 0 | 0 | Mean Difference (IV, Fixed, 95% CI) | 0.0 [0.0, 0.0] |
| 8 intention to take screening test Show forest plot | 5 | 2016 | Odds Ratio (M‐H, Fixed, 95% CI) | 0.86 [0.71, 1.03] |
|
| 8.1 calculated risk score (numerical) v general information | 1 | 214 | Odds Ratio (M‐H, Fixed, 95% CI) | 1.10 [0.63, 1.94] |
| 8.2 calculated risk score (categorised) v general information | 2 | 538 | Odds Ratio (M‐H, Fixed, 95% CI) | 1.68 [1.12, 2.53] |
| 8.3 personal risk factor list v general information | 2 | 1264 | Odds Ratio (M‐H, Fixed, 95% CI) | 0.68 [0.54, 0.84] |
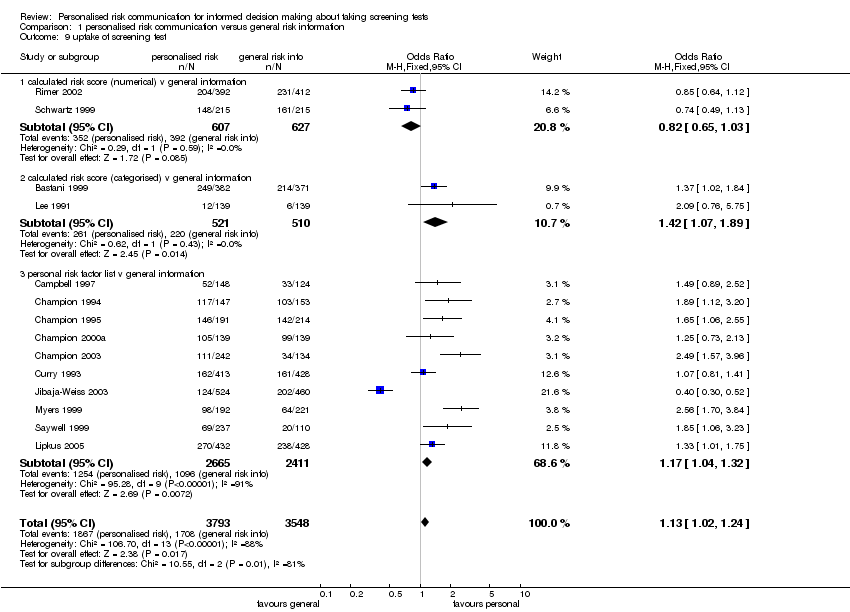
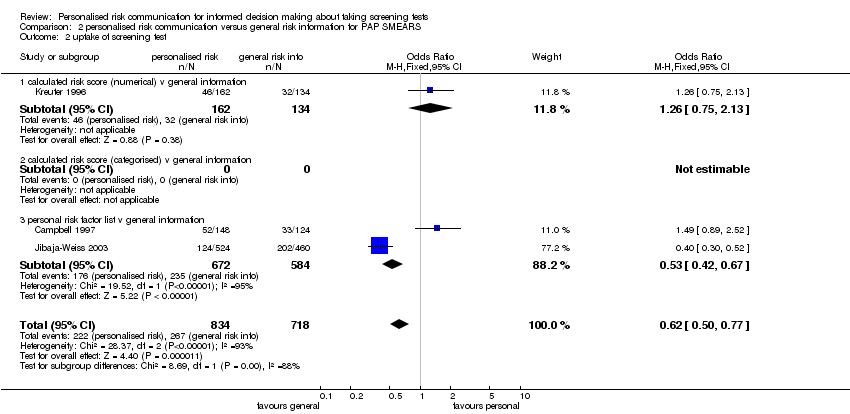
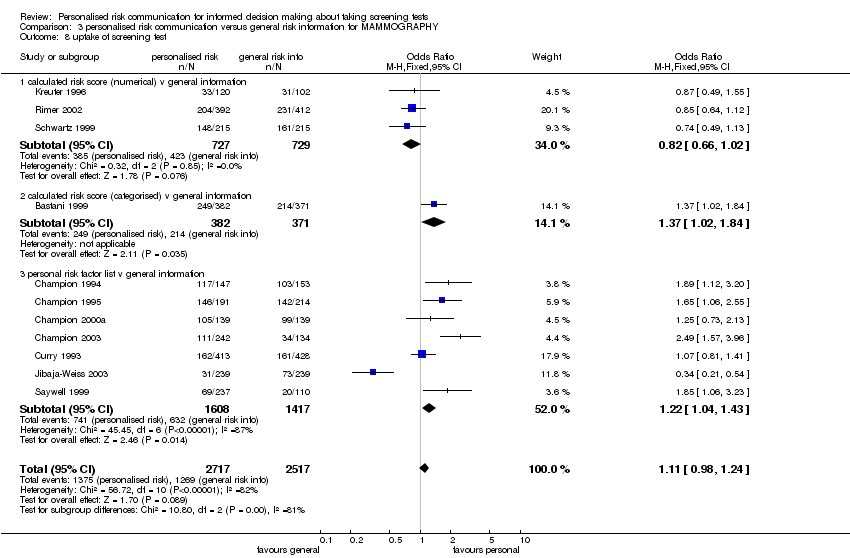
| 9 uptake of screening test Show forest plot | 14 | 7341 | Odds Ratio (M‐H, Fixed, 95% CI) | 1.13 [1.02, 1.24] |
|
| 9.1 calculated risk score (numerical) v general information | 2 | 1234 | Odds Ratio (M‐H, Fixed, 95% CI) | 0.82 [0.65, 1.03] |
| 9.2 calculated risk score (categorised) v general information | 2 | 1031 | Odds Ratio (M‐H, Fixed, 95% CI) | 1.42 [1.07, 1.89] |
| 9.3 personal risk factor list v general information | 10 | 5076 | Odds Ratio (M‐H, Fixed, 95% CI) | 1.17 [1.04, 1.32] |
| 10 appropriate use of cholesterol test Show forest plot | 1 | 3152 | Odds Ratio (M‐H, Fixed, 95% CI) | 1.32 [1.14, 1.55] |
|
| 10.1 calculated risk score (numerical) v general information | 0 | 0 | Odds Ratio (M‐H, Fixed, 95% CI) | 0.0 [0.0, 0.0] |
| 10.2 calculated risk score (categorised) v general information | 0 | 0 | Odds Ratio (M‐H, Fixed, 95% CI) | 0.0 [0.0, 0.0] |
| 10.3 personal risk factor list v general information | 1 | 3152 | Odds Ratio (M‐H, Fixed, 95% CI) | 1.32 [1.14, 1.55] |
| 11 smoking Show forest plot | 1 | 204 | Odds Ratio (M‐H, Fixed, 95% CI) | 1.04 [0.60, 1.82] |
|
| 11.1 calculated risk score (numerical) v general information | 1 | 204 | Odds Ratio (M‐H, Fixed, 95% CI) | 1.04 [0.60, 1.82] |
| 11.2 calculated risk score (categorised) v general information | 0 | 0 | Odds Ratio (M‐H, Fixed, 95% CI) | 0.0 [0.0, 0.0] |
| 11.3 personal risk factor list v general information | 0 | 0 | Odds Ratio (M‐H, Fixed, 95% CI) | 0.0 [0.0, 0.0] |
| 12 stages of change Show forest plot | | | Other data | No numeric data |
|
| 12.1 personal risk factor list v general information | | | Other data | No numeric data |
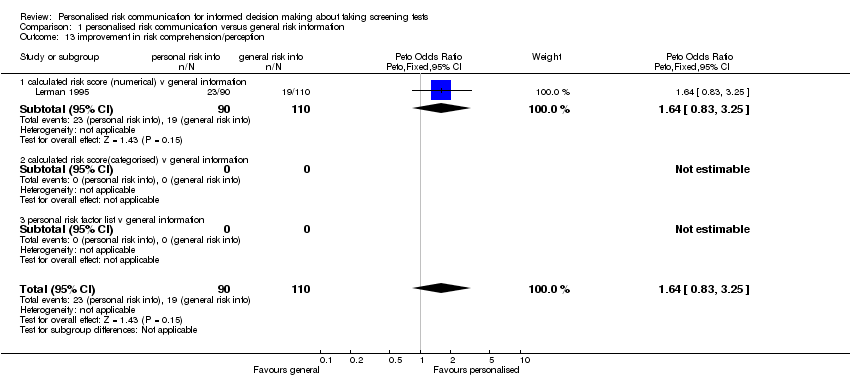
| 13 improvement in risk comprehension/perception Show forest plot | 1 | 200 | Peto Odds Ratio (Peto, Fixed, 95% CI) | 1.64 [0.83, 3.25] |
|
| 13.1 calculated risk score (numerical) v general information | 1 | 200 | Peto Odds Ratio (Peto, Fixed, 95% CI) | 1.64 [0.83, 3.25] |
| 13.2 calculated risk score(categorised) v general information | 0 | 0 | Peto Odds Ratio (Peto, Fixed, 95% CI) | 0.0 [0.0, 0.0] |
| 13.3 personal risk factor list v general information | 0 | 0 | Peto Odds Ratio (Peto, Fixed, 95% CI) | 0.0 [0.0, 0.0] |
| 14 making a recommended behaviour change Show forest plot | 1 | 890 | Odds Ratio (M‐H, Fixed, 95% CI) | 0.98 [0.76, 1.28] |
|
| 14.1 personal risk factor list v general information | 1 | 890 | Odds Ratio (M‐H, Fixed, 95% CI) | 0.98 [0.76, 1.28] |
| 14.2 calculated risk score(categorised) v general information | 0 | 0 | Odds Ratio (M‐H, Fixed, 95% CI) | 0.0 [0.0, 0.0] |
| 14.3 personal risk factor list v general information | 0 | 0 | Odds Ratio (M‐H, Fixed, 95% CI) | 0.0 [0.0, 0.0] |