Personalised risk communication for informed decision making about taking screening tests
Referencias
References to studies included in this review
References to studies excluded from this review
Additional references
References to other published versions of this review
Characteristics of studies
Characteristics of included studies [ordered by study ID]
Ir a:
| Methods | RCT | |
| Participants | Women over 30; breast cancer in first degree relative; resident in USA or Canada. | |
| Interventions | Mailed personalised risk assessment notification and other theoretically driven | |
| Outcomes | Uptake of mammography one year after baseline survey. | |
| Notes | ||
| Risk of bias | ||
| Bias | Authors' judgement | Support for judgement |
| Allocation concealment (selection bias) | Unclear risk | B ‐ Unclear |
| Methods | RCT | |
| Participants | Women with first degree relative with breast cancer; Seattle, USA. | |
| Interventions | Individual or group‐based genetic counselling, including Gail and Claus scores. | |
| Outcomes | Interest in having BRCA tests; perception of self as appropriate candidate for tests. | |
| Notes | ||
| Risk of bias | ||
| Bias | Authors' judgement | Support for judgement |
| Allocation concealment (selection bias) | Unclear risk | B ‐ Unclear |
| Methods | RCT | |
| Participants | Women who had not had a cervical (Pap) smear in previous 30 months; New South Wales, Australia. | |
| Interventions | Computer generated printed feedback, listing 'risk factor' of not having a smear within past 2 years. | |
| Outcomes | Uptake of cervical (Pap) smear. | |
| Notes | ||
| Risk of bias | ||
| Bias | Authors' judgement | Support for judgement |
| Allocation concealment (selection bias) | Unclear risk | B ‐ Unclear |
| Methods | RCT | |
| Participants | Women aged >= 35 ; never having had breast cancer. USA. | |
| Interventions | In‐home interviews conducted by graduate nursing research assistants. Discussion about individual risk factors ‐ susceptibility intervention‐ as part of a belief modifying intervention. | |
| Outcomes | Change in beliefs and knowledge (including susceptibility scores) post‐intervention; mammography compliance 1 year post‐intervention. | |
| Notes | ||
| Risk of bias | ||
| Bias | Authors' judgement | Support for judgement |
| Allocation concealment (selection bias) | Unclear risk | B ‐ Unclear |
| Methods | RCT | |
| Participants | Women aged >=35; not diagnosed with breast cancer. | |
| Interventions | In‐home interviews conducted by graduate nursing students.Discussion about individual risk factors ‐ susceptibility intervention ‐ as part of a belief modifying intervention. | |
| Outcomes | Change in beliefs and knowledge (including susceptibility (scores); mammography compliance; movement across stages of change. | |
| Notes | ||
| Risk of bias | ||
| Bias | Authors' judgement | Support for judgement |
| Allocation concealment (selection bias) | Unclear risk | B ‐ Unclear |
| Methods | RCT | |
| Participants | Low‐income African American women aged 45‐64; Indiana, USA. | |
| Interventions | In‐person tailored interventions based on Health Belief and Transtheoretical Models, including listing of susceptibility factors. | |
| Outcomes | Screening mammography uptake at 12 months. | |
| Notes | ||
| Risk of bias | ||
| Bias | Authors' judgement | Support for judgement |
| Allocation concealment (selection bias) | Unclear risk | B ‐ Unclear |
| Methods | RCT | |
| Participants | Women aged over 50 not adherent to mammography recommendations; medical clinic at St Louis and HMO in Indianapolis, USA. | |
| Interventions | Tailored interventions based on Health Belief and Transtheoretical Models, including perceived risk and risk factors (eg. age, family history). | |
| Outcomes | Self‐reported mammography uptake at 2 months. | |
| Notes | ||
| Risk of bias | ||
| Bias | Authors' judgement | Support for judgement |
| Allocation concealment (selection bias) | Unclear risk | B ‐ Unclear |
| Methods | RCT | |
| Participants | Women in the 51‐84 years age range who have not received a mammogram in the last 15 months; from an HMO and general medicine clinic, USA. | |
| Interventions | Tailored interventions based on Health Belief and Transtheoretical Models, including listing of susceptibility factors. | |
| Outcomes | Screening mammography uptake at 6 months. | |
| Notes | ||
| Risk of bias | ||
| Bias | Authors' judgement | Support for judgement |
| Allocation concealment (selection bias) | Low risk | A ‐ Adequate |
| Methods | RCT | |
| Participants | Women aged >= 50; newly enrolled in an HMO, without prior history of breast cancer or of mammography use in the previous 12 months. USA, | |
| Interventions | Mailed risk factor questionnaire plus personal risk invitation detailing personal risk factors. | |
| Outcomes | Mammography use within 1 year of invitation. | |
| Notes | ||
| Risk of bias | ||
| Bias | Authors' judgement | Support for judgement |
| Allocation concealment (selection bias) | Unclear risk | B ‐ Unclear |
| Methods | RCT | |
| Participants | Patients aged 20‐69 years, from 2 Canadian primary care group practices. | |
| Interventions | Risk appraisal questionnaire (yielding risk score). Those with scores above 2 advised to go for screening. | |
| Outcomes | Rate of cholesterol testing during the three months of follow up. | |
| Notes | ||
| Risk of bias | ||
| Bias | Authors' judgement | Support for judgement |
| Allocation concealment (selection bias) | Unclear risk | B ‐ Unclear |
| Methods | RCT | |
| Participants | Women registered at 2 urban community health centres; Houston, USA. | |
| Interventions | Personalised letter, tailored for risk factor data and giving screening recommendations. | |
| Outcomes | Scheduling and uptake of cervical (Pap) smear test and mammogram. | |
| Notes | ||
| Risk of bias | ||
| Bias | Authors' judgement | Support for judgement |
| Allocation concealment (selection bias) | Low risk | A ‐ Adequate |
| Methods | RCT | |
| Participants | Patients aged 18‐75 from 8 family medical practices, N. Carolina, USA. | |
| Interventions | Mailed HRA (Health Risk Appraisal) ‐ risk information tailored to information given at baseline questionnaire. | |
| Outcomes | Rate of pap smear, mammography and cholesterol uptake after 6 months in those contemplating these behaviours at baseline. | |
| Notes | ||
| Risk of bias | ||
| Bias | Authors' judgement | Support for judgement |
| Allocation concealment (selection bias) | High risk | C ‐ Inadequate |
| Methods | RCT, stratified for previous screening history and risk status. | |
| Participants | Federal employees aged >= 40 years. USA. | |
| Interventions | Colorectal cancer risk appraisal ‐ categorised as high medium or low personal risk. | |
| Outcomes | Knowledge, intention to take test, and uptake. | |
| Notes | ||
| Risk of bias | ||
| Bias | Authors' judgement | Support for judgement |
| Allocation concealment (selection bias) | Unclear risk | B ‐ Unclear |
| Methods | RCT | |
| Participants | Women aged 35 years and older with a family history of breast cancer in a first degree relative. USA. | |
| Interventions | Breast cancer risk counselling including discussion of factors contributing to elevated risk and presentation of individualized risk data. | |
| Outcomes | Changes/improvement in risk comprehension. | |
| Notes | Additional paper (Lerman et al, 1996) addresses effects on general and breast cancer‐specific distress. | |
| Risk of bias | ||
| Bias | Authors' judgement | Support for judgement |
| Allocation concealment (selection bias) | Unclear risk | B ‐ Unclear |
| Methods | RCT | |
| Participants | Women aged 18‐75 who had at least one first degree relative with breast and/or ovarian cancer. USA. | |
| Interventions | Educational session including a review of individual risk factors for breast and ovarian cancers. | |
| Outcomes | Changes in risk perception; testing intentions. | |
| Notes | No data on taking test in control group. | |
| Risk of bias | ||
| Bias | Authors' judgement | Support for judgement |
| Allocation concealment (selection bias) | Unclear risk | B ‐ Unclear |
| Methods | RCT (2 x 2 factorial with basic versus more comprehensive information as well as personalised (tailored) versus non‐personalised. | |
| Participants | 99% male, New Jersey Carpenters Fund members; aged over 50 years. | |
| Interventions | Tailored risk information with information about risk factors for colorectal cancer derived from baseline questionnaire. | |
| Outcomes | Faecal Occult Blood test uptake at 1, 2 and 3 years. | |
| Notes | Also assessed 'attributions of colorectal cancer risk' but not as risk perceptions directly affected by interventions. | |
| Risk of bias | ||
| Bias | Authors' judgement | Support for judgement |
| Allocation concealment (selection bias) | Unclear risk | B ‐ Unclear |
| Methods | RCT | |
| Participants | African American men, aged 40‐70 years. Patients at the University of Chicago, USA. | |
| Interventions | A personalised 'ProRecord' which included a tailored risk factors and symptoms form. | |
| Outcomes | 'Adherence', ie. men who made an office visit for prostate cancer education and early detection within a year. | |
| Notes | ||
| Risk of bias | ||
| Bias | Authors' judgement | Support for judgement |
| Allocation concealment (selection bias) | Unclear risk | B ‐ Unclear |
| Methods | RCT | |
| Participants | Women in their 40s and 50s , and members of Blue Cross and Blue Shield, N. Carolina, USA. | |
| Interventions | Tailored print materials detailing a woman's personal risk (numerical and graphical) of breast cancer based on Gail score. | |
| Outcomes | Knowledge, accuracy of risk perceptions; mammography uptake. | |
| Notes | Tailored print + telephone counselling arm excluded as different and extra content. | |
| Risk of bias | ||
| Bias | Authors' judgement | Support for judgement |
| Allocation concealment (selection bias) | Unclear risk | B ‐ Unclear |
| Methods | RCT | |
| Participants | Women 50‐85 years; non‐compliant with mammography guidelines; no history of breast cancer. USA, | |
| Interventions | Telephone and in‐person counselling including discussion of personal risk factors. | |
| Outcomes | Mammography compliance 4‐6 weeks after counselling. | |
| Notes | ||
| Risk of bias | ||
| Bias | Authors' judgement | Support for judgement |
| Allocation concealment (selection bias) | Unclear risk | B ‐ Unclear |
| Methods | RCT | |
| Participants | Women with family history of breast cancer (first degree relative of sufferer) aged 40 years and older. USA. | |
| Interventions | Risk counselling including individualised risk figures. | |
| Outcomes | Self reported mammography use 1 year after (compared to baseline). | |
| Notes | This is a follow‐up to the Lerman et al, 1995 trial. | |
| Risk of bias | ||
| Bias | Authors' judgement | Support for judgement |
| Allocation concealment (selection bias) | Unclear risk | B ‐ Unclear |
| Methods | RCT, stratified between clinics. | |
| Participants | Female family practice attenders aged 40‐65 years. USA. | |
| Interventions | Tailored text about beliefs, mammography stages, risk factors and barriers. | |
| Outcomes | Mammography stage and uptake. | |
| Notes | ||
| Risk of bias | ||
| Bias | Authors' judgement | Support for judgement |
| Allocation concealment (selection bias) | Unclear risk | B ‐ Unclear |
| Methods | RCT | |
| Participants | Women with personal and family history of breast and/or ovarian cancer; N. Carolina, USA. | |
| Interventions | Tailored print materials about cancer, risk factors, genes and genetic testing and risk quartile in verbal or verbal and numerical format according to woman's preference. | |
| Outcomes | Knowledge, anxiety, accuracy of perceived risk and intention to take genetic test. | |
| Notes | ||
| Risk of bias | ||
| Bias | Authors' judgement | Support for judgement |
| Allocation concealment (selection bias) | Unclear risk | B ‐ Unclear |
RCT = randomised controlled trial.
Characteristics of excluded studies [ordered by study ID]
Ir a:
| Study | Reason for exclusion |
| A one group pre‐test and post‐test design. No control group. | |
| Not personalised risk elements despite some attention to susceptibility; personalisation is for transtheoretical stage. | |
| Individualised counselling based on each woman's barriers to obtaining cervical screening, but not estimating her personal level of risk or risk factors. | |
| Intervention for follow‐up of abnormal Pap smears, not screening. | |
| Intervention involved counselling in which an estimate of a woman's risk of developing breast cancer was given, but no control group present; and main behavioural outcome was not mammography but breast self‐examination. | |
| Personalised risks given, but no control group for this pre‐post study. | |
| No control group. | |
| Tailoring for beliefs and cultural adaptation but not of risk information itself. | |
| A longitudinal study, with risk calculated after cardiovascular screening. | |
| Tailored print and counselling, but no clear evidence that personalised risk information was given. | |
| Patient initiated call for information, consideration of testing; not screening. | |
| Identified from the Jepson review as being a 'risk factor assessment study'; but questionnaire assessed symptoms and not risk factors as such. | |
| Stage (of change) matched intervention but not explicitly dealing with individually calculated risk estimates. | |
| Personal health recommendations but not risk communication in screening. Process measures and no outcomes. | |
| A tailored intervention, but not with regards to personal risks. | |
| Structured outreach, with identification and removal of barriers to care, but not estimating her personal level of risk or risk factors. |
Data and analyses
| Outcome or subgroup title | No. of studies | No. of participants | Statistical method | Effect size | ||||||||
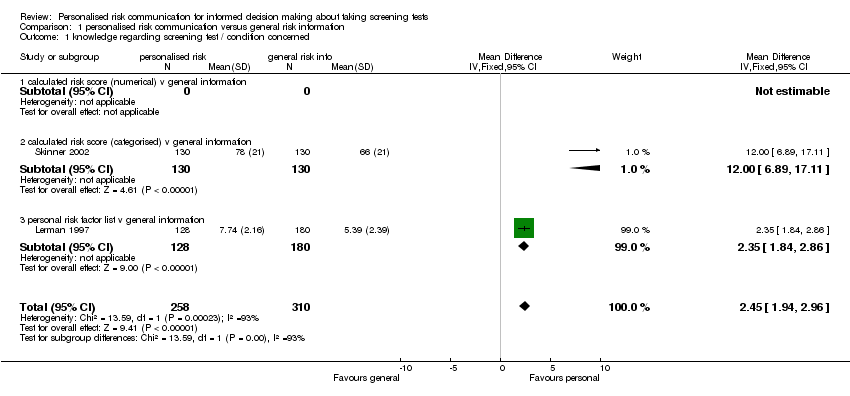
| 1 knowledge regarding screening test / condition concerned Show forest plot | 2 | 568 | Mean Difference (IV, Fixed, 95% CI) | 2.45 [1.94, 2.96] | ||||||||
| Analysis 1.1  Comparison 1 personalised risk communication versus general risk information, Outcome 1 knowledge regarding screening test / condition concerned. | ||||||||||||
| 1.1 calculated risk score (numerical) v general information | 0 | 0 | Mean Difference (IV, Fixed, 95% CI) | 0.0 [0.0, 0.0] | ||||||||
| 1.2 calculated risk score (categorised) v general information | 1 | 260 | Mean Difference (IV, Fixed, 95% CI) | 12.0 [6.89, 17.11] | ||||||||
| 1.3 personal risk factor list v general information | 1 | 308 | Mean Difference (IV, Fixed, 95% CI) | 2.35 [1.84, 2.86] | ||||||||
| 2 knowledge regarding screening test / condition concerned Show forest plot | 1 | 804 | Odds Ratio (M‐H, Fixed, 95% CI) | 1.44 [0.95, 2.19] | ||||||||
| Analysis 1.2  Comparison 1 personalised risk communication versus general risk information, Outcome 2 knowledge regarding screening test / condition concerned. | ||||||||||||
| 2.1 calculated risk score (numerical) v general information | 1 | 804 | Odds Ratio (M‐H, Fixed, 95% CI) | 1.44 [0.95, 2.19] | ||||||||
| 2.2 calculated risk score (categorised) v general information | 0 | 0 | Odds Ratio (M‐H, Fixed, 95% CI) | 0.0 [0.0, 0.0] | ||||||||
| 2.3 personal risk factor list v general information | 0 | 0 | Odds Ratio (M‐H, Fixed, 95% CI) | 0.0 [0.0, 0.0] | ||||||||
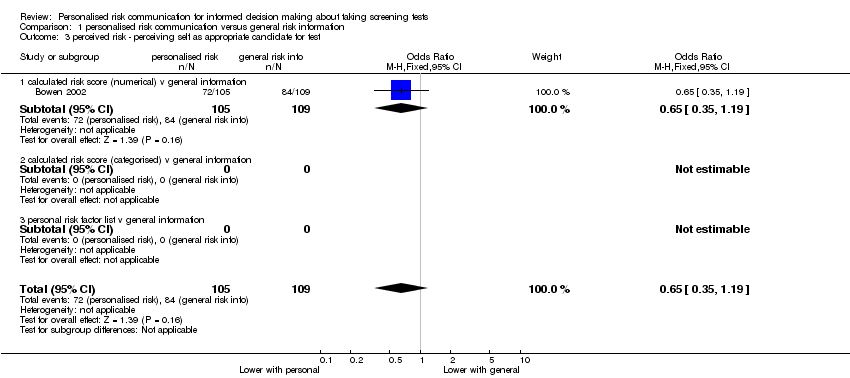
| 3 perceived risk ‐ perceiving self as appropriate candidate for test Show forest plot | 1 | 214 | Odds Ratio (M‐H, Fixed, 95% CI) | 0.65 [0.35, 1.19] | ||||||||
| Analysis 1.3  Comparison 1 personalised risk communication versus general risk information, Outcome 3 perceived risk ‐ perceiving self as appropriate candidate for test. | ||||||||||||
| 3.1 calculated risk score (numerical) v general information | 1 | 214 | Odds Ratio (M‐H, Fixed, 95% CI) | 0.65 [0.35, 1.19] | ||||||||
| 3.2 calculated risk score (categorised) v general information | 0 | 0 | Odds Ratio (M‐H, Fixed, 95% CI) | 0.0 [0.0, 0.0] | ||||||||
| 3.3 personal risk factor list v general information | 0 | 0 | Odds Ratio (M‐H, Fixed, 95% CI) | 0.0 [0.0, 0.0] | ||||||||
| 4 accurately perceived risk Show forest plot | 3 | 1264 | Odds Ratio (M‐H, Fixed, 95% CI) | 1.46 [1.13, 1.88] | ||||||||
| Analysis 1.4  Comparison 1 personalised risk communication versus general risk information, Outcome 4 accurately perceived risk. | ||||||||||||
| 4.1 calculated risk score (numerical) v general information | 2 | 1004 | Odds Ratio (M‐H, Fixed, 95% CI) | 1.22 [0.91, 1.64] | ||||||||
| 4.2 calculated risk score (categorised) v general information | 1 | 260 | Odds Ratio (M‐H, Fixed, 95% CI) | 2.50 [1.48, 4.20] | ||||||||
| 4.3 personal risk factor list v general information | 0 | 0 | Odds Ratio (M‐H, Fixed, 95% CI) | 0.0 [0.0, 0.0] | ||||||||
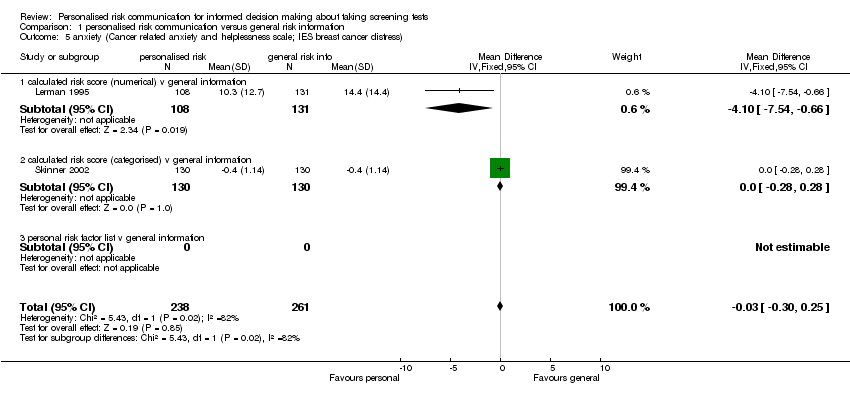
| 5 anxiety (Cancer related anxiety and helplessness scale; IES breast cancer distress) Show forest plot | 2 | 499 | Mean Difference (IV, Fixed, 95% CI) | ‐0.03 [‐0.30, 0.25] | ||||||||
| Analysis 1.5  Comparison 1 personalised risk communication versus general risk information, Outcome 5 anxiety (Cancer related anxiety and helplessness scale; IES breast cancer distress). | ||||||||||||
| 5.1 calculated risk score (numerical) v general information | 1 | 239 | Mean Difference (IV, Fixed, 95% CI) | ‐4.1 [‐7.54, ‐0.66] | ||||||||
| 5.2 calculated risk score (categorised) v general information | 1 | 260 | Mean Difference (IV, Fixed, 95% CI) | 0.0 [‐0.28, 0.28] | ||||||||
| 5.3 personal risk factor list v general information | 0 | 0 | Mean Difference (IV, Fixed, 95% CI) | 0.0 [0.0, 0.0] | ||||||||
| 6 satisfaction with decision | 0 | 0 | Mean Difference (IV, Fixed, 95% CI) | 0.0 [0.0, 0.0] | ||||||||
| 6.1 calculated risk score (numerical) v general information | 0 | 0 | Mean Difference (IV, Fixed, 95% CI) | 0.0 [0.0, 0.0] | ||||||||
| 6.2 calculated risk score (categorised) v general information | 0 | 0 | Mean Difference (IV, Fixed, 95% CI) | 0.0 [0.0, 0.0] | ||||||||
| 6.3 personal risk factor list v general information | 0 | 0 | Mean Difference (IV, Fixed, 95% CI) | 0.0 [0.0, 0.0] | ||||||||
| 7 decision conflict | 0 | 0 | Mean Difference (IV, Fixed, 95% CI) | 0.0 [0.0, 0.0] | ||||||||
| 7.1 calculated risk score (numerical) v general information | 0 | 0 | Mean Difference (IV, Fixed, 95% CI) | 0.0 [0.0, 0.0] | ||||||||
| 7.2 calculated risk score (categorised) v general information | 0 | 0 | Mean Difference (IV, Fixed, 95% CI) | 0.0 [0.0, 0.0] | ||||||||
| 7.3 personal risk factor list v general information | 0 | 0 | Mean Difference (IV, Fixed, 95% CI) | 0.0 [0.0, 0.0] | ||||||||
| 8 intention to take screening test Show forest plot | 5 | 2016 | Odds Ratio (M‐H, Fixed, 95% CI) | 0.86 [0.71, 1.03] | ||||||||
| Analysis 1.8  Comparison 1 personalised risk communication versus general risk information, Outcome 8 intention to take screening test. | ||||||||||||
| 8.1 calculated risk score (numerical) v general information | 1 | 214 | Odds Ratio (M‐H, Fixed, 95% CI) | 1.10 [0.63, 1.94] | ||||||||
| 8.2 calculated risk score (categorised) v general information | 2 | 538 | Odds Ratio (M‐H, Fixed, 95% CI) | 1.68 [1.12, 2.53] | ||||||||
| 8.3 personal risk factor list v general information | 2 | 1264 | Odds Ratio (M‐H, Fixed, 95% CI) | 0.68 [0.54, 0.84] | ||||||||
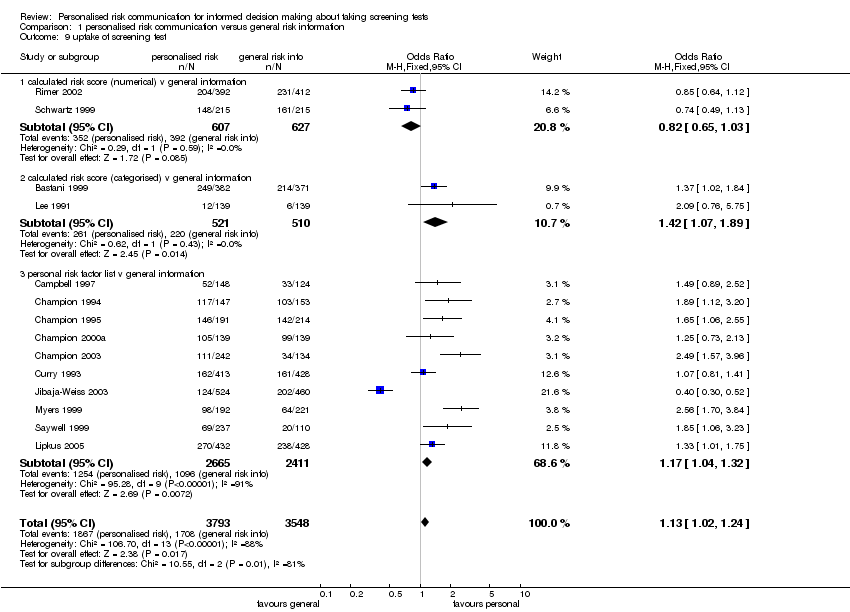
| 9 uptake of screening test Show forest plot | 14 | 7341 | Odds Ratio (M‐H, Fixed, 95% CI) | 1.13 [1.02, 1.24] | ||||||||
| Analysis 1.9  Comparison 1 personalised risk communication versus general risk information, Outcome 9 uptake of screening test. | ||||||||||||
| 9.1 calculated risk score (numerical) v general information | 2 | 1234 | Odds Ratio (M‐H, Fixed, 95% CI) | 0.82 [0.65, 1.03] | ||||||||
| 9.2 calculated risk score (categorised) v general information | 2 | 1031 | Odds Ratio (M‐H, Fixed, 95% CI) | 1.42 [1.07, 1.89] | ||||||||
| 9.3 personal risk factor list v general information | 10 | 5076 | Odds Ratio (M‐H, Fixed, 95% CI) | 1.17 [1.04, 1.32] | ||||||||
| 10 appropriate use of cholesterol test Show forest plot | 1 | 3152 | Odds Ratio (M‐H, Fixed, 95% CI) | 1.32 [1.14, 1.55] | ||||||||
| Analysis 1.10  Comparison 1 personalised risk communication versus general risk information, Outcome 10 appropriate use of cholesterol test. | ||||||||||||
| 10.1 calculated risk score (numerical) v general information | 0 | 0 | Odds Ratio (M‐H, Fixed, 95% CI) | 0.0 [0.0, 0.0] | ||||||||
| 10.2 calculated risk score (categorised) v general information | 0 | 0 | Odds Ratio (M‐H, Fixed, 95% CI) | 0.0 [0.0, 0.0] | ||||||||
| 10.3 personal risk factor list v general information | 1 | 3152 | Odds Ratio (M‐H, Fixed, 95% CI) | 1.32 [1.14, 1.55] | ||||||||
| 11 smoking Show forest plot | 1 | 204 | Odds Ratio (M‐H, Fixed, 95% CI) | 1.04 [0.60, 1.82] | ||||||||
| Analysis 1.11  Comparison 1 personalised risk communication versus general risk information, Outcome 11 smoking. | ||||||||||||
| 11.1 calculated risk score (numerical) v general information | 1 | 204 | Odds Ratio (M‐H, Fixed, 95% CI) | 1.04 [0.60, 1.82] | ||||||||
| 11.2 calculated risk score (categorised) v general information | 0 | 0 | Odds Ratio (M‐H, Fixed, 95% CI) | 0.0 [0.0, 0.0] | ||||||||
| 11.3 personal risk factor list v general information | 0 | 0 | Odds Ratio (M‐H, Fixed, 95% CI) | 0.0 [0.0, 0.0] | ||||||||
| 12 stages of change Show forest plot | Other data | No numeric data | ||||||||||
| Analysis 1.12
Comparison 1 personalised risk communication versus general risk information, Outcome 12 stages of change. | ||||||||||||
| 12.1 personal risk factor list v general information | Other data | No numeric data | ||||||||||
| 13 improvement in risk comprehension/perception Show forest plot | 1 | 200 | Peto Odds Ratio (Peto, Fixed, 95% CI) | 1.64 [0.83, 3.25] | ||||||||
| Analysis 1.13  Comparison 1 personalised risk communication versus general risk information, Outcome 13 improvement in risk comprehension/perception. | ||||||||||||
| 13.1 calculated risk score (numerical) v general information | 1 | 200 | Peto Odds Ratio (Peto, Fixed, 95% CI) | 1.64 [0.83, 3.25] | ||||||||
| 13.2 calculated risk score(categorised) v general information | 0 | 0 | Peto Odds Ratio (Peto, Fixed, 95% CI) | 0.0 [0.0, 0.0] | ||||||||
| 13.3 personal risk factor list v general information | 0 | 0 | Peto Odds Ratio (Peto, Fixed, 95% CI) | 0.0 [0.0, 0.0] | ||||||||
| 14 making a recommended behaviour change Show forest plot | 1 | 890 | Odds Ratio (M‐H, Fixed, 95% CI) | 0.98 [0.76, 1.28] | ||||||||
| Analysis 1.14  Comparison 1 personalised risk communication versus general risk information, Outcome 14 making a recommended behaviour change. | ||||||||||||
| 14.1 personal risk factor list v general information | 1 | 890 | Odds Ratio (M‐H, Fixed, 95% CI) | 0.98 [0.76, 1.28] | ||||||||
| 14.2 calculated risk score(categorised) v general information | 0 | 0 | Odds Ratio (M‐H, Fixed, 95% CI) | 0.0 [0.0, 0.0] | ||||||||
| 14.3 personal risk factor list v general information | 0 | 0 | Odds Ratio (M‐H, Fixed, 95% CI) | 0.0 [0.0, 0.0] | ||||||||
| Outcome or subgroup title | No. of studies | No. of participants | Statistical method | Effect size |
| 1 intention to take screening test Show forest plot | 1 | 984 | Odds Ratio (M‐H, Fixed, 95% CI) | 0.58 [0.45, 0.74] |
| Analysis 2.1  Comparison 2 personalised risk communication versus general risk information for PAP SMEARS, Outcome 1 intention to take screening test. | ||||
| 1.1 calculated risk score (numerical) v general information | 0 | 0 | Odds Ratio (M‐H, Fixed, 95% CI) | 0.0 [0.0, 0.0] |
| 1.2 calculated risk score (categorised) v general information | 0 | 0 | Odds Ratio (M‐H, Fixed, 95% CI) | 0.0 [0.0, 0.0] |
| 1.3 personal risk factor list v general information | 1 | 984 | Odds Ratio (M‐H, Fixed, 95% CI) | 0.58 [0.45, 0.74] |
| 2 uptake of screening test Show forest plot | 3 | 1552 | Odds Ratio (M‐H, Fixed, 95% CI) | 0.62 [0.50, 0.77] |
| Analysis 2.2  Comparison 2 personalised risk communication versus general risk information for PAP SMEARS, Outcome 2 uptake of screening test. | ||||
| 2.1 calculated risk score (numerical) v general information | 1 | 296 | Odds Ratio (M‐H, Fixed, 95% CI) | 1.26 [0.75, 2.13] |
| 2.2 calculated risk score (categorised) v general information | 0 | 0 | Odds Ratio (M‐H, Fixed, 95% CI) | 0.0 [0.0, 0.0] |
| 2.3 personal risk factor list v general information | 2 | 1256 | Odds Ratio (M‐H, Fixed, 95% CI) | 0.53 [0.42, 0.67] |
| Outcome or subgroup title | No. of studies | No. of participants | Statistical method | Effect size | ||||||||
| 1 knowledge regarding screening test / condition concerned | 0 | 0 | Mean Difference (IV, Fixed, 95% CI) | 0.0 [0.0, 0.0] | ||||||||
| 1.1 calculated risk score (numerical) v general information | 0 | 0 | Mean Difference (IV, Fixed, 95% CI) | 0.0 [0.0, 0.0] | ||||||||
| 1.2 calculated risk score (categorised) v general information | 0 | 0 | Mean Difference (IV, Fixed, 95% CI) | 0.0 [0.0, 0.0] | ||||||||
| 1.3 personal risk factor list v general information | 0 | 0 | Mean Difference (IV, Fixed, 95% CI) | 0.0 [0.0, 0.0] | ||||||||
| 2 knowledge regarding screening test / condition concerned Show forest plot | 1 | 804 | Odds Ratio (M‐H, Fixed, 95% CI) | 1.44 [0.95, 2.19] | ||||||||
| Analysis 3.2  Comparison 3 personalised risk communication versus general risk information for MAMMOGRAPHY, Outcome 2 knowledge regarding screening test / condition concerned. | ||||||||||||
| 2.1 calculated risk score (numerical) v general information | 1 | 804 | Odds Ratio (M‐H, Fixed, 95% CI) | 1.44 [0.95, 2.19] | ||||||||
| 2.2 calculated risk score (categorised) v general information | 0 | 0 | Odds Ratio (M‐H, Fixed, 95% CI) | 0.0 [0.0, 0.0] | ||||||||
| 2.3 personal risk factor list v general information | 0 | 0 | Odds Ratio (M‐H, Fixed, 95% CI) | 0.0 [0.0, 0.0] | ||||||||
| 3 accuracy of perceived risk Show forest plot | 1 | 804 | Odds Ratio (M‐H, Fixed, 95% CI) | 1.17 [0.86, 1.60] | ||||||||
| Analysis 3.3  Comparison 3 personalised risk communication versus general risk information for MAMMOGRAPHY, Outcome 3 accuracy of perceived risk. | ||||||||||||
| 3.1 calculated risk score (numerical) v general information | 1 | 804 | Odds Ratio (M‐H, Fixed, 95% CI) | 1.17 [0.86, 1.60] | ||||||||
| 3.2 calculated risk score (categorised) v general information | 0 | 0 | Odds Ratio (M‐H, Fixed, 95% CI) | 0.0 [0.0, 0.0] | ||||||||
| 3.3 personal risk factor list v general information | 0 | 0 | Odds Ratio (M‐H, Fixed, 95% CI) | 0.0 [0.0, 0.0] | ||||||||
| 4 decision conflict | 0 | 0 | Mean Difference (IV, Fixed, 95% CI) | 0.0 [0.0, 0.0] | ||||||||
| 4.1 calculated risk score (numerical) v general information | 0 | 0 | Mean Difference (IV, Fixed, 95% CI) | 0.0 [0.0, 0.0] | ||||||||
| 4.2 calculated risk score (categorised) v general information | 0 | 0 | Mean Difference (IV, Fixed, 95% CI) | 0.0 [0.0, 0.0] | ||||||||
| 4.3 personal risk factor list v general information | 0 | 0 | Mean Difference (IV, Fixed, 95% CI) | 0.0 [0.0, 0.0] | ||||||||
| 5 anxiety | 0 | 0 | Mean Difference (IV, Fixed, 95% CI) | 0.0 [0.0, 0.0] | ||||||||
| 5.1 calculated risk score (numerical) v general information | 0 | 0 | Mean Difference (IV, Fixed, 95% CI) | 0.0 [0.0, 0.0] | ||||||||
| 5.2 calculated risk score (categorised) v general information | 0 | 0 | Mean Difference (IV, Fixed, 95% CI) | 0.0 [0.0, 0.0] | ||||||||
| 5.3 personal risk factor list v general information | 0 | 0 | Mean Difference (IV, Fixed, 95% CI) | 0.0 [0.0, 0.0] | ||||||||
| 6 satisfaction with decision | 0 | 0 | Mean Difference (IV, Fixed, 95% CI) | 0.0 [0.0, 0.0] | ||||||||
| 6.1 calculated risk score (numerical) v general information | 0 | 0 | Mean Difference (IV, Fixed, 95% CI) | 0.0 [0.0, 0.0] | ||||||||
| 6.2 calculated risk score (categorised) v general information | 0 | 0 | Mean Difference (IV, Fixed, 95% CI) | 0.0 [0.0, 0.0] | ||||||||
| 6.3 personal risk factor list v general information | 0 | 0 | Mean Difference (IV, Fixed, 95% CI) | 0.0 [0.0, 0.0] | ||||||||
| 7 intention to take screening test Show forest plot | 1 | 478 | Odds Ratio (M‐H, Fixed, 95% CI) | 0.53 [0.36, 0.76] | ||||||||
| Analysis 3.7  Comparison 3 personalised risk communication versus general risk information for MAMMOGRAPHY, Outcome 7 intention to take screening test. | ||||||||||||
| 7.1 calculated risk score (numerical) v general information | 0 | 0 | Odds Ratio (M‐H, Fixed, 95% CI) | 0.0 [0.0, 0.0] | ||||||||
| 7.2 calculated risk score (categorised) v general information | 0 | 0 | Odds Ratio (M‐H, Fixed, 95% CI) | 0.0 [0.0, 0.0] | ||||||||
| 7.3 personal risk factor list v general information | 1 | 478 | Odds Ratio (M‐H, Fixed, 95% CI) | 0.53 [0.36, 0.76] | ||||||||
| 8 uptake of screening test Show forest plot | 11 | 5234 | Odds Ratio (M‐H, Fixed, 95% CI) | 1.11 [0.98, 1.24] | ||||||||
| Analysis 3.8  Comparison 3 personalised risk communication versus general risk information for MAMMOGRAPHY, Outcome 8 uptake of screening test. | ||||||||||||
| 8.1 calculated risk score (numerical) v general information | 3 | 1456 | Odds Ratio (M‐H, Fixed, 95% CI) | 0.82 [0.66, 1.02] | ||||||||
| 8.2 calculated risk score (categorised) v general information | 1 | 753 | Odds Ratio (M‐H, Fixed, 95% CI) | 1.37 [1.02, 1.84] | ||||||||
| 8.3 personal risk factor list v general information | 7 | 3025 | Odds Ratio (M‐H, Fixed, 95% CI) | 1.22 [1.04, 1.43] | ||||||||
| 9 stages of change Show forest plot | Other data | No numeric data | ||||||||||
| Analysis 3.9
Comparison 3 personalised risk communication versus general risk information for MAMMOGRAPHY, Outcome 9 stages of change. | ||||||||||||
| 9.1 personal risk factor list v general information | Other data | No numeric data | ||||||||||
| 10 anxiety (Cancer related anxiety and helplessness scale) | 0 | 0 | Mean Difference (IV, Fixed, 95% CI) | 0.0 [0.0, 0.0] | ||||||||
| 10.1 calculated risk score (numerical) v general information | 0 | 0 | Mean Difference (IV, Fixed, 95% CI) | 0.0 [0.0, 0.0] | ||||||||
| 10.2 calculated risk score (categorised) v general information | 0 | 0 | Mean Difference (IV, Fixed, 95% CI) | 0.0 [0.0, 0.0] | ||||||||
| 10.3 personal risk factor list v general information | 0 | 0 | Mean Difference (IV, Fixed, 95% CI) | 0.0 [0.0, 0.0] | ||||||||
| 11 improvement in risk comprehension/perception | 0 | 0 | Peto Odds Ratio (Peto, Fixed, 95% CI) | 0.0 [0.0, 0.0] | ||||||||
| 11.1 calculated risk score (numerical) v general information | 0 | 0 | Peto Odds Ratio (Peto, Fixed, 95% CI) | 0.0 [0.0, 0.0] | ||||||||
| 11.2 calculated risk score(categorised) v general information | 0 | 0 | Peto Odds Ratio (Peto, Fixed, 95% CI) | 0.0 [0.0, 0.0] | ||||||||
| 11.3 personal risk factor list v general information | 0 | 0 | Peto Odds Ratio (Peto, Fixed, 95% CI) | 0.0 [0.0, 0.0] | ||||||||
| Outcome or subgroup title | No. of studies | No. of participants | Statistical method | Effect size |
| 1 uptake of screening test Show forest plot | 1 | 276 | Odds Ratio (M‐H, Fixed, 95% CI) | 0.98 [0.57, 1.65] |
| Analysis 4.1  Comparison 4 personalised risk communication versus general risk information for CHOLESTEROL TESTS, Outcome 1 uptake of screening test. | ||||
| 1.1 calculated risk score (numerical) v general information | 1 | 276 | Odds Ratio (M‐H, Fixed, 95% CI) | 0.98 [0.57, 1.65] |
| 1.2 calculated risk score (categorised) v general information | 0 | 0 | Odds Ratio (M‐H, Fixed, 95% CI) | 0.0 [0.0, 0.0] |
| 1.3 personal risk factor list v general information | 0 | 0 | Odds Ratio (M‐H, Fixed, 95% CI) | 0.0 [0.0, 0.0] |
| 2 appropriate use of cholesterol test Show forest plot | 1 | 3152 | Odds Ratio (M‐H, Fixed, 95% CI) | 1.32 [1.14, 1.55] |
| Analysis 4.2  Comparison 4 personalised risk communication versus general risk information for CHOLESTEROL TESTS, Outcome 2 appropriate use of cholesterol test. | ||||
| 2.1 calculated risk score (numerical) v general information | 0 | 0 | Odds Ratio (M‐H, Fixed, 95% CI) | 0.0 [0.0, 0.0] |
| 2.2 calculated risk score (categorised) v general information | 0 | 0 | Odds Ratio (M‐H, Fixed, 95% CI) | 0.0 [0.0, 0.0] |
| 2.3 personal risk factor list v general information | 1 | 3152 | Odds Ratio (M‐H, Fixed, 95% CI) | 1.32 [1.14, 1.55] |
| Outcome or subgroup title | No. of studies | No. of participants | Statistical method | Effect size |
| 1 knowledge regarding screening test / condition concerned Show forest plot | 2 | 568 | Mean Difference (IV, Fixed, 95% CI) | 2.45 [1.94, 2.96] |
| Analysis 5.1  Comparison 5 personalised risk communication versus general risk information for 'HIGH RISK' PEOPLE, Outcome 1 knowledge regarding screening test / condition concerned. | ||||
| 1.1 calculated risk score (numerical) v general information | 0 | 0 | Mean Difference (IV, Fixed, 95% CI) | 0.0 [0.0, 0.0] |
| 1.2 calculated risk score (categorised) v general information | 1 | 260 | Mean Difference (IV, Fixed, 95% CI) | 12.0 [6.89, 17.11] |
| 1.3 personal risk factor list v general information | 1 | 308 | Mean Difference (IV, Fixed, 95% CI) | 2.35 [1.84, 2.86] |
| 2 perceived risk ‐ perceiving self as appropriate candidate for test Show forest plot | 1 | 214 | Odds Ratio (M‐H, Fixed, 95% CI) | 0.65 [0.35, 1.19] |
| Analysis 5.2  Comparison 5 personalised risk communication versus general risk information for 'HIGH RISK' PEOPLE, Outcome 2 perceived risk ‐ perceiving self as appropriate candidate for test. | ||||
| 2.1 calculated risk score (numerical) v general information | 1 | 214 | Odds Ratio (M‐H, Fixed, 95% CI) | 0.65 [0.35, 1.19] |
| 2.2 calculated risk score (categorised) v general information | 0 | 0 | Odds Ratio (M‐H, Fixed, 95% CI) | 0.0 [0.0, 0.0] |
| 2.3 personal risk factor list v general information | 0 | 0 | Odds Ratio (M‐H, Fixed, 95% CI) | 0.0 [0.0, 0.0] |
| 3 accurately perceived risk Show forest plot | 2 | 460 | Odds Ratio (M‐H, Fixed, 95% CI) | 2.25 [1.44, 3.53] |
| Analysis 5.3  Comparison 5 personalised risk communication versus general risk information for 'HIGH RISK' PEOPLE, Outcome 3 accurately perceived risk. | ||||
| 3.1 calculated risk score (numerical) v general information | 1 | 200 | Odds Ratio (M‐H, Fixed, 95% CI) | 1.69 [0.70, 4.06] |
| 3.2 calculated risk score (categorised) v general information | 1 | 260 | Odds Ratio (M‐H, Fixed, 95% CI) | 2.50 [1.48, 4.20] |
| 3.3 personal risk factor list v general information | 0 | 0 | Odds Ratio (M‐H, Fixed, 95% CI) | 0.0 [0.0, 0.0] |
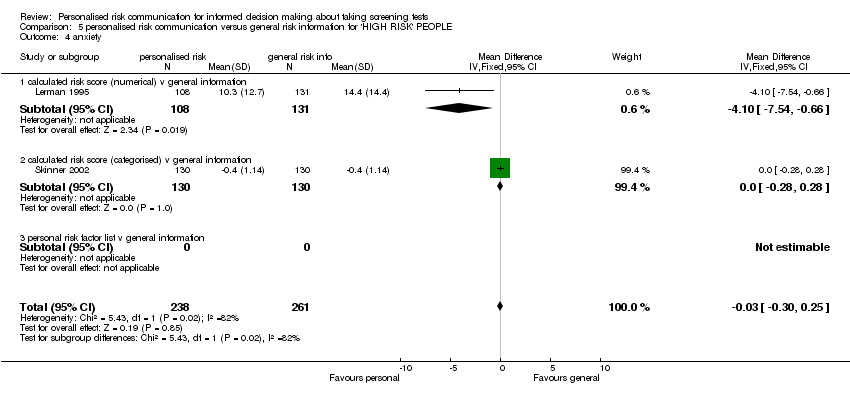
| 4 anxiety Show forest plot | 2 | 499 | Mean Difference (IV, Fixed, 95% CI) | ‐0.03 [‐0.30, 0.25] |
| Analysis 5.4  Comparison 5 personalised risk communication versus general risk information for 'HIGH RISK' PEOPLE, Outcome 4 anxiety. | ||||
| 4.1 calculated risk score (numerical) v general information | 1 | 239 | Mean Difference (IV, Fixed, 95% CI) | ‐4.1 [‐7.54, ‐0.66] |
| 4.2 calculated risk score (categorised) v general information | 1 | 260 | Mean Difference (IV, Fixed, 95% CI) | 0.0 [‐0.28, 0.28] |
| 4.3 personal risk factor list v general information | 0 | 0 | Mean Difference (IV, Fixed, 95% CI) | 0.0 [0.0, 0.0] |
| 5 satisfaction with decision | 0 | 0 | Mean Difference (IV, Fixed, 95% CI) | 0.0 [0.0, 0.0] |
| 5.1 calculated risk score (numerical) v general information | 0 | 0 | Mean Difference (IV, Fixed, 95% CI) | 0.0 [0.0, 0.0] |
| 5.2 calculated risk score (categorised) v general information | 0 | 0 | Mean Difference (IV, Fixed, 95% CI) | 0.0 [0.0, 0.0] |
| 5.3 personal risk factor list v general information | 0 | 0 | Mean Difference (IV, Fixed, 95% CI) | 0.0 [0.0, 0.0] |
| 6 decision conflict | 0 | 0 | Mean Difference (IV, Fixed, 95% CI) | 0.0 [0.0, 0.0] |
| 6.1 calculated risk score (numerical) v general information | 0 | 0 | Mean Difference (IV, Fixed, 95% CI) | 0.0 [0.0, 0.0] |
| 6.2 calculated risk score (categorised) v general information | 0 | 0 | Mean Difference (IV, Fixed, 95% CI) | 0.0 [0.0, 0.0] |
| 6.3 personal risk factor list v general information | 0 | 0 | Mean Difference (IV, Fixed, 95% CI) | 0.0 [0.0, 0.0] |
| 7 intention to take screening test Show forest plot | 2 | 540 | Odds Ratio (M‐H, Fixed, 95% CI) | 0.84 [0.55, 1.27] |
| Analysis 5.7  Comparison 5 personalised risk communication versus general risk information for 'HIGH RISK' PEOPLE, Outcome 7 intention to take screening test. | ||||
| 7.1 calculated risk score (numerical) v general information | 0 | 0 | Odds Ratio (M‐H, Fixed, 95% CI) | 0.0 [0.0, 0.0] |
| 7.2 calculated risk score (categorised) v general information | 1 | 260 | Odds Ratio (M‐H, Fixed, 95% CI) | 0.21 [0.07, 0.65] |
| 7.3 personal risk factor list v general information | 1 | 280 | Odds Ratio (M‐H, Fixed, 95% CI) | 1.17 [0.72, 1.89] |
| 8 uptake of screening test Show forest plot | 5 | 3145 | Odds Ratio (M‐H, Fixed, 95% CI) | 1.45 [1.23, 1.71] |
| Analysis 5.8  Comparison 5 personalised risk communication versus general risk information for 'HIGH RISK' PEOPLE, Outcome 8 uptake of screening test. | ||||
| 8.1 calculated risk score (numerical) v general information | 2 | 1355 | Odds Ratio (M‐H, Fixed, 95% CI) | 1.48 [1.06, 2.07] |
| 8.2 calculated risk score (categorised) v general information | 1 | 753 | Odds Ratio (M‐H, Fixed, 95% CI) | 1.37 [1.02, 1.84] |
| 8.3 personal risk factor list v general information | 2 | 1037 | Odds Ratio (M‐H, Fixed, 95% CI) | 1.49 [1.16, 1.91] |
| 9 improvement in risk comprehension/perception | 0 | 0 | Peto Odds Ratio (Peto, Fixed, 95% CI) | 0.0 [0.0, 0.0] |
| 9.1 calculated risk score (numerical) v general information | 0 | 0 | Peto Odds Ratio (Peto, Fixed, 95% CI) | 0.0 [0.0, 0.0] |
| 9.2 calculated risk score(categorised) v general information | 0 | 0 | Peto Odds Ratio (Peto, Fixed, 95% CI) | 0.0 [0.0, 0.0] |
| 9.3 personal risk factor list v general information | 0 | 0 | Peto Odds Ratio (Peto, Fixed, 95% CI) | 0.0 [0.0, 0.0] |
| 10 anxiety (Cancer related anxiety and helplessness scale) | 0 | 0 | Mean Difference (IV, Fixed, 95% CI) | 0.0 [0.0, 0.0] |
| 10.1 calculated risk score (numerical) v general information | 0 | 0 | Mean Difference (IV, Fixed, 95% CI) | 0.0 [0.0, 0.0] |
| 10.2 calculated risk score (categorised) v general information | 0 | 0 | Mean Difference (IV, Fixed, 95% CI) | 0.0 [0.0, 0.0] |
| 10.3 personal risk factor list v general information | 0 | 0 | Mean Difference (IV, Fixed, 95% CI) | 0.0 [0.0, 0.0] |
| Outcome or subgroup title | No. of studies | No. of participants | Statistical method | Effect size |
| 1 uptake of screening test Show forest plot | 1 | 278 | Odds Ratio (M‐H, Fixed, 95% CI) | 2.09 [0.76, 5.75] |
| Analysis 6.1  Comparison 6 personalised risk communication versus general risk information for COLORECTAL SCREENING, Outcome 1 uptake of screening test. | ||||
| 1.1 calculated risk score (numerical) v general information | 0 | 0 | Odds Ratio (M‐H, Fixed, 95% CI) | 0.0 [0.0, 0.0] |
| 1.2 calculated risk score (categorised) v general information | 1 | 278 | Odds Ratio (M‐H, Fixed, 95% CI) | 2.09 [0.76, 5.75] |
| 1.3 personal risk factor list v general information | 0 | 0 | Odds Ratio (M‐H, Fixed, 95% CI) | 0.0 [0.0, 0.0] |
| Outcome or subgroup title | No. of studies | No. of participants | Statistical method | Effect size |
| 1 uptake of screening test Show forest plot | 1 | 413 | Odds Ratio (M‐H, Fixed, 95% CI) | 2.56 [1.70, 3.84] |
| Analysis 7.1  Comparison 7 personalised risk communication versus general risk information for PROSTATE CANCER SCREENING, Outcome 1 uptake of screening test. | ||||
| 1.1 calculated risk score (numerical) v general information | 0 | 0 | Odds Ratio (M‐H, Fixed, 95% CI) | 0.0 [0.0, 0.0] |
| 1.2 calculated risk score (categorised) v general information | 0 | 0 | Odds Ratio (M‐H, Fixed, 95% CI) | 0.0 [0.0, 0.0] |
| 1.3 personal risk factor list v general information | 1 | 413 | Odds Ratio (M‐H, Fixed, 95% CI) | 2.56 [1.70, 3.84] |
Comparison 1 personalised risk communication versus general risk information, Outcome 1 knowledge regarding screening test / condition concerned.

Comparison 1 personalised risk communication versus general risk information, Outcome 2 knowledge regarding screening test / condition concerned.
Comparison 1 personalised risk communication versus general risk information, Outcome 3 perceived risk ‐ perceiving self as appropriate candidate for test.

Comparison 1 personalised risk communication versus general risk information, Outcome 4 accurately perceived risk.
Comparison 1 personalised risk communication versus general risk information, Outcome 5 anxiety (Cancer related anxiety and helplessness scale; IES breast cancer distress).

Comparison 1 personalised risk communication versus general risk information, Outcome 8 intention to take screening test.
Comparison 1 personalised risk communication versus general risk information, Outcome 9 uptake of screening test.

Comparison 1 personalised risk communication versus general risk information, Outcome 10 appropriate use of cholesterol test.

Comparison 1 personalised risk communication versus general risk information, Outcome 11 smoking.
| Study | |
| personal risk factor list v general information | |
| Skinner 1994 | 71% did not change; 14% advanced one stage; 12% 'regressed': no significant differences between tailored message and control. |
Comparison 1 personalised risk communication versus general risk information, Outcome 12 stages of change.
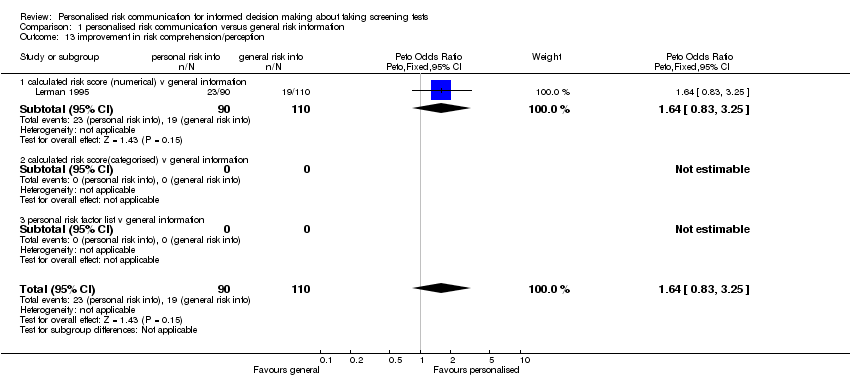
Comparison 1 personalised risk communication versus general risk information, Outcome 13 improvement in risk comprehension/perception.

Comparison 1 personalised risk communication versus general risk information, Outcome 14 making a recommended behaviour change.

Comparison 2 personalised risk communication versus general risk information for PAP SMEARS, Outcome 1 intention to take screening test.
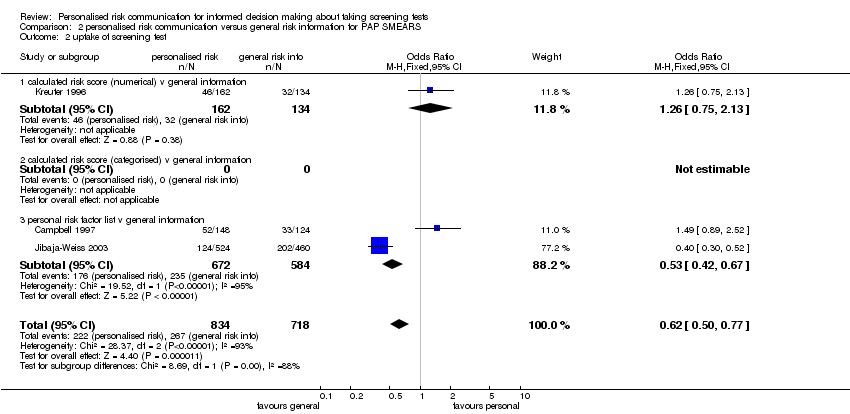
Comparison 2 personalised risk communication versus general risk information for PAP SMEARS, Outcome 2 uptake of screening test.

Comparison 3 personalised risk communication versus general risk information for MAMMOGRAPHY, Outcome 2 knowledge regarding screening test / condition concerned.

Comparison 3 personalised risk communication versus general risk information for MAMMOGRAPHY, Outcome 3 accuracy of perceived risk.

Comparison 3 personalised risk communication versus general risk information for MAMMOGRAPHY, Outcome 7 intention to take screening test.
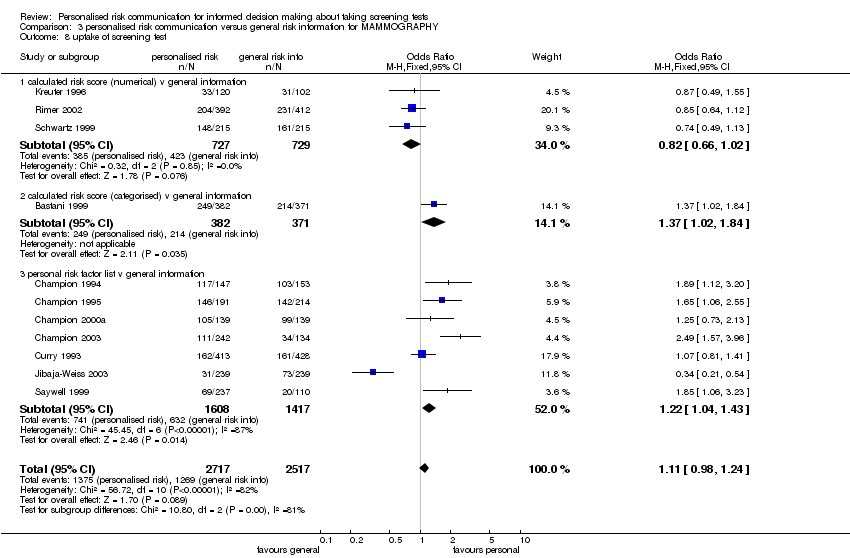
Comparison 3 personalised risk communication versus general risk information for MAMMOGRAPHY, Outcome 8 uptake of screening test.
| Study | |
| personal risk factor list v general information | |
| Skinner 1994 | 71% did not change; 14% advanced one stage; 12% 'regressed': no significant differences between tailored message and control. |
Comparison 3 personalised risk communication versus general risk information for MAMMOGRAPHY, Outcome 9 stages of change.

Comparison 4 personalised risk communication versus general risk information for CHOLESTEROL TESTS, Outcome 1 uptake of screening test.

Comparison 4 personalised risk communication versus general risk information for CHOLESTEROL TESTS, Outcome 2 appropriate use of cholesterol test.

Comparison 5 personalised risk communication versus general risk information for 'HIGH RISK' PEOPLE, Outcome 1 knowledge regarding screening test / condition concerned.

Comparison 5 personalised risk communication versus general risk information for 'HIGH RISK' PEOPLE, Outcome 2 perceived risk ‐ perceiving self as appropriate candidate for test.
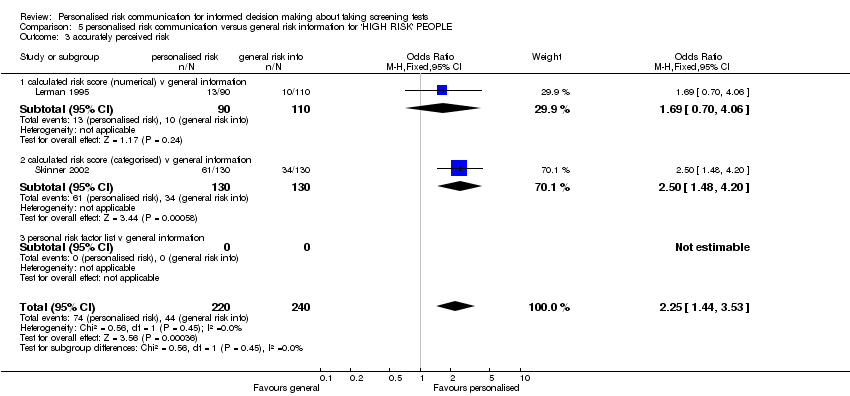
Comparison 5 personalised risk communication versus general risk information for 'HIGH RISK' PEOPLE, Outcome 3 accurately perceived risk.
Comparison 5 personalised risk communication versus general risk information for 'HIGH RISK' PEOPLE, Outcome 4 anxiety.

Comparison 5 personalised risk communication versus general risk information for 'HIGH RISK' PEOPLE, Outcome 7 intention to take screening test.

Comparison 5 personalised risk communication versus general risk information for 'HIGH RISK' PEOPLE, Outcome 8 uptake of screening test.

Comparison 6 personalised risk communication versus general risk information for COLORECTAL SCREENING, Outcome 1 uptake of screening test.

Comparison 7 personalised risk communication versus general risk information for PROSTATE CANCER SCREENING, Outcome 1 uptake of screening test.
| Outcome or subgroup title | No. of studies | No. of participants | Statistical method | Effect size |
| 1 knowledge regarding screening test / condition concerned Show forest plot | 2 | 568 | Mean Difference (IV, Fixed, 95% CI) | 2.45 [1.94, 2.96] |
| 1.1 calculated risk score (numerical) v general information | 0 | 0 | Mean Difference (IV, Fixed, 95% CI) | 0.0 [0.0, 0.0] |
| 1.2 calculated risk score (categorised) v general information | 1 | 260 | Mean Difference (IV, Fixed, 95% CI) | 12.0 [6.89, 17.11] |
| 1.3 personal risk factor list v general information | 1 | 308 | Mean Difference (IV, Fixed, 95% CI) | 2.35 [1.84, 2.86] |
| 2 knowledge regarding screening test / condition concerned Show forest plot | 1 | 804 | Odds Ratio (M‐H, Fixed, 95% CI) | 1.44 [0.95, 2.19] |
| 2.1 calculated risk score (numerical) v general information | 1 | 804 | Odds Ratio (M‐H, Fixed, 95% CI) | 1.44 [0.95, 2.19] |
| 2.2 calculated risk score (categorised) v general information | 0 | 0 | Odds Ratio (M‐H, Fixed, 95% CI) | 0.0 [0.0, 0.0] |
| 2.3 personal risk factor list v general information | 0 | 0 | Odds Ratio (M‐H, Fixed, 95% CI) | 0.0 [0.0, 0.0] |
| 3 perceived risk ‐ perceiving self as appropriate candidate for test Show forest plot | 1 | 214 | Odds Ratio (M‐H, Fixed, 95% CI) | 0.65 [0.35, 1.19] |
| 3.1 calculated risk score (numerical) v general information | 1 | 214 | Odds Ratio (M‐H, Fixed, 95% CI) | 0.65 [0.35, 1.19] |
| 3.2 calculated risk score (categorised) v general information | 0 | 0 | Odds Ratio (M‐H, Fixed, 95% CI) | 0.0 [0.0, 0.0] |
| 3.3 personal risk factor list v general information | 0 | 0 | Odds Ratio (M‐H, Fixed, 95% CI) | 0.0 [0.0, 0.0] |
| 4 accurately perceived risk Show forest plot | 3 | 1264 | Odds Ratio (M‐H, Fixed, 95% CI) | 1.46 [1.13, 1.88] |
| 4.1 calculated risk score (numerical) v general information | 2 | 1004 | Odds Ratio (M‐H, Fixed, 95% CI) | 1.22 [0.91, 1.64] |
| 4.2 calculated risk score (categorised) v general information | 1 | 260 | Odds Ratio (M‐H, Fixed, 95% CI) | 2.50 [1.48, 4.20] |
| 4.3 personal risk factor list v general information | 0 | 0 | Odds Ratio (M‐H, Fixed, 95% CI) | 0.0 [0.0, 0.0] |
| 5 anxiety (Cancer related anxiety and helplessness scale; IES breast cancer distress) Show forest plot | 2 | 499 | Mean Difference (IV, Fixed, 95% CI) | ‐0.03 [‐0.30, 0.25] |
| 5.1 calculated risk score (numerical) v general information | 1 | 239 | Mean Difference (IV, Fixed, 95% CI) | ‐4.1 [‐7.54, ‐0.66] |
| 5.2 calculated risk score (categorised) v general information | 1 | 260 | Mean Difference (IV, Fixed, 95% CI) | 0.0 [‐0.28, 0.28] |
| 5.3 personal risk factor list v general information | 0 | 0 | Mean Difference (IV, Fixed, 95% CI) | 0.0 [0.0, 0.0] |
| 6 satisfaction with decision | 0 | 0 | Mean Difference (IV, Fixed, 95% CI) | 0.0 [0.0, 0.0] |
| 6.1 calculated risk score (numerical) v general information | 0 | 0 | Mean Difference (IV, Fixed, 95% CI) | 0.0 [0.0, 0.0] |
| 6.2 calculated risk score (categorised) v general information | 0 | 0 | Mean Difference (IV, Fixed, 95% CI) | 0.0 [0.0, 0.0] |
| 6.3 personal risk factor list v general information | 0 | 0 | Mean Difference (IV, Fixed, 95% CI) | 0.0 [0.0, 0.0] |
| 7 decision conflict | 0 | 0 | Mean Difference (IV, Fixed, 95% CI) | 0.0 [0.0, 0.0] |
| 7.1 calculated risk score (numerical) v general information | 0 | 0 | Mean Difference (IV, Fixed, 95% CI) | 0.0 [0.0, 0.0] |
| 7.2 calculated risk score (categorised) v general information | 0 | 0 | Mean Difference (IV, Fixed, 95% CI) | 0.0 [0.0, 0.0] |
| 7.3 personal risk factor list v general information | 0 | 0 | Mean Difference (IV, Fixed, 95% CI) | 0.0 [0.0, 0.0] |
| 8 intention to take screening test Show forest plot | 5 | 2016 | Odds Ratio (M‐H, Fixed, 95% CI) | 0.86 [0.71, 1.03] |
| 8.1 calculated risk score (numerical) v general information | 1 | 214 | Odds Ratio (M‐H, Fixed, 95% CI) | 1.10 [0.63, 1.94] |
| 8.2 calculated risk score (categorised) v general information | 2 | 538 | Odds Ratio (M‐H, Fixed, 95% CI) | 1.68 [1.12, 2.53] |
| 8.3 personal risk factor list v general information | 2 | 1264 | Odds Ratio (M‐H, Fixed, 95% CI) | 0.68 [0.54, 0.84] |
| 9 uptake of screening test Show forest plot | 14 | 7341 | Odds Ratio (M‐H, Fixed, 95% CI) | 1.13 [1.02, 1.24] |
| 9.1 calculated risk score (numerical) v general information | 2 | 1234 | Odds Ratio (M‐H, Fixed, 95% CI) | 0.82 [0.65, 1.03] |
| 9.2 calculated risk score (categorised) v general information | 2 | 1031 | Odds Ratio (M‐H, Fixed, 95% CI) | 1.42 [1.07, 1.89] |
| 9.3 personal risk factor list v general information | 10 | 5076 | Odds Ratio (M‐H, Fixed, 95% CI) | 1.17 [1.04, 1.32] |
| 10 appropriate use of cholesterol test Show forest plot | 1 | 3152 | Odds Ratio (M‐H, Fixed, 95% CI) | 1.32 [1.14, 1.55] |
| 10.1 calculated risk score (numerical) v general information | 0 | 0 | Odds Ratio (M‐H, Fixed, 95% CI) | 0.0 [0.0, 0.0] |
| 10.2 calculated risk score (categorised) v general information | 0 | 0 | Odds Ratio (M‐H, Fixed, 95% CI) | 0.0 [0.0, 0.0] |
| 10.3 personal risk factor list v general information | 1 | 3152 | Odds Ratio (M‐H, Fixed, 95% CI) | 1.32 [1.14, 1.55] |
| 11 smoking Show forest plot | 1 | 204 | Odds Ratio (M‐H, Fixed, 95% CI) | 1.04 [0.60, 1.82] |
| 11.1 calculated risk score (numerical) v general information | 1 | 204 | Odds Ratio (M‐H, Fixed, 95% CI) | 1.04 [0.60, 1.82] |
| 11.2 calculated risk score (categorised) v general information | 0 | 0 | Odds Ratio (M‐H, Fixed, 95% CI) | 0.0 [0.0, 0.0] |
| 11.3 personal risk factor list v general information | 0 | 0 | Odds Ratio (M‐H, Fixed, 95% CI) | 0.0 [0.0, 0.0] |
| 12 stages of change Show forest plot | Other data | No numeric data | ||
| 12.1 personal risk factor list v general information | Other data | No numeric data | ||
| 13 improvement in risk comprehension/perception Show forest plot | 1 | 200 | Peto Odds Ratio (Peto, Fixed, 95% CI) | 1.64 [0.83, 3.25] |
| 13.1 calculated risk score (numerical) v general information | 1 | 200 | Peto Odds Ratio (Peto, Fixed, 95% CI) | 1.64 [0.83, 3.25] |
| 13.2 calculated risk score(categorised) v general information | 0 | 0 | Peto Odds Ratio (Peto, Fixed, 95% CI) | 0.0 [0.0, 0.0] |
| 13.3 personal risk factor list v general information | 0 | 0 | Peto Odds Ratio (Peto, Fixed, 95% CI) | 0.0 [0.0, 0.0] |
| 14 making a recommended behaviour change Show forest plot | 1 | 890 | Odds Ratio (M‐H, Fixed, 95% CI) | 0.98 [0.76, 1.28] |
| 14.1 personal risk factor list v general information | 1 | 890 | Odds Ratio (M‐H, Fixed, 95% CI) | 0.98 [0.76, 1.28] |
| 14.2 calculated risk score(categorised) v general information | 0 | 0 | Odds Ratio (M‐H, Fixed, 95% CI) | 0.0 [0.0, 0.0] |
| 14.3 personal risk factor list v general information | 0 | 0 | Odds Ratio (M‐H, Fixed, 95% CI) | 0.0 [0.0, 0.0] |
| Outcome or subgroup title | No. of studies | No. of participants | Statistical method | Effect size |
| 1 intention to take screening test Show forest plot | 1 | 984 | Odds Ratio (M‐H, Fixed, 95% CI) | 0.58 [0.45, 0.74] |
| 1.1 calculated risk score (numerical) v general information | 0 | 0 | Odds Ratio (M‐H, Fixed, 95% CI) | 0.0 [0.0, 0.0] |
| 1.2 calculated risk score (categorised) v general information | 0 | 0 | Odds Ratio (M‐H, Fixed, 95% CI) | 0.0 [0.0, 0.0] |
| 1.3 personal risk factor list v general information | 1 | 984 | Odds Ratio (M‐H, Fixed, 95% CI) | 0.58 [0.45, 0.74] |
| 2 uptake of screening test Show forest plot | 3 | 1552 | Odds Ratio (M‐H, Fixed, 95% CI) | 0.62 [0.50, 0.77] |
| 2.1 calculated risk score (numerical) v general information | 1 | 296 | Odds Ratio (M‐H, Fixed, 95% CI) | 1.26 [0.75, 2.13] |
| 2.2 calculated risk score (categorised) v general information | 0 | 0 | Odds Ratio (M‐H, Fixed, 95% CI) | 0.0 [0.0, 0.0] |
| 2.3 personal risk factor list v general information | 2 | 1256 | Odds Ratio (M‐H, Fixed, 95% CI) | 0.53 [0.42, 0.67] |
| Outcome or subgroup title | No. of studies | No. of participants | Statistical method | Effect size |
| 1 knowledge regarding screening test / condition concerned | 0 | 0 | Mean Difference (IV, Fixed, 95% CI) | 0.0 [0.0, 0.0] |
| 1.1 calculated risk score (numerical) v general information | 0 | 0 | Mean Difference (IV, Fixed, 95% CI) | 0.0 [0.0, 0.0] |
| 1.2 calculated risk score (categorised) v general information | 0 | 0 | Mean Difference (IV, Fixed, 95% CI) | 0.0 [0.0, 0.0] |
| 1.3 personal risk factor list v general information | 0 | 0 | Mean Difference (IV, Fixed, 95% CI) | 0.0 [0.0, 0.0] |
| 2 knowledge regarding screening test / condition concerned Show forest plot | 1 | 804 | Odds Ratio (M‐H, Fixed, 95% CI) | 1.44 [0.95, 2.19] |
| 2.1 calculated risk score (numerical) v general information | 1 | 804 | Odds Ratio (M‐H, Fixed, 95% CI) | 1.44 [0.95, 2.19] |
| 2.2 calculated risk score (categorised) v general information | 0 | 0 | Odds Ratio (M‐H, Fixed, 95% CI) | 0.0 [0.0, 0.0] |
| 2.3 personal risk factor list v general information | 0 | 0 | Odds Ratio (M‐H, Fixed, 95% CI) | 0.0 [0.0, 0.0] |
| 3 accuracy of perceived risk Show forest plot | 1 | 804 | Odds Ratio (M‐H, Fixed, 95% CI) | 1.17 [0.86, 1.60] |
| 3.1 calculated risk score (numerical) v general information | 1 | 804 | Odds Ratio (M‐H, Fixed, 95% CI) | 1.17 [0.86, 1.60] |
| 3.2 calculated risk score (categorised) v general information | 0 | 0 | Odds Ratio (M‐H, Fixed, 95% CI) | 0.0 [0.0, 0.0] |
| 3.3 personal risk factor list v general information | 0 | 0 | Odds Ratio (M‐H, Fixed, 95% CI) | 0.0 [0.0, 0.0] |
| 4 decision conflict | 0 | 0 | Mean Difference (IV, Fixed, 95% CI) | 0.0 [0.0, 0.0] |
| 4.1 calculated risk score (numerical) v general information | 0 | 0 | Mean Difference (IV, Fixed, 95% CI) | 0.0 [0.0, 0.0] |
| 4.2 calculated risk score (categorised) v general information | 0 | 0 | Mean Difference (IV, Fixed, 95% CI) | 0.0 [0.0, 0.0] |
| 4.3 personal risk factor list v general information | 0 | 0 | Mean Difference (IV, Fixed, 95% CI) | 0.0 [0.0, 0.0] |
| 5 anxiety | 0 | 0 | Mean Difference (IV, Fixed, 95% CI) | 0.0 [0.0, 0.0] |
| 5.1 calculated risk score (numerical) v general information | 0 | 0 | Mean Difference (IV, Fixed, 95% CI) | 0.0 [0.0, 0.0] |
| 5.2 calculated risk score (categorised) v general information | 0 | 0 | Mean Difference (IV, Fixed, 95% CI) | 0.0 [0.0, 0.0] |
| 5.3 personal risk factor list v general information | 0 | 0 | Mean Difference (IV, Fixed, 95% CI) | 0.0 [0.0, 0.0] |
| 6 satisfaction with decision | 0 | 0 | Mean Difference (IV, Fixed, 95% CI) | 0.0 [0.0, 0.0] |
| 6.1 calculated risk score (numerical) v general information | 0 | 0 | Mean Difference (IV, Fixed, 95% CI) | 0.0 [0.0, 0.0] |
| 6.2 calculated risk score (categorised) v general information | 0 | 0 | Mean Difference (IV, Fixed, 95% CI) | 0.0 [0.0, 0.0] |
| 6.3 personal risk factor list v general information | 0 | 0 | Mean Difference (IV, Fixed, 95% CI) | 0.0 [0.0, 0.0] |
| 7 intention to take screening test Show forest plot | 1 | 478 | Odds Ratio (M‐H, Fixed, 95% CI) | 0.53 [0.36, 0.76] |
| 7.1 calculated risk score (numerical) v general information | 0 | 0 | Odds Ratio (M‐H, Fixed, 95% CI) | 0.0 [0.0, 0.0] |
| 7.2 calculated risk score (categorised) v general information | 0 | 0 | Odds Ratio (M‐H, Fixed, 95% CI) | 0.0 [0.0, 0.0] |
| 7.3 personal risk factor list v general information | 1 | 478 | Odds Ratio (M‐H, Fixed, 95% CI) | 0.53 [0.36, 0.76] |
| 8 uptake of screening test Show forest plot | 11 | 5234 | Odds Ratio (M‐H, Fixed, 95% CI) | 1.11 [0.98, 1.24] |
| 8.1 calculated risk score (numerical) v general information | 3 | 1456 | Odds Ratio (M‐H, Fixed, 95% CI) | 0.82 [0.66, 1.02] |
| 8.2 calculated risk score (categorised) v general information | 1 | 753 | Odds Ratio (M‐H, Fixed, 95% CI) | 1.37 [1.02, 1.84] |
| 8.3 personal risk factor list v general information | 7 | 3025 | Odds Ratio (M‐H, Fixed, 95% CI) | 1.22 [1.04, 1.43] |
| 9 stages of change Show forest plot | Other data | No numeric data | ||
| 9.1 personal risk factor list v general information | Other data | No numeric data | ||
| 10 anxiety (Cancer related anxiety and helplessness scale) | 0 | 0 | Mean Difference (IV, Fixed, 95% CI) | 0.0 [0.0, 0.0] |
| 10.1 calculated risk score (numerical) v general information | 0 | 0 | Mean Difference (IV, Fixed, 95% CI) | 0.0 [0.0, 0.0] |
| 10.2 calculated risk score (categorised) v general information | 0 | 0 | Mean Difference (IV, Fixed, 95% CI) | 0.0 [0.0, 0.0] |
| 10.3 personal risk factor list v general information | 0 | 0 | Mean Difference (IV, Fixed, 95% CI) | 0.0 [0.0, 0.0] |
| 11 improvement in risk comprehension/perception | 0 | 0 | Peto Odds Ratio (Peto, Fixed, 95% CI) | 0.0 [0.0, 0.0] |
| 11.1 calculated risk score (numerical) v general information | 0 | 0 | Peto Odds Ratio (Peto, Fixed, 95% CI) | 0.0 [0.0, 0.0] |
| 11.2 calculated risk score(categorised) v general information | 0 | 0 | Peto Odds Ratio (Peto, Fixed, 95% CI) | 0.0 [0.0, 0.0] |
| 11.3 personal risk factor list v general information | 0 | 0 | Peto Odds Ratio (Peto, Fixed, 95% CI) | 0.0 [0.0, 0.0] |
| Outcome or subgroup title | No. of studies | No. of participants | Statistical method | Effect size |
| 1 uptake of screening test Show forest plot | 1 | 276 | Odds Ratio (M‐H, Fixed, 95% CI) | 0.98 [0.57, 1.65] |
| 1.1 calculated risk score (numerical) v general information | 1 | 276 | Odds Ratio (M‐H, Fixed, 95% CI) | 0.98 [0.57, 1.65] |
| 1.2 calculated risk score (categorised) v general information | 0 | 0 | Odds Ratio (M‐H, Fixed, 95% CI) | 0.0 [0.0, 0.0] |
| 1.3 personal risk factor list v general information | 0 | 0 | Odds Ratio (M‐H, Fixed, 95% CI) | 0.0 [0.0, 0.0] |
| 2 appropriate use of cholesterol test Show forest plot | 1 | 3152 | Odds Ratio (M‐H, Fixed, 95% CI) | 1.32 [1.14, 1.55] |
| 2.1 calculated risk score (numerical) v general information | 0 | 0 | Odds Ratio (M‐H, Fixed, 95% CI) | 0.0 [0.0, 0.0] |
| 2.2 calculated risk score (categorised) v general information | 0 | 0 | Odds Ratio (M‐H, Fixed, 95% CI) | 0.0 [0.0, 0.0] |
| 2.3 personal risk factor list v general information | 1 | 3152 | Odds Ratio (M‐H, Fixed, 95% CI) | 1.32 [1.14, 1.55] |
| Outcome or subgroup title | No. of studies | No. of participants | Statistical method | Effect size |
| 1 knowledge regarding screening test / condition concerned Show forest plot | 2 | 568 | Mean Difference (IV, Fixed, 95% CI) | 2.45 [1.94, 2.96] |
| 1.1 calculated risk score (numerical) v general information | 0 | 0 | Mean Difference (IV, Fixed, 95% CI) | 0.0 [0.0, 0.0] |
| 1.2 calculated risk score (categorised) v general information | 1 | 260 | Mean Difference (IV, Fixed, 95% CI) | 12.0 [6.89, 17.11] |
| 1.3 personal risk factor list v general information | 1 | 308 | Mean Difference (IV, Fixed, 95% CI) | 2.35 [1.84, 2.86] |
| 2 perceived risk ‐ perceiving self as appropriate candidate for test Show forest plot | 1 | 214 | Odds Ratio (M‐H, Fixed, 95% CI) | 0.65 [0.35, 1.19] |
| 2.1 calculated risk score (numerical) v general information | 1 | 214 | Odds Ratio (M‐H, Fixed, 95% CI) | 0.65 [0.35, 1.19] |
| 2.2 calculated risk score (categorised) v general information | 0 | 0 | Odds Ratio (M‐H, Fixed, 95% CI) | 0.0 [0.0, 0.0] |
| 2.3 personal risk factor list v general information | 0 | 0 | Odds Ratio (M‐H, Fixed, 95% CI) | 0.0 [0.0, 0.0] |
| 3 accurately perceived risk Show forest plot | 2 | 460 | Odds Ratio (M‐H, Fixed, 95% CI) | 2.25 [1.44, 3.53] |
| 3.1 calculated risk score (numerical) v general information | 1 | 200 | Odds Ratio (M‐H, Fixed, 95% CI) | 1.69 [0.70, 4.06] |
| 3.2 calculated risk score (categorised) v general information | 1 | 260 | Odds Ratio (M‐H, Fixed, 95% CI) | 2.50 [1.48, 4.20] |
| 3.3 personal risk factor list v general information | 0 | 0 | Odds Ratio (M‐H, Fixed, 95% CI) | 0.0 [0.0, 0.0] |
| 4 anxiety Show forest plot | 2 | 499 | Mean Difference (IV, Fixed, 95% CI) | ‐0.03 [‐0.30, 0.25] |
| 4.1 calculated risk score (numerical) v general information | 1 | 239 | Mean Difference (IV, Fixed, 95% CI) | ‐4.1 [‐7.54, ‐0.66] |
| 4.2 calculated risk score (categorised) v general information | 1 | 260 | Mean Difference (IV, Fixed, 95% CI) | 0.0 [‐0.28, 0.28] |
| 4.3 personal risk factor list v general information | 0 | 0 | Mean Difference (IV, Fixed, 95% CI) | 0.0 [0.0, 0.0] |
| 5 satisfaction with decision | 0 | 0 | Mean Difference (IV, Fixed, 95% CI) | 0.0 [0.0, 0.0] |
| 5.1 calculated risk score (numerical) v general information | 0 | 0 | Mean Difference (IV, Fixed, 95% CI) | 0.0 [0.0, 0.0] |
| 5.2 calculated risk score (categorised) v general information | 0 | 0 | Mean Difference (IV, Fixed, 95% CI) | 0.0 [0.0, 0.0] |
| 5.3 personal risk factor list v general information | 0 | 0 | Mean Difference (IV, Fixed, 95% CI) | 0.0 [0.0, 0.0] |
| 6 decision conflict | 0 | 0 | Mean Difference (IV, Fixed, 95% CI) | 0.0 [0.0, 0.0] |
| 6.1 calculated risk score (numerical) v general information | 0 | 0 | Mean Difference (IV, Fixed, 95% CI) | 0.0 [0.0, 0.0] |
| 6.2 calculated risk score (categorised) v general information | 0 | 0 | Mean Difference (IV, Fixed, 95% CI) | 0.0 [0.0, 0.0] |
| 6.3 personal risk factor list v general information | 0 | 0 | Mean Difference (IV, Fixed, 95% CI) | 0.0 [0.0, 0.0] |
| 7 intention to take screening test Show forest plot | 2 | 540 | Odds Ratio (M‐H, Fixed, 95% CI) | 0.84 [0.55, 1.27] |
| 7.1 calculated risk score (numerical) v general information | 0 | 0 | Odds Ratio (M‐H, Fixed, 95% CI) | 0.0 [0.0, 0.0] |
| 7.2 calculated risk score (categorised) v general information | 1 | 260 | Odds Ratio (M‐H, Fixed, 95% CI) | 0.21 [0.07, 0.65] |
| 7.3 personal risk factor list v general information | 1 | 280 | Odds Ratio (M‐H, Fixed, 95% CI) | 1.17 [0.72, 1.89] |
| 8 uptake of screening test Show forest plot | 5 | 3145 | Odds Ratio (M‐H, Fixed, 95% CI) | 1.45 [1.23, 1.71] |
| 8.1 calculated risk score (numerical) v general information | 2 | 1355 | Odds Ratio (M‐H, Fixed, 95% CI) | 1.48 [1.06, 2.07] |
| 8.2 calculated risk score (categorised) v general information | 1 | 753 | Odds Ratio (M‐H, Fixed, 95% CI) | 1.37 [1.02, 1.84] |
| 8.3 personal risk factor list v general information | 2 | 1037 | Odds Ratio (M‐H, Fixed, 95% CI) | 1.49 [1.16, 1.91] |
| 9 improvement in risk comprehension/perception | 0 | 0 | Peto Odds Ratio (Peto, Fixed, 95% CI) | 0.0 [0.0, 0.0] |
| 9.1 calculated risk score (numerical) v general information | 0 | 0 | Peto Odds Ratio (Peto, Fixed, 95% CI) | 0.0 [0.0, 0.0] |
| 9.2 calculated risk score(categorised) v general information | 0 | 0 | Peto Odds Ratio (Peto, Fixed, 95% CI) | 0.0 [0.0, 0.0] |
| 9.3 personal risk factor list v general information | 0 | 0 | Peto Odds Ratio (Peto, Fixed, 95% CI) | 0.0 [0.0, 0.0] |
| 10 anxiety (Cancer related anxiety and helplessness scale) | 0 | 0 | Mean Difference (IV, Fixed, 95% CI) | 0.0 [0.0, 0.0] |
| 10.1 calculated risk score (numerical) v general information | 0 | 0 | Mean Difference (IV, Fixed, 95% CI) | 0.0 [0.0, 0.0] |
| 10.2 calculated risk score (categorised) v general information | 0 | 0 | Mean Difference (IV, Fixed, 95% CI) | 0.0 [0.0, 0.0] |
| 10.3 personal risk factor list v general information | 0 | 0 | Mean Difference (IV, Fixed, 95% CI) | 0.0 [0.0, 0.0] |
| Outcome or subgroup title | No. of studies | No. of participants | Statistical method | Effect size |
| 1 uptake of screening test Show forest plot | 1 | 278 | Odds Ratio (M‐H, Fixed, 95% CI) | 2.09 [0.76, 5.75] |
| 1.1 calculated risk score (numerical) v general information | 0 | 0 | Odds Ratio (M‐H, Fixed, 95% CI) | 0.0 [0.0, 0.0] |
| 1.2 calculated risk score (categorised) v general information | 1 | 278 | Odds Ratio (M‐H, Fixed, 95% CI) | 2.09 [0.76, 5.75] |
| 1.3 personal risk factor list v general information | 0 | 0 | Odds Ratio (M‐H, Fixed, 95% CI) | 0.0 [0.0, 0.0] |
| Outcome or subgroup title | No. of studies | No. of participants | Statistical method | Effect size |
| 1 uptake of screening test Show forest plot | 1 | 413 | Odds Ratio (M‐H, Fixed, 95% CI) | 2.56 [1.70, 3.84] |
| 1.1 calculated risk score (numerical) v general information | 0 | 0 | Odds Ratio (M‐H, Fixed, 95% CI) | 0.0 [0.0, 0.0] |
| 1.2 calculated risk score (categorised) v general information | 0 | 0 | Odds Ratio (M‐H, Fixed, 95% CI) | 0.0 [0.0, 0.0] |
| 1.3 personal risk factor list v general information | 1 | 413 | Odds Ratio (M‐H, Fixed, 95% CI) | 2.56 [1.70, 3.84] |