Intrauterine Insemination bei ungeklärter verminderter Fruchtbarkeit (Subfertilität)
Abstract
Background
Intra‐uterine insemination (IUI) is a widely used fertility treatment for couples with unexplained subfertility. Although IUI is less invasive and less expensive thAppendixan in vitro fertilisation (IVF), the safety of IUI in combination with ovarian hyperstimulation (OH) is debated. The main concern about IUI treatment with OH is the increase in multiple pregnancy rate. This is an update of a Cochrane review (Veltman‐Verhulst 2012) originally published in 2006 and updated in 2012.
Objectives
To determine whether, for couples with unexplained subfertility, IUI improves the live birth rate compared with timed intercourse (TI), or expectant management, both with and without ovarian hyperstimulation (OH).
Search methods
We searched the Cochrane Gynaecology and Fertility (formerly Cochrane Menstrual Disorders and Subfertility Group) Trials Register, the Cochrane Central Register of Controlled Trials (CENTRAL) (The Cochrane Library, inception to Issue 11, 2015), Ovid MEDLINE, Ovid EMBASE, PsycINFO and trial registers, all from inception to December 2015 and reference lists of articles. Authors of identified studies were contacted for missing or unpublished data. The evidence is current to December 2015.
Selection criteria
Truly randomised controlled trial (RCT) comparisons of IUI versus TI, in natural or stimulated cycles. Only couples with unexplained subfertility were included.
Data collection and analysis
Two review authors independently performed study selection, quality assessment and data extraction. We extracted outcomes, and pooled data and, where possible, we carried out subgroup and sensitivity analyses.
Main results
We included 14 trials including 1867 women.
IUI versus TI or expectant management both in natural cycle
Live birth rate (all cycles)
There was no evidence of a difference in cumulative live births between the two groups (Odds Ratio (OR) 1.60, 95% confidence interval (CI) 0.92 to 2.78; 1 RCT; n = 334; moderate quality evidence). The evidence suggested that if the chance of a live birth in TI was assumed to be 16%, that of IUI would be between 15% and 34%.
Multiple pregnancy rate
There was no evidence of a difference in multiple pregnancy rate between the two treatment groups (OR 0.50, 95% CI 0.04 to 5.53; 1 RCT; n = 334; moderate quality evidence).
IUI versus TI or expectant management both in stimulated cycle
Live birth rate (all cycles)
There was no evidence of a difference between the two treatment groups (OR 1.59, 95% CI 0.88 to 2.88; 2 RCTs; n = 208; I2 = 72%; moderate quality evidence). The evidence suggested that if the chance of achieving a live birth in TI was assumed to be 26%, the chance of a live birth with IUI would be between 23% and 50%.
Multiple pregnancy rate
There was no evidence of a difference in multiple pregnancy rates between the two treatment groups (OR 1.46, 95% CI 0.55 to 3.87; 4 RCTs, n = 316; I2 = 0%; low quality evidence).
IUI in a natural cycle versus IUI in a stimulated cycle
Live birth rate (all cycles)
An increase in live birth rate was found for women who were treated with IUI in a stimulated cycle compared with those who underwent IUI in natural cycle (OR 0.48, 95% CI 0.29 to 0.82; 4 RCTs, n = 396; I2 = 0%; moderate quality evidence). The evidence suggested that if the chance of a live birth in IUI in a stimulated cycle was assumed to be 25%, the chance of a live birth in IUI in a natural cycle would be between 9% and 21%.
Multiple pregnancy rate
There was no evidence of a difference in multiple pregnancy rate between the two treatment groups (OR 0.33, 95% CI 0.01 to 8.70; 2 RCTs; n = 65; low quality evidence).
IUI in a stimulated cycle versus TI or expectant management in a natural cycle
Live birth rate (all cycles)
There was no evidence of a difference in live birth rate between the two treatment groups (OR 0.82, 95% CI 0.45 to 1.49; 1 RCT; n = 253; moderate quality evidence). The evidence suggested that if the chance of a live birth in TI or expectant management in a natural cycle was assumed to be 24%, the chance of a live birth in IUI in a stimulated cycle would be between 12% and 32%.
Multiple pregnancy rate
There was no evidence of a difference in multiple pregnancy rate between the two treatment groups (OR 2.00, 95% CI 0.18 to 22.34; 2 RCTs; n = 304; moderate quality evidence).
IUI in natural cycle versus TI or expectant management in stimulated cycle
Live birth rate (all cycles)
There was evidence of an increase in live births for IUI (OR 1.95, 95% CI 1.10 to 3.44; 1 RCT, n = 342; moderate quality evidence). The evidence suggested that if the chance of a live birth in TI in a stimulated cycle was assumed to be 13%, the chance of a live birth in IUI in a natural cycle would be between 14% and 34%.
Multiple pregnancy rate
There was no evidence of a difference in multiple pregnancy rate between the groups (OR 1.05, 95% CI 0.07 to 16.90; 1 RCT; n = 342; moderate quality evidence).
The quality of the evidence was assessed using GRADE methods. Quality ranged from low to moderate, the main limitation being imprecision in the findings for both live birth and multiple pregnancy..
Authors' conclusions
This systematic review did not find conclusive evidence of a difference in live birth or multiple pregnancy in most of the comparisons for couples with unexplained subfertility treated with intra‐uterine insemination (IUI) when compared with timed intercourse (TI), both with and without ovarian hyperstimulation (OH). There were insufficient studies to allow for pooling of data on the important outcome measures for each of the comparisons.
PICO
Laienverständliche Zusammenfassung
Intrauterine Insemination bei ungeklärter verminderter Fruchtbarkeit (Subfertilität)
Fragestellung
Kann durch intrauterine Insemination (IUI) (mit oder ohne Einnahme fruchtbarkeitsfördernder Medikamente) die Lebendgeburtenrate bei Paaren mit ungeklärter Subfertilität gesteigert werden im Vergleich zu auf Befruchtung ausgerichteten Geschlechtsverkehr oder die Therapieform des Abwartens und Beobachtens?
Hintergrund
IUI ist eine Behandlung, die bei Paaren mit ungeklärter Subfertilität häufig zum Einsatz kommt. In einem IUI‐Zyklus wird das Sperma des Mannes aufbereitet und zum Zeitpunkt des Eisprungs direkt in die Gebärmutterhöhle (Uterus) eingebracht. In Kombination mit IUI‐Zyklen können fruchtbarkeitsfördernde Medikamente angewandt werden, um die Eierstöcke zu stimulieren und die Anzahl der verfügbaren Eier zu steigern. Diese Medikamente können jedoch unerwünschte Wirkungen haben und das Risiko für Mehrlingsschwangerschaften erhöhen. Die Therapieformen des Abwartens und Beobachtens und des auf Befruchtung ausgerichteten Geschlechtsverkehrs haben ebenfalls nachweislich zu hohen Schwangerschaftsquoten mit anschließender Lebendgeburt geführt. Mit diesem Review wollen wir die Entscheidungsfindung zur Wahl einer Behandlungsform für Paare mit ungeklärter Subfertilität verbessern.
Studienmerkmale
Die Cochrane‐Autoren schlossen 14 randomisierte kontrollierte Studien (mit 1867 Frauen) in diesen Review ein, in denen Frauen mit ungeklärter Subfertilität verglichen wurden, die sich einer Fruchtbarkeitsbehandlung mit IUI unterzogen, in Kombination mit oder ohne die Einnahme von Medikamenten zur Eierstockstimulation. Frauen, die sich einer IUI unterzogen, wurden mit Frauen verglichen, die Medikamente zur Eierstockstimulation einnahmen in Kombination mit auf Befruchtung ausgerichteten Geschlechtsverkehr oder mit Paaren, die per Zufallsprinzip mit der Therapieform des Abwartens und Beobachtens behandelt wurden. Hauptsächlich wurde der Endpunkt der Lebendgeburtenrate betrachtet, doch auch die Schwangerschaftsrate, die Fehlgeburtenhäufigkeit und weitere unerwünschte Wirkungen waren Gegenstand der Untersuchung. Die Evidenz ist auf dem Stand von Dezember 2015.
Hauptergebnisse
Es gab keine eindeutige Evidenz zu Unterschieden zwischen den meisten Behandlungsgruppen in Bezug auf die Gesamt‐Lebendgeburtenraten (d.h. die Raten zum Ende des Behandlungsverlaufs), die Mehrlingsschwangerschaftsraten und weitere unerwünschte Wirkungen bei Paaren mit ungeklärter Subfertilität, die sich einer intrauterinen Insemination (IUI) unterzogen im Vergleich zu auf Befruchtung ausgerichteten Geschlechtsverkehr (TI, Englisch: timed intercourse), in Kombination mit oder ohne eine Hyperstimulation der Eierstöcke (OH, ovarielle Hyperstimulation).
Qualität der Evidenz
Die Evidenz war in Bezug auf die Lebendgeburten von moderater Qualität und bezüglich der Mehrlingsschwangerschaften von niedriger bis moderater Qualität. Einschränkungen der Evidenz lagen im Wesentlichen durch mangelnde Präzision in den Ergebnissen vor, sowohl bezüglich der Lebendgeburten als auch der Mehrlingsschwangerschaften.
Authors' conclusions
Summary of findings
| IUI compared to TI or expectant management both in natural cycle for unexplained subfertility | ||||||
| Patient or population: people with unexplained subfertility | ||||||
| Outcomes | Illustrative comparative risks* (95% CI) | Relative effect | No of Participants | Quality of the evidence | Comments | |
| Assumed risk | Corresponding risk | |||||
| TI or expectant management both in natural cycle | IUI | |||||
| Live birth rate per couple (all cycles) | 156 per 1000 | 228 per 1000 | OR 1.60 | 334 | ⊕⊕⊕⊝ | |
| Multiple pregnancy rate per couple | 12 per 1000 | 6 per 1000 | OR 0.50 | 334 | ⊕⊕⊕⊝ | |
| Pregnancy rate per couple (all cycles) | 162 per 1000 | 228 per 1000 | OR 1.53 | 334 | ⊕⊕⊕⊝ | |
| Ovarian Hyperstimulation Syndrome rate per woman ‐ not reported | Not estimable | ‐ | ||||
| Miscarriage rate per couple | 54 per 1000 | 42 per 1000 | OR 0.77 | 334 | ⊕⊕⊕⊝ | |
| Ectopic pregnancy rate per couple | Not estimable | OR 5.06 | 334 | ⊕⊕⊕⊝ | ||
| *The basis for the assumed risk is the median control group risk across studies. The corresponding risk (and its 95% confidence interval) is based on the assumed risk in the comparison group and the relative effect of the intervention (and its 95% CI). | ||||||
| GRADE Working Group grades of evidence | ||||||
| 1 Small sample size | ||||||
| IUI compared to TI or expectant management both in stimulated cycle for unexplained subfertility | ||||||
| Patient or population: people with unexplained subfertility | ||||||
| Outcomes | Illustrative comparative risks* (95% CI) | Relative effect | No of Participants | Quality of the evidence | Comments | |
| Assumed risk | Corresponding risk | |||||
| TI both in stimulated cycle | IUI | |||||
| Live birth rate per couple (all cycles) | 255 per 1000 | 352 per 1000 | OR 1.59 | 208 | ⊕⊕⊕⊝ | |
| Multiple pregnancy rate per couple | 43 per 1000 | 62 per 1000 | OR 1.46 | 316 | ⊕⊕⊝⊝ | |
| Pregnancy rate per couple (all cycles) | 234 per 1000 | 339 per 1000 | OR 1.69 | 517 | ⊕⊕⊝⊝ | |
| Ovarian Hyperstimulation Syndrome rate per woman | not estimable | OR 2.75 | 68 | ⊕⊕⊝⊝ | ||
| Miscarriage rate per couple | 57 per 1000 | 91 per 1000 | OR 1.66 | 208 | ⊕⊕⊕⊝ | |
| Ectopic pregnancy rate per couple | not estimable | OR 3.06 | 100 | ⊕⊕⊕⊝ | ||
| *The basis for the assumed risk is the median control group risk across studies. The corresponding risk (and its 95% confidence interval) is based on the assumed risk in the comparison group and the relative effect of the intervention (and its 95% CI). | ||||||
| GRADE Working Group grades of evidence | ||||||
| 1 Small sample size | ||||||
| IUI in natural cycle compared to IUI in stimulated cycle for unexplained subfertility | ||||||
| Patient or population: people with unexplained subfertility | ||||||
| Outcomes | Illustrative comparative risks* (95% CI) | Relative effect | No of Participants | Quality of the evidence | Comments | |
| Assumed risk | Corresponding risk | |||||
| IUI in stimulated cycle | IUI in natural cycle | |||||
| Live birth rate per couple (all cycles) | 248 per 1000 | 137 per 1000 | OR 0.48 | 396 | ⊕⊕⊕⊝ | |
| Multiple pregnancy rate per couple | 33 per 1000 | 11 per 1000 | OR 0.33 | 65 | ⊕⊕⊝⊝ | |
| Pregnancy rate per couple (all cycles) | 300 per 1000 | 64 per 1000 | OR 0.16 | 26 | ⊕⊕⊕⊝ | |
| Ovarian Hyperstimulation Syndrome rate per woman5 ‐ not measured | Not estimable3 | ‐ | ||||
| Miscarriage rate per couple | 100 per 1000 | 21 per 1000 | OR 0.19 | 26 | ⊕⊕⊝⊝ | |
| Ectopic pregnancy rate per couple | 23 per 1000 | 4 per 1000 | OR 0.15 | 250 | ⊕⊕⊕⊝ | |
| *The basis for the assumed risk is the median control group risk across studies. The corresponding risk (and its 95% confidence interval) is based on the assumed risk in the comparison group and the relative effect of the intervention (and its 95% CI). | ||||||
| GRADE Working Group grades of evidence | ||||||
| 1 Small sample size | ||||||
| IUI in stimulated cycle compared to TI or expectant management in natural cycle for unexplained subfertility | ||||||
| Patient or population: people with unexplained subfertility | ||||||
| Outcomes | Illustrative comparative risks* (95% CI) | Relative effect | No of Participants | Quality of the evidence | Comments | |
| Assumed risk | Corresponding risk | |||||
| TI or expectant management in natural cycle | IUI in stimulated cycle | |||||
| Live birth rate per couple (all cycles) | 238 per 1000 | 204 per 1000 | OR 0.82 | 253 | ⊕⊕⊕⊝ | |
| Multiple pregnancy rate per couple | 6 per 1000 | 13 per 1000 | OR 2.00 | 304 | ⊕⊕⊕⊝ | |
| Pregnancy rate per couple (all cycles) | 247 per 1000 | 247 per 1000 | OR 1.00 | 304 | ⊕⊕⊕⊝ | |
| Ovarian Hyperstimulation rate per woman ‐ not measured | Not estimable | ‐ | ||||
| Miscarriage rate per couple | 48 per 1000 | 103 per 1000 | OR 2.28 | 253 | ⊕⊕⊕⊝ | |
| Ectopic pregnancy rate per couple ‐ not reported | See comment | See comment | Not estimable | ‐ | See comment | |
| *The basis for the assumed risk is the median control group risk across studies. The corresponding risk (and its 95% confidence interval) is based on the assumed risk in the comparison group and the relative effect of the intervention (and its 95% CI). | ||||||
| GRADE Working Group grades of evidence | ||||||
| 1 Small sample size | ||||||
| IUI in natural cycle compared to TI or expectant management in stimulated cycle for unexplained subfertility | ||||||
| Patient or population: people with unexplained subfertility | ||||||
| Outcomes | Illustrative comparative risks* (95% CI) | Relative effect | No of Participants | Quality of the evidence | Comments | |
| Assumed risk | Corresponding risk | |||||
| TI in stimulated cycle | IUI in natural cycle | |||||
| Live birth rate per couple (all cycles) | 131 per 1000 | 227 per 1000 | OR 1.95 | 342 | ⊕⊕⊕⊝ | |
| Multiple pregnancy rate per couple | 6 per 1000 | 6 per 1000 | OR 1.05 | 342 | ⊕⊕⊕⊝ | |
| Pregnancy rate per couple (all cycles) | 143 per 1000 | 228 per 1000 | OR 1.77 | 342 | ⊕⊕⊕⊝ | |
| Ovarian Hyperstimulation Syndrome rate per woman ‐ not reported | Not estimable | ‐ | ||||
| Miscarriage rate per couple | 46 per 1000 | 42 per 1000 | OR 0.91 | 342 | ⊕⊕⊕⊝ | |
| Ectopic pregnancy rate per couple | Not estimable | OR 5.30 | 342 | ⊕⊕⊕⊝ | ||
| *The basis for the assumed risk is the median control group risk across studies. The corresponding risk (and its 95% confidence interval) is based on the assumed risk in the comparison group and the relative effect of the intervention (and its 95% CI). | ||||||
| GRADE Working Group grades of evidence | ||||||
| 1 Small sample size | ||||||
Background
Description of the condition
Of all couples presenting with fertility problems about 25% have no cause that can be identified (NICE 2013). Couples are classified as having unexplained subfertility when they have tried to conceive for at least one year and the fertility work‐up showed patent fallopian tubes, an ovulatory menstrual cycle and a normal semen analysis.
Description of the intervention
Intra‐uterine insemination (IUI) is a commonly‐used treatment in couples with unexplained subfertility. IUI is a relatively simple procedure in which semen is 'washed' in the laboratory and inserted in the uterine cavity using a small catheter at the time of ovulation. IUI can be performed with or without drugs for ovarian hyperstimulation (OH). For correct timing of the insemination, cycle monitoring is performed. This is usually done by ultrasound assessment of follicle growth or by monitoring the preovulatory luteinizing hormone rise in blood or urine. In hyperstimulated cycles ovulation is often induced by an injection of human chorionic gonadotropin (hCG), which improves timing possibilities. In contrast to the IUI procedure, with expectant management, couples either receive cycle monitoring for correct timing of sexual intercourse, for example timed intercourse (TI), or no intervention at all.
How the intervention might work
The rationale for performing IUI is that the motile spermatozoa, which are morphologically normal, can be concentrated in a small volume and placed directly into the uterus close to the released oocyte. In this way the cervix, which also acts as a reservoir for sperm, is bypassed. Accurate timing of the insemination is therefore of great importance. IUI can be performed with or without ovarian hyperstimulation (OH). The two most commonly used drugs for ovarian hyperstimulation are clomiphene citrate (CC), which is an oral treatment, and gonadotropins administered by subcutaneous injection. The aim of OH is to increase the number of oocytes available for fertilisation and to enhance accurate timing.
The role of IUI in fertility treatment is often debated, in particular in terms of whether or not it is superior to TI and whether or not OH should be used at the same time (Cohlen 2005; Hughes 2003; Stewart 2003).
The use of OH in fertility treatment for unexplained subfertility has been both supported and criticised. When Hughes published a meta‐analysis indicating that the average fecundability is approximately five‐fold higher for treatment with IUI and OH (Hughes 1997), the Royal College of Obstetricians and Gynaecologists (RCOG 1998) concluded accordingly that "OH with IUI is an effective treatment for couples with unexplained infertility". However, major concerns about the incidence of multiple pregnancies were raised and OH became less popular. These concerns have resulted in an adjustment of the advice for treatment of couples with unexplained subfertility. The NICE fertility guideline states that "ovarian hyperstimulation should not be offered to women with unexplained subfertility" (NICE 2013).
It is usually difficult to target treatment especially when there is no known reason why women are not getting pregnant. The rationale for treatment with OH is to increase the number of mature follicles and trigger ovulation to facilitate optimum timing of IUI. It may also correct subtle abnormalities in follicular maturation and fertilisation and may improve the endometrial quality (Guzick 1998). However, Steures 2006a shows that for couples with unexplained subfertility and an intermediate prognosis there are no large beneficial effects of treatment with IUI and OH.
The increase of multiple pregnancies is a logical consequence of stimulated growth of multiple follicles. The incidence of multiple pregnancies after treatment with OH and IUI varies between 10% and 40%, and the overall contribution of this treatment to multiple births is estimated to be around 30% (Fauser 2005). The question is whether this multiple pregnancy rate is acceptable or whether it can be reduced to acceptable numbers. Recently, more and more evidence has been collected showing that mild ovarian hyperstimulation with strict cancellation criteria reduces the risk of achieving multiple pregnancies to approximately 10%, without compromising pregnancy rates (ESHRE 2006; Ragni 2006; Rumste 2006; Steures 2006b). Because maternal and neonatal morbidity and mortality rates are significantly increased in multiple pregnancies (Fauser 2005; Ombelet 2005), caregivers should take extra care to keep the multiple pregnancy rate to a minimum. Couples should be well informed by their physicians, especially as many couples desire to conceive twins (Ryan 2004) and prefer a higher pregnancy chance over safety.
Some authors state that treatment with OH results in an unacceptably high incidence of high‐order multiple pregnancies (Gleicher 2000; Nan 1994) and treatment with IUI in natural cycles should be preferred (Fauser 2005; Goverde 2005). Others say that the risk of a multiple pregnancy could be reduced with strict monitoring of the people undergoing treatment (Dickey 2005; Tur 2005). Te Velde 1999 concluded that IUI with OH is an appropriate treatment option if done with a mild stimulation protocol, careful cycle monitoring and with strict cancellation criteria. It is, however, still not known to what extent multiple pregnancies can be avoided if these criteria are met. Besides, the use of strict cycle cancellation criteria might result in a reduced overall pregnancy rate. Several trials using mild stimulation protocols for IUI have been published, showing promising results of acceptable pregnancy rates with very low multiple pregnancy rates (Balasch 2004). As IVF allows better control over reducing the risk of a multiple pregnancy (Gleicher 2000), and IVF with single embryo transfer is more and more accepted, it has been argued that IVF is a safer treatment option than IUI with OH. However a large RCT, Bensdorp 2015, showed low multiple pregnancy rates and comparable live birth rates in the IUI with OH group when compared to women undergoing IVF with single embryo transfer. Additionally, Goverde 2000 found IUI to be a more cost‐effective treatment than IVF for couples with unexplained or male subfertility.
Why it is important to do this review
The first randomised controlled trial (RCT) of IUI for male factor infertility was published in 1984 and reported a favourable outcome for IUI compared with TI (Kerin 1984). Since then many trials have studied the efficacy of IUI for unexplained subfertility, with variable results. Subsequent RCTs have compared IUI with TI, with or without OH, and suggested a benefit of OH in combination with IUI (Hughes 1997). Goverde 2000 reported that mild ovarian hyperstimulation of IUI cycles did not yield higher pregnancy rates, though IUI is more cost‐effective compared with in vitro fertilisation (IVF). Others stated that IUI alone is not efficacious, without some form of ovarian hyperstimulation (Bhattacharya 2008; Guzick 1998). Some studies suggested that both OH and IUI independently contributed to increased pregnancy rates (Aboulghar 2003; Hughes 1997). A meta‐analysis of seven studies showed a significantly higher pregnancy rate for treatment with gonadotropins (28%) compared to treatment with CC (19%) when combined with IUI (Cantineau 2007).
Although ovarian hyperstimulation seems to result in higher pregnancy rates it also increases the incidence of multiple pregnancy and ovarian hyperstimulation syndrome (OHSS). These pose serious risks to the health of both mother and baby (Fauser 2005; Gleicher 2000; Nan 1994). The NICE fertility guidelines recommend IUI without OH for couples with unexplained subfertility because of the increased risk of multiple pregnancies and OHSS associated with OH (NICE 2013). This systematic review was therefore undertaken to assess the evidence on the benefits and side effects of IUI with or without OH, compared to timed intercourse, for couples with unexplained subfertility.
Objectives
To determine whether for couples with unexplained subfertility IUI improves the live birth rate compared with timed intercourse (TI) or expectant management, both with and without ovarian hyperstimulation (OH).
Methods
Criteria for considering studies for this review
Types of studies
Published and unpublished randomised controlled trials (RCTs) were eligible for inclusion. We excluded non‐randomised studies (e.g. studies with evidence of inadequate sequence generation such as alternate days, patient numbers) as they are associated with a high risk of bias. We attempted to contact the author of the study if the randomisation or allocation method was unclear.
Trials that did not report separate data for women with unexplained subfertility and where such data were not obtainable from the authors were excluded. We assessed the trial design (crossover or parallel) and included crossover trials if pre‐crossover data could be extracted.
Types of participants
-
Couples with unexplained subfertility, defined as follows.
-
Normal ovulatory status (determined by either biphasic basal body temperature chart, normal luteal progesterone, in phase endometrial biopsy or ovulation detected with ultrasound).
-
Tubal patency (determined by hysterosalpingography or laparoscopy, or both).
-
A normal semen sample according to World Health Organization (WHO) criteria current at the time of trial.
-
Sperm concentration of at least 20 x 106 per ml:
-
total motility of at least 50%,
-
normal morphology of at least 30% (WHO 1987, at least 50%) or Kruger criteria,
-
no anti‐sperm antibodies.
-
-
-
Couples who had tried to conceive for at least one year. Participants excluded were:
-
couples with a known cause of infertility including a moderate male factor, moderate to severe endometriosis (according to the American Society for Reproductive Medicine (ASRM) classification), tubal disease and a cervical factor.
-
We contacted study authors to obtain data of couples with unexplained infertility if groups of mixed infertility causes were studied. If relevant data could not be extracted separately for included participants, we excluded the study.
We excluded trials that included participants with mild to moderate endometriosis only.
Types of interventions
Trials with at least one of the following comparisons:
-
intra‐uterine insemination (IUI) versus timed intercourse (TI), or expectant management both in a natural cycle;
-
IUI versus TI, or expectant management both in a stimulated cycle;
-
IUI in a natural cycle versus IUI in a stimulated cycle;
-
IUI in a stimulated cycle versus TI or expectant management in a natural cycle;
-
IUI in a natural cycle versus TI or expectant management in a stimulated cycle.
Ovarian hyperstimulation (OH) was achieved with either clomiphene citrate or gonadotropins.
We included expectant management as a variant of timed intercourse.
Interventions excluded:
-
intra‐cervical insemination, because we consider this to be a different treatment modality (Ripps 1994) and it is the topic of another review (Besselink 2008);
-
donor insemination.
Types of outcome measures
Primary outcomes
1. Live birth rate per couple: (a) all cycles, (b) after one cycle treatment (subgroup). Live birth is defined as delivery of a live foetus after twenty completed weeks of gestational age
2. Multiple pregnancy rate per couple. Multiple pregnancies confirmed by ultrasound, with or without selective reduction, were recorded.
Secondary outcomes
3. Pregnancy rate per couple: (a) all cycles, (b) after one cycle treatment. Pregnancy includes clinical pregnancy, defined by the presence of an intra‐uterine gestational sac or foetal heartbeat visualised by an ultrasound scan before 12 weeks, and/or ongoing pregnancy, defined as a pregnancy extending beyond 12 weeks of gestation, confirmed by ultrasound or delivery
Other adverse events:
4. Moderate or severe ovarian hyperstimulation syndrome (OHSS), rate per woman;
5. Miscarriage rate per couple;
6. Ectopic pregnancy rate per couple.
We excluded pregnancies confirmed only by detection of hCG in serum or urine (biochemical pregnancies). When pregnancy was not further defined, and remained unclear even after contacting the authors, we assumed the pregnancy to be clinical.
We used an intention‐to‐treat (ITT) analysis whenever possible. We assumed that women who dropped out or were excluded after randomisation were not pregnant. Women who were excluded because they conceived before receiving treatment were included as a success in the allocated group in the ITT analysis.
Search methods for identification of studies
We searched for all reports which describe (or might describe) randomised controlled trials of IUI with or without OH. The original search was performed in 2005 and the search was last updated in December 2015. We used the search strategy developed by Cochrane Gynaecology and Fertility (see Review Group details in the Cochrane Library for more information).
Electronic searches
We searched the:
-
Cochrane Gynaecology and Fertility (formerly the Cochrane Menstrual Disorders and Subfertility Group) Specialised Register (searched from inception to December 2015) (Appendix 1),
-
Cochrane Central Register of Controlled Trials (CENTRAL) (The Cochrane Library inception to 2015, Issue 11) (Appendix 2),
-
Ovid MEDLINE (1966 to December 2015) (Appendix 3),
-
Ovid EMBASE (1980 to December 2015) (Appendix 4),
-
PsycINFO (1806 to December 2015) (Appendix 5).
The MEDLINE search was combined with the Cochrane highly sensitive search strategy for identifying randomised trials in MEDLINE: sensitivity‐ and precision‐maximising version (2008 revision; Lefebvre 2011). The EMBASE and PsycINFO searches were combined with trial filters developed by the Scottish Intercollegiate Guidelines Network (SIGN) http://www.sign.ac.uk/methodology/filters.html#random.
Other electronic sources of trials included:
-
trial registers for ongoing and registered trials (up to December 2015),
-
http://www.clinicaltrials.gov (a service of the US National Institutes of Health),
-
http://www.who.int/trialsearch/Default.aspx (The World Health Organization International Trials Registry Platform search portal) Note: it is now mandatory for Cochrane reviews to include searches of trial registers;
-
-
DARE (Database of Abstracts of Reviews of Effects) in The Cochrane Library at http://onlinelibrary.wiley.com/o/cochrane/cochrane_cldare_articles_fs.html (for reference lists from relevant non‐Cochrane reviews) (up to December 2015);
-
the Web of Knowledge http://wokinfo.com/ (another source of trials and conference abstracts) (up to December 2015);
-
OpenGrey ‐ http://www.opengrey.eu/ for unpublished literature from Europe (up to December 2015);
-
LILACS database http://regional.bvsalud.org/php/index.php?lang=en (for trials from the Portuguese and Spanish speaking world) (up to December 2015);
-
PubMed and Google Scholar (for recent trials not yet indexed in MEDLINE) (up to December 2015).
Searching other resources
We handsearched reference lists of articles retrieved by the search and contacted experts in the field to obtain additional data. We also handsearched relevant journals and conference abstracts that were not covered in the Cochrane Gynaecology and Fertility register, in liaison with the Trials Search Co‐ordinator.
Data collection and analysis
Selection of studies
After an initial screening of titles and abstracts retrieved by the search, we retrieved the full texts of all potentially eligible studies. Two review authors (SMV and ROA) independently examined these full‐text articles for compliance with the inclusion criteria and selected studies eligible for inclusion in the 2015 update. We contacted study investigators as required, to clarify study eligibility. We resolved any disagreements as to study eligibility by discussion. We documented the selection process with a “PRISMA” flow chart (Liberati 2009).
Data extraction and management
Two review authors (SMV and ROA) independently extracted data from eligible studies using a data extraction form designed and pilot‐tested by the review authors. We resolved any disagreements by discussion. Data extracted included study characteristics and outcome data. Where studies had multiple publications the authors collated multiple reports of the same study, so that each study, rather than each report, was the unit of interest in the review, and such studies had a single study ID with multiple references. We contacted study investigators for further data on methods or results, or both, as required.
Assessment of risk of bias in included studies
Two review authors (SMV and ROA) independently assessed the included studies for risk of bias using the Cochrane risk of bias assessment tool (Higgins 2011) to assess: selection bias (random sequence generation and allocation concealment); performance bias (blinding of participants and personnel); detection bias (blinding of outcome assessors); attrition bias (incomplete outcome data); reporting bias (selective reporting); and other bias. We resolved disagreements by discussion or by involving a third review author. We described all judgements fully in the 'Risk of bias' table for each included study and incorporated our judgements into the interpretation of the review findings. These details were summarised and presented in Figure 1 and Figure 2.

Methodological quality graph: review authors' judgements about each methodological quality item presented as percentages across all included studies.
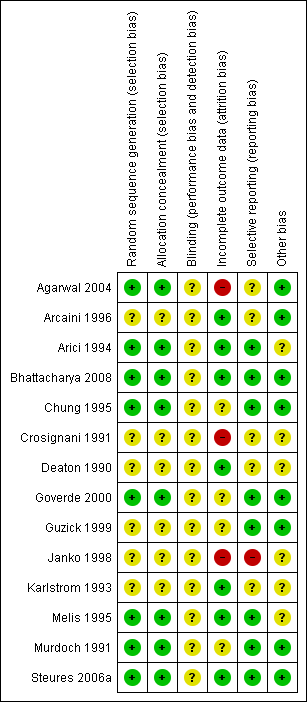
Methodological quality summary: review authors' judgements about each methodological quality item for each included study.
Measures of treatment effect
Only dichotomous data were reported in this review and we used the numbers of events in the control and intervention groups of each study to calculate Mantel‐Haenszel odds ratios (OR). We reversed the direction of effect of individual studies, where required, to ensure consistency across trials. We presented 95% confidence intervals (CI) for all outcomes. We assessed whether the estimates calculated in the review for individual studies were compatible in each case with the estimates reported in the study publications.
Unit of analysis issues
We analysed data per randomised couple or woman, because per‐treatment‐cycle data may lead to biased results (Dias 2008). In the case of a crossover trial, we only analysed data prior to crossover. For studies where data did not allow analysis (e.g. per‐cycle data) we contacted study authors for per‐woman data. Where appropriate data were not obtained after contact with authors, we excluded such data (per‐cycle) from meta‐analyses. Multiple live births (e.g. twins or triplets) were counted as one live birth event.
Dealing with missing data
We analysed the data on an intention‐to‐treat basis as far as possible. In the case of missing data we contacted authors of the published trials and included the newly obtained data in the analysis. However, where the study authors did not provide additional data, we assumed that no live births occurred in participants without a reported outcome. For other outcomes, we analysed only the available data.
Assessment of heterogeneity
We considered whether the clinical and methodological characteristics of the included studies were sufficiently similar for meta‐analysis to provide a clinically meaningful summary. We assessed statistical heterogeneity using the I2 statistic (Higgins 2003). An I2 statistic measurement greater than 50% was taken to indicate substantial heterogeneity.
Assessment of reporting biases
In view of the difficulty of detecting and correcting for publication bias and other reporting biases, we minimised their potential impact by ensuring a comprehensive search for eligible studies and by being alert for duplication of data. Where there were multiple studies in an analysis, we used a funnel plot to explore the possibility of small study effects (a tendency for estimates of the intervention effect to be more beneficial in smaller studies) (Sterne 2011).
Data synthesis
Where the studies were sufficiently similar, we combined the data using a fixed‐effect model in the following comparisons:
-
intra‐uterine insemination (IUI) versus timed intercourse (TI), both in a natural cycle;
-
IUI versus TI, both in a stimulated cycle;
-
IUI in a natural cycle versus IUI in a stimulated cycle;
-
IUI in a stimulated cycle versus TI in a natural cycle;
-
IUI in a natural cycle versus TI in a stimulated cycle.
An increase in the odds of a particular outcome, which may be beneficial (e.g. live birth) or detrimental (e.g. adverse effects), was displayed graphically in the meta‐analyses to the right of the centre‐line and a decrease in the odds of an outcome, to the left of the centre‐line.
When pre‐crossover data were available, crossover trials were included in the analysis and pooled with parallel trials. Stratification for number of treatment cycles was done by analysing the first cycle, one to three cycles and more than three cycles separately, where possible.
Subgroup analysis and investigation of heterogeneity
Where data were available we planned to conduct a subgroup analysis to determine the separate evidence with regard to the number of treatment cycles for live birth and pregnancy, and methods of ovarian hyperstimulation but this could not be undertaken for most of the comparisons due to non‐availability of data.
Where applicable we assessed heterogeneity using the I2 statistic. We considered an I2 value of greater than 50% as substantial heterogeneity (Deeks 2011). In the case of statistical heterogeneity the original trials were studied for clinical heterogeneity.
Sensitivity analysis
Specific items that we explored were as follows:
-
trials with adequate methodology versus those with poor methodology, where adequate methodology was defined as an adequate randomisation method, adequate allocation concealment, analysis by intention‐to‐treat and losses to follow up of less than 20%;
-
trials which might differ from others with respect to their participants, interventions or clinical criteria for defining outcomes.
Overall quality of the body of evidence: 'Summary of findings' table
We prepared 'Summary of findings' tables using GRADEpro software (GRADEpro GDT 2015). These tables evaluated the overall quality of the body of evidence for the review outcomes (live birth rate, multiple pregnancy rate, pregnancy rate, OHSS, miscarriage and ectopic pregnancy), using GRADE criteria (study limitations (i.e. risk of bias), consistency of effect, imprecision, indirectness and publication bias) (Schünemann 2011). Judgements about evidence quality (high, moderate or low) were justified, documented, and incorporated into reporting of results for each outcome.
Results
Description of studies
Results of the search
For the 2015 update:
The searches identified 424 records after removal of duplicates. We retrieved 12 potentially eligible full‐text articles. All were found to be ineligible for inclusion. One study previously awaiting classification, Wordsworth 2011a, did not have relevant data for inclusion and has been listed as a secondary reference to Bhattacharya 2008. See Figure 3 for details of the screening and selection process.
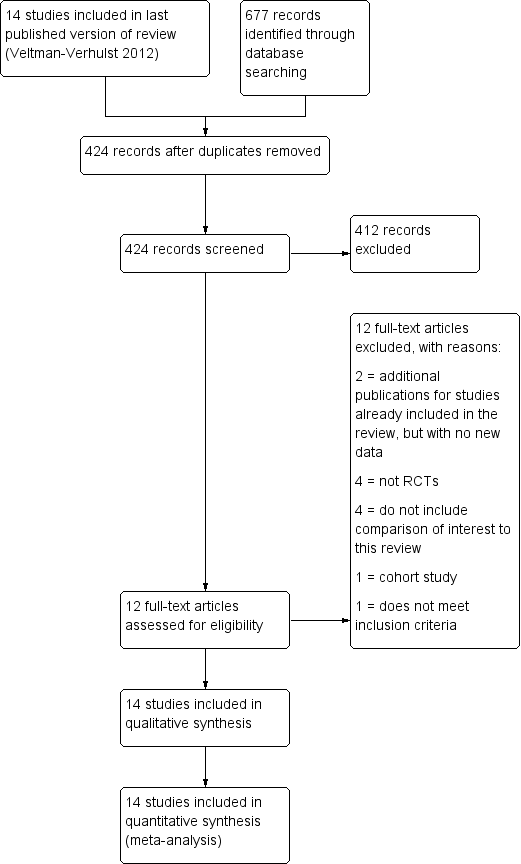
Study flow diagram.
For previous versions of this review:
The initial database searches found over 700 articles. Of these, 198 were related to the subject. Their abstracts were searched by hand. This resulted in the selection of 25 trials reporting one or more of the comparisons of interest. A search performed in August 2010 retrieved two additional RCTs with a comparison of interest. The search was updated in July 2011 and one further article was retrieved (Wordsworth 2011a) which related to one of the included studies (Bhattacharya 2008) (see above). A total of 14 studies (19 articles were included in the review).
We attempted to contact all study authors to retrieve unpublished details and received 15 replies. Three replies resulted in the exclusion of the trials Nulsen 1993, Prentice 1995 and Serhal 1988. Seven study authors (Agarwal 2004; Arici 1994; Bhattacharya 2008; Guzick 1999; Melis 1995; Murdoch 1991; Steures 2006a) provided unpublished information or data, which were used in this analysis. Some authors could not provide us with the requested data. Others never returned the form.
Included studies
Design
A total of 14 RCTs were included. All trials were published in journals (Janko 1998 was published as an abstract only) and were available in English. The trials were carried out in different countries: USA (Arici 1994; Deaton 1990; Guzick 1999), Italy (Arcaini 1996; Melis 1995), UK (Bhattacharya 2008; Chung 1995; Murdoch 1991), India (Agarwal 2004), the Netherlands (Goverde 2000;Steures 2006a), Slovakia (Janko 1998), Sweden (Karlstrom 1993), and multiple European countries (Crosignani 1991).
Eleven were parallel group studies (Agarwal 2004; Arcaini 1996; Bhattacharya 2008; Chung 1995; Goverde 2000;Guzick 1999; Janko 1998; Karlstrom 1993; Melis 1995; Murdoch 1991; Steures 2006a), and three were crossover studies (Arici 1994; Crosignani 1991; Deaton 1990).
Power calculation
Bhattacharya 2008, Goverde 2000 and Steures 2006a were the only studies in which a power calculation was performed. All three studies reached the targeted inclusion number to obtain enough power (80% to 90% with 5% level of significance) to detect a clinically relevant improvement in live birth rate or pregnancy rate.
Further details about the included trials are provided in the 'Characteristics of included studies' table.
Participants
The 14 trials comprised a total of 1866 women with unexplained subfertility.
The age of the women was mentioned in most trials, as either a mean ± standard deviation (SD) or a median and range. One trial (Janko 1998) did not report the women's age. The overall age reported in the studies was similar. The mean or median age was between 30 years to 33 years (with comparable SDs). The maximum age of the participants was stated in six studies, only one of whom was above the age of 40 years (Arici 1994).
The duration of subfertility was given in 10 trials and reported as a mean duration or range. Five studies only included couples with subfertility for more than at least three years. The overall subfertility duration ranged from one year to 15 years.
Types of subfertility
The definition of unexplained subfertility was similar between studies. Six trials enrolled participants with unexplained subfertility only. Five trials also included participants with male factor subfertility. In these studies the data for unexplained subfertility were either reported separately or obtained from the author. One study selected couples with unexplained subfertility and an intermediate prognosis (Steures 2006a). Four studies reported the inclusion of women with either surgically corrected endometriosis (Deaton 1990), mild or stage II treated endometriosis (Guzick 1999) or minimal/mild endometriosis( Bhattacharya 2008; Karlstrom 1993) which we considered to be unexplained subfertility. Melis 1995 specifically excluded participants if minor disorders such as minimal endometriosis were found in the investigation. Although our protocol stated to only include women with minimal and mild endometriosis we decided to include Deaton 1990 despite the inclusion of three participants (out of 51 participants in total) with moderate endometriosis.
All studies reported a thorough fertility investigation, including a laparoscopy. A semen analysis was performed at least once in all studies. In nine studies the semen quality was reported according to the WHO criteria. Twostudies (Arcaini 1996; Janko 1998) did not specify the criteria for a normal semen analysis. Chung 1995 used a sperm count per ejaculate instead of per ml. The data of Guzick 1999 were based only on a normal sperm count and a normal motility according to Kruger criteria.
Primary or secondary subfertility
Nine trials contained a mixed population of couples who had never achieved a pregnancy (primary subfertility) and those who had previously been pregnant (secondary subfertility). The remaining trials did not give any description for inclusion of people with secondary subfertility.
Previous treatment
Couples who have previously had failed fertility treatment have a lower probability of conception in subsequent treatment attempts. It is, therefore, important in fertility trials to report if couples have undergone previous treatment. Of the 14 included studies only one trial included couples who had previously had unsuccessful fertility treatment (Melis 1995). Five trials did not include previously treated participants (Agarwal 2004; Arici 1994; Guzick 1999; Karlstrom 1993; Murdoch 1991) and the remaining trials did not provide information regarding previous treatment.
Interventions
Number of trials included per comparison
-
IUI versus TI both in a natural cycle: one trial (Bhattacharya 2008). We identified two other studies with this comparison (Kirby 1991; Martinez 1990). We excluded these studies from the analysis because they reported post‐crossover per‐cycle data only.
-
IUI versus TI both in a stimulated cycle: seven trials (Agarwal 2004; Arcaini 1996; Chung 1995; Crosignani 1991; Janko 1998; Karlstrom 1993; Melis 1995).
-
IUI in a natural cycle versus IUI in a stimulated cycle: four trials (Arici 1994; Goverde 2000; Guzick 1999; Murdoch 1991).
-
IUI in a stimulated cycle versus TI in a natural cycle: two trials (Deaton 1990; Steures 2006a).
-
IUI in a natural cycle versus TI in a stimulated cycle: one trial (Bhattacharya 2008).
Martinez 1990 studied all five comparisons, however there were no pre‐crossover data available for couples with unexplained subfertility.
Agarwal 2004, although included in the review, was excluded from the primary analysis. This Indian study had a high dropout percentage (37%) in the treatment group which caused severely unbalanced groups. The main reason for dropout was financial constraints so this introduces a considerable bias. However, we performed a sensitivity analysis including this study.
In the most recent included studies, Bhattacharya 2008 and Steures 2006a, expectant management was performed instead of TI.
Treatment
The treatment methods varied substantially between studies. Seven studies used gonadotropins for ovarian hyperstimulation. Arcaini 1996 offered both gonadotropins and clomiphene citrate, which resulted in a high dose hyperstimulation. Five studies used clomiphene only, and Crosignani 1991 did not report the method of ovarian hyperstimulation. The different fertility centres in this multicentre trial used different treatments. More details on drug dose and method can be found in the prognostic factor table (Table 2) and 'Characteristics of included studies' table. Additional gonadotropin‐releasing hormone agonist (GnRHa) was used by Chung 1995 and Murdoch 1991. All studies used human chorionic gonadotropin (hCG) (5000 to 10,000 IU) for triggering ovulation. Chung also provided hCG in the post‐ovulatory phase.
The timing of IUI was similar among the studies. Follicle development was usually monitored by ultrasound scan (USS) and serum estradiol levels (serum‐E2). The hCG was given when the dominant follicles reached a mean diameter of 16 mm to 18 mm. Insemination was performed 30 hours to 48 hours after hCG administration. Arcaini 1996 performed a double insemination at 24 and 48 hours, and in the trial by Murdoch 1991 insemination took place on alternate days until ovulation was confirmed. Follicular development in natural cycles was monitored by ultrasound or luteinizing hormone (LH) urine tests, and intercourse was advised at 12 hours to 40 hours after the hCG or LH surge. Couples were mostly advised to have intercourse more than once.
In the studies with expectant management instead of TI (Bhattacharya 2008; Steures 2006a), couples were given general advice regarding the need for regular intercourse.
The number of cycles in included studies ranged from one to eight.
Cancellation criteria
The most serious adverse effects of ovarian hyperstimulation are multiple pregnancies and ovarian hyperstimulation syndrome (OHSS). These risks can both be reduced by the cancellation of the treatment cycle if excessive follicle stimulation occurs. It is important that fertility trials report the cancellation criteria they applied. Firstly, to ensure that participants were not exposed to a higher risk of multiple pregnancy or OHSS to increase the pregnancy rate and secondly, to reduce the bias introduced by cancellation of treatment in initially randomised groups.
Ten studies described criteria for cancellation of the treatment cycle. Insemination or hCG administration did not take place if the cancellation criteria were met. Five studies used serum‐E2 levels to determine over‐ or under‐stimulation as well as a maximum of dominant follicles (four follicles of a maximum 16 mm diameter). Arcaini 1996 accepted a maximum of six dominant follicles. Four studies did not describe any cancellation criteria.
Outcomes
Nine trials reported live birth, our primary outcome of interest. The other studies reported pregnancy as the main outcome. Pregnancy was confirmed by ultrasound in nine trials. In Guzick 1999 pregnancy was confirmed by two hCG measurements or live birth. Others did not report the method of pregnancy confirmation. The reported pregnancies were mostly clinical. The multiple pregnancy rate was mentioned in 12 trials, miscarriage in 10, ectopic pregnancy in 10, and OHSS in nine trials. These events were often reported as total numbers or as post‐crossover data and therefore often could not be used in the meta‐analysis.
Excluded studies
For the 2015 update 10 studies were excluded (Aanesen 2014; Check 2013; Barros Delgadillo 2008; Barros‐Delgadillo 2010; Kabouk 2010; Leanza 2014a; Leanza 2014b; Peeraer 2013; Wadhwa 2013; Xu 2014). Two studies, Custers 2012 and Wordsworth 2011 were found to be further publications from the authors of Steures 2006a and Bhattacharya 2008 respectively, but had no new data relevant to this review. They have been listed as additional references for those included studies.
Four studies were not RCTs (Check 2013; Barros Delgadillo 2008; Leanza 2014a; Leanza 2014b), four did not include a comparison of interest to this review (Barros‐Delgadillo 2010; Kabouk 2010; Peeraer 2013; Wadhwa 2013), one was a cohort study (Aanesen 2014) and one was ineligible as it investigated donor sperm (Xu 2014).
For the 2012 review 13 studies were excluded (see 'Characteristics of excluded studies' table).
Six studies clearly did not meet the inclusion criteria. Two studies were found not to be randomised studies (Aboulghar 1993; Serhal 1988). An inadequate method of randomisation was the reason for exclusion of another two trials (Nulsen 1993; Prentice 1995). One study (Tummon 1997) included women with endometriosis only and thus did not focus on unexplained subfertility. Martinez 1990 reported biochemically confirmed pregnancies only and was therefore excluded.
Another seven studies were excluded because the appropriate data needed for the meta‐analysis were not obtainable. Ho 1998 did not report separate data for the couples with unexplained subfertility. Six studies (Doyle 1991; Evans 1991; Gregoriou 1995; Kirby 1991; Martinez 1991; Zikopoulos 1993) reported post‐crossover per‐cycle data only, instead of per randomised woman, and therefore could not be included. We contacted all authors to obtain pre‐crossover data.
Studies awaiting classification
There are no studies awaiting classification. However if pre‐crossover data of the excluded studies become available we will reconsider inclusion and report the studies in an update of this review.
Risk of bias in included studies
Allocation
In eight of the included studies (Agarwal 2004; Arici 1994; Bhattacharya 2008; Chung 1995; Goverde 2000; Melis 1995; Murdoch 1991; Steures 2006a), the methods used in sequence generation and allocation concealment were considered to be adequate and we, therefore, rated them as being at low risk of bias. In the remaining six trials (Arcaini 1996; Crosignani 1991; Deaton 1990; Guzick 1999; Janko 1998; Karlstrom 1993), the methods used in random sequence generation and allocation concealment were not sufficiently described to make a conclusive judgement, so we rated the risk of bias as unclear.
Blinding
None of the studies reported blinding. In trials comparing IUI with TI blinding is not possible. Trials comparing IUI with or without OH could be blinded. However, the use of subcutaneously administered ovarian hyperstimulation drugs complicates this. We rated all the included studies as unclear risk of bias in this domain as lack of blinding may not have any effect on the outcome measures.
Incomplete outcome data
We used an intention‐to‐treat (ITT) analysis when possible. In three trials an ITT analysis was not possible (Crosignani 1991; Deaton 1990; Karlstrom 1993) as the trials only reported the number of participants analysed.
In Murdoch 1991 one woman became pregnant spontaneously between treatment cycles. This pregnancy resulted in a live birth and was entered as such in the analysis. Goverde 2000 also reported spontaneous pregnancies that occurred between treatment cycles. Because it was unclear in which group these pregnancies occurred, they could not be used in the ITT analysis.
Six of the 14 included trials clearly mentioned the number of drop outs and the reasons for dropping out (Arici 1994; Deaton 1990; Goverde 2000; Guzick 1999; Melis 1995; Steures 2006a). Murdoch 1991 reported the number of drop outs but did not give any information on reasons for dropping out. Bhattacharya 2008 had a loss to follow‐up of less than 1%. The studies with the highest losses to follow‐up were Arcaini 1996 (dropout of 20.6%) and Agarwal 2004 (19%). In Agarwal the couples mainly left the study for financial reasons, which resulted in an unevenly distributed dropout rate of 37% in the treatment group as compared to 1% in the control group. The dropout rate usually increased in studies with a longer follow‐up period. Because this review included trials with different durations, it was difficult to compare the dropout rates. We rated eight of the included studies as low risk of bias, three as unclear and another three as high risk of bias.
Selective reporting
There is a risk of selective reporting in this review. Live birth data were not reported in five studies (Arcaini 1996; Crosignani 1991; Deaton 1990; Janko 1998; Karlstrom 1993). Adverse events were often not reported per group but as a study total, which could not be included in the analysis. Multiple pregnancy rates were not reported in two trials (Crosignani 1991; Janko 1998). We rated eight of the included studies as low risk of bias, five as unclear and one as high risk.
Other potential sources of bias
To reduce bias introduced by a crossover study design, we included pre‐crossover data only. Three studies used a crossover design (Arici 1994; Crosignani 1991; Deaton 1990). In this design participants were initially randomised to the treatment or control group but then crossed‐over to the other group after a certain number of treatment cycles. The duration of these studies varied from two to eight treatment cycles per couple. In two studies (Arici 1994; Crosignani 1991) the participants crossed over after one treatment cycle. In Deaton 1990 participants crossed over after four cycles. We rated eight of the included studies as low risk of bias because baseline demographic characteristics of participants between the two treatment groups were similar. The remaining six studies were assessed as unclear in this domain because there was insufficient information to make a conclusive judgement on the baseline demographic characteristics of participants.
Eleven studies used a parallel design, in which participants stayed in the group to which they were randomised. These trials offered a total of one to six treatment cycles per couple.
Effects of interventions
See: Summary of findings for the main comparison IUI compared to TI or expectant management both in natural cycle for unexplained subfertility; Summary of findings 2 IUI compared to TI or expectant management both in stimulated cycle for unexplained subfertility; Summary of findings 3 IUI in natural cycle compared to IUI in stimulated cycle for unexplained subfertility; Summary of findings 4 IUI in stimulated cycle compared to TI or expectant management in natural cycle for unexplained subfertility; Summary of findings 5 IUI in natural cycle compared to TI or expectant management in stimulated cycle for unexplained subfertility
This section describes the results of the meta‐analyses and sensitivity analyses.
Comparison 1. IUI versus TI or expectant management both in a natural cycle
The results from this comparison were all obtained from Bhattacharya 2008. Data for the unexplained subfertility group only were provided by the trial author.
1.1 Live birth rate per couple (all cycles)
Analysis 1.1
One trial compared IUI in a natural cycle with expectant management and showed no evidence of a difference in cumulative live births between the two treatment groups (OR 1.60, 95% CI 0.92 to 2.78; 1 RCT, n = 334; moderate quality evidence). The evidence suggested that if the chance of a live birth using TI was assumed to be 16%, that of IUI would be between 15% and 34%.
1.2 Multiple pregnancy rate per couple
There was no evidence of a difference in multiple pregnancy rate between the two treatment groups (OR 0.50, 95% CI 0.04 to 5.53; 1 RCT, n = 334; moderate quality evidence). The evidence suggested that if the risk of a multiple pregnancy using TI was assumed to be 1%, the risk using IUI would be between 0% and 6%.
1.3 Pregnancy rate per couple (all cycles)
Analysis 1.3
There was no evidence of a difference in pregnancy rates (all cycles) (OR 1.53, 95% CI 0.88 to 2.64; 1 RCT, n = 334; moderate quality evidence). Of the 167 women treated with IUI, 38 became pregnant compared to 27 of the 167 untreated women.
Other adverse events
1.4 Moderate or severe ovarian hyperstimulation syndrome rate per woman
Data on OHSS were not reported.
1.5 Miscarriage rate per couple
There was no evidence of a difference in miscarriage rate between the two treatment groups. Sixteen miscarriages were reported in a total of 334 couples, seven in the IUI group and nine in the TI group (OR 0.77, 95% CI 0.28 to 2.11; 1 RCT, n = 334; moderate quality evidence).
1.6 Ectopic pregnancy rate per couple
Analysis 1.5
There was no evidence of a difference in ectopic pregnancy rate between the two treatment groups. Two ectopic pregnancies were reported in a total of 334 couples and they occurred in the IUI group (OR 5.06, 95% CI 0.24 to 106.21; 1 RCT, n = 334; moderate quality evidence).
Comparison 2. IUI versus TI or expectant management both in stimulated cycles
2.1 Live birth rate per couple (all cycles)
Analysis 2.1
Only two of the six trials included in the analysis reported live birth rates (Chung 1995; Melis 1995). There was no evidence of a difference in live birth in women who underwent IUI compared with the TI group (OR 1.59, 95% CI 0.88 to 2.88, I2 = 72%; 2 RCTs, n = 208; moderate quality evidence). Statistical heterogeneity was detected (P = 0.06, I2 = 71.7%) between the two studies. This may be explained by the fact that all participants in Melis 1995 had previously received fertility treatment.
2.2 Multiple pregnancy rate per couple
Analysis 2.2
Four studies reported their multiple pregnancies per treatment arm (Arcaini 1996, Chung 1995,Karlstrom 1993, Melis 1995, with a total of 17 multiple pregnancies in a total of 316 couples. Arcaini 1996, Chung 1995 and Karlstrom 1993 reported one high‐order multiple pregnancy each. The studies reported 11 multiple pregnancies in the IUI group and six in the TI group (representing 13.5% of the total number of pregnancies in these studies). Pooling these studies resulted in no evidence of a difference (OR 1.46, 95% CI 0.55 to 3.87, I2 = 0%; 4 RCTs, n = 316; low quality evidence).
2.3 Pregnancy rate per couple (all cycles)
Analysis 2.3
Six trials reported pregnancy rates per couple. There were 517 women included in this analysis and 149 cumulative pregnancies were reported. The pregnancy rate was higher in the IUI group (OR 1.69, 95% CI 1.14 to 2.53, I2 = 8%; 7 RCTs, n = 517; low quality evidence) if all cycles were analysed. This suggested that if the chance of a pregnancy with timed intercourse was assumed to be 23%, the chance of a pregnancy in women using IUI would be between 26% and 43%. To check sensitivity to the model assumptions, the random‐effects model was used and showed a similar result (OR 1.72, 95% CI 1.11 to 2.65).
If the study by Agarwal 2004 was included in the analysis the results change markedly. The OR becomes 1.25 (95% CI 0.88 to 1.78), crossing the line of no evidence of effect. Including this study also introduced a strong heterogeneity (P = 0.02, I2 = 60%). This statistical heterogeneity caused by Agarwal 2004 supports our concerns about the validity of this trial, both from a statistical (high probability of bias) and from a clinical point of view. On the other hand, this sensitivity analysis showed the relative weakness of the significant difference we found. Therefore, our results should be interpreted with caution.
We performed a subgroup analysis for the number of treatment cycles. When we analysed the first treatment cycle only, no significant difference in pregnancy rate was seen (OR 1.54, 95% CI 0.82 to 2.88) and no heterogeneity detected (I2 = 0%). As expected, cumulative pregnancy rates increased with a rising number of treatment cycles per couple. We were unable to determine the optimal number of treatment cycles that a couple should be offered. See Appendix 7 for details.
Other adverse events
2.4 Moderate to severe ovarian hyperstimulation syndrome rate per woman
Analysis 2.4
There was no evidence of a difference in OHSS rate between the two treatment groups (OR 2.75, 95% CI 0.11 to 69.83; 1 RCT, n = 68; low quality evidence).
2.5 Miscarriage rate per couple
Analysis 2.5
Twenty‐seven miscarriages were reported in total. Fifteen were reported per treatment arm, nine in the IUI group and six in the TI group. There was no evidence of a difference in miscarriage rate between the two treatment groups (OR 1.66, 95% CI 0.56 to 4.88, I2 = 0%; 2 RCTs, n = 208; moderate quality evidence).
2.6 Ectopic pregnancy rate per couple
Analysis 2.6
There were not enough data available to analyse the ectopic pregnancy rate. The occurrence of an ectopic pregnancy was reported by one study of 100 women. There was no evidence of a difference in ectopic pregnancy rate between the two treatment groups (OR 3.06, 95% CI 0.12 to 76.95; 1 RCT, n = 100; moderate quality evidence)
Comparison 3. IUI in a natural cycle versus IUI in a stimulated cycle
3.1 Live birth rate per couple (all cycles)
Analysis 3.1
Three trials reported the number of live births per treatment arm (Arici 1994; Goverde 2000; Murdoch 1991). We obtained the live birth data from Guzick 1999 after correspondence with the study authors. A substantial increase in live births was found for women treated with IUI and OH compared to women treated with IUI in natural cycle (OR 0.48, 95% CI 0.29 to 0.82; I2 = 55%; 4 RCTs, n = 396, moderate quality evidence). The evidence suggested that if the chance of a live birth in IUI in a stimulated cycle was assumed to be 25%, the chance of a live birth in IUI in a natural cycle would be between 9% and 21%. The random‐effects model and analysis without ITT had similar results. See Appendix 8 for details.
3.2 Multiple pregnancy rate per couple
Analysis 3.2
There was no evidence of a difference in multiple pregnancy rate between the two treatment groups (OR 0.33, 95% CI 0.01 to 8.70; 2 RCTs, n = 65; low quality evidence). The evidence suggested that if the risk of multiple pregnancy in IUI in a stimulated cycle is assumed to be 2%, the risk of multiple pregnancy in IUI in a stimulated cycle would be between 0% and 23%.
3.3 Pregnancy rate per couple (all cycles)
Analysis 3.3
There was no evidence of a difference in pregnancy rate between the two treatment groups (OR 0.16, 95% CI 0.01 to 1.77 ;1 RCT, n = 26; moderate quality evidence).
Other adverse events
3.4 Moderate or severe ovarian hyperstimulation syndrome rate per woman
No estimable data were available for this outcome.
3.5 Miscarriage rate per couple
One miscarriage in the OH group was reported by Arici 1994. Guzick 1999 reported a total miscarriage rate of approximately 24% in all couples undergoing IUI treatment. There was no evidence of a difference in miscarriage rate between the two treatment groups (OR 0.19, 95% CI 0.01 to 5.20; 1 RCT, n = 26; low quality evidence).
3.6 Ectopic pregnancy rate per couple
Analysis 3.6
There was no evidence of a difference in ectopic pregnancy rate between the two treatment groups (OR 0.15, 95% CI 0.01 to 3.02; 2 RCTs, n = 250; moderate quality evidence)
Comparison 4. IUI in a stimulated cycle versus TI or expectant management in a natural cycle
The results of this comparison were collected from Deaton 1990 and Steures 2006a. Because Steures 2006a selected couples with an intermediate chance of spontaneous pregnancy only, pooling of both studies was not considered appropriate.
4.1 Live birth rate per couple (all cycles)
Analysis 4.1
This was only reported by Steures 2006a and showed no evidence of a difference in live birth rate (OR 0.82, 95% CI 0.45 to 1.49; 1 RCT, n = 253; moderate quality evidence); The evidence suggested that if the chance of a live birth in TI or expectant management in a natural cycle was assumed to be 24%, the chance of a live birth in IUI in a stimulated cycle would be between 12% and 32%.
4.2 Multiple pregnancy rate per couple
This outcome was investigated by two studies; there was no evidence of a difference in multiple pregnancy rate between the two treatment groups (OR 2.00, 95% CI 0.18 to 22.34; 2 RCTs, n = 304; moderate quality evidence). The evidence suggested that if the risk of a multiple pregnancy in TI or expectant management in natural cycle was assumed to be 1%, the risk of a multiple pregnancy in IUI in stimulated cycle would be between 0% and 13%.
4.3 Pregnancy rate per couple (all cycles)
Analysis 4.3
There was no evidence of a difference in cumulative pregnancy rate between the two treatment groups (OR 1.00, 95% CI 0.59 to 1.67; I2 = 70%; 2 RCTs, n= 304; moderate quality evidence). To check sensitivity to the model assumptions, the random‐effects model was used and a similar result was obtained (OR 1.39, 95% CI 0.37 to 5.23).
Other adverse events
4.4 Moderate or severe ovarian hyperstimulation syndrome rate per woman
One study (Deaton 1990) reported on OHSS in this comparison; no cases of OHSS were present in this study.
4.5 Miscarriage rate per couple
There was no evidence of a difference in miscarriage rate between the two treatment groups (OR 2.28, 95% CI 0.84 to 6.20; 1 RCT, n = 253; moderate quality evidence).
4.6 Ectopic pregnancy rate per couple
Ectopic pregnancies were not reported by any of the studies.
Comparison 5. IUI in a natural cycle versus TI or expectant management in a stimulated cycle
Bhattacharya 2008 studied this comparison with IUI in a natural cycle compared to TI in a clomiphene citrate stimulated cycle.
5.1 Live birth rate per couple (all cycles)
There was evidence of some increase in live births for IUI in a natural cycle when compared to TI in a stimulated cycle (OR 1.95, 95% CI 1.10 to 3.44; 1 RCT, n = 342: moderate quality evidence). The evidence suggested that if the chance of a live birth in TI in a stimulated cycle was assumed to be 13%, the chance of a live birth in IUI in a natural cycle would be between 14% and 34%.
5.2 Multiple pregnancy per couple
There was no evidence of a difference in multiple pregnancy rate between women who received IUI in a natural cycle and those who underwent TI in a stimulated cycle (OR 1.05, 95% CI 0.07 to 16.90; 1 RCT, n = 342; moderate quality evidence). The evidence suggested that if the risk of a multiple pregnancy in TI in a stimulated cycle was assumed to be 1%, the risk of a multiple pregnancy in IUI in a natural cycle would be between 0% and 9%.
5.3 Pregnancy rate per couple (all cycles)
Analysis 5.3
There was evidence of a some difference in cumulative pregnancy rate between the two treatment groups (OR 1.77, 95% CI 1.01 to 3.08; 1 RCT, n = 342; moderate quality evidence).
Other adverse events
5.4 Moderate or severe ovarian hyperstimulation syndrome rate per woman
OHSS was not reported.
5.5 Miscarriage rate per couple
Analysis 5.4
There was no evidence of a difference in miscarriage rate between the two treatment groups (OR 0.91, 95% CI 0.32 to 2.58; 1 RCT, n = 342; moderate quality evidence)
5.6 Ectopic pregnancy
Analysis 5.5
Although two ectopic pregnancies occurred in the IUI group, there was no evidence of a difference in ectopic pregnancy rate between the two treatment groups(OR 5.30, 95% CI 0.25 to 111.26; 1 RCT, n = 342; moderate quality evidence).
Discussion
Summary of main results
The aim of this review was to analyse the effectiveness of intra‐uterine insemination (IUI), with or without ovarian hyperstimulation (OH), by systematically evaluating the best available evidence. Because randomised controlled trials (RCTs) are still considered to provide the best assessment of the effectiveness of treatments (Hughes 2003; Johnson 2003), we included only truly randomised trials in this review. The individual trials were contradictory and often lacked sufficient power to draw firm conclusions. In spite of these shortcomings, and also some clinical heterogeneity, we were able to pool their results and draw some conclusions.
Meta‐analyses from 14 RCTs showed no conclusive evidence of a difference in live birth rates, multiple pregnancy rate and pregnancy rates for most of the comparisons.
The comparison IUI in a natural cycle with IUI in a hyperstimulated cycle revealed a more than two‐fold increase in live birth rate in women treated with OH (OR 0.48, 95% CI 0.29 to 0.82). This result could be considered robust. The analysis comprised 396 couples and included high quality trials. A study with 1500 couples showing no treatment effect is needed to reduce the lower confidence limit to one. If we use these data to calculate the numbers needed to treat, with an assumed control risk of 14%, we would find that approximately nine couples need to be treated with IUI and OH for approximately four cycles to result in one additional live birth compared to the control group. These data should be interpreted with caution because the impact of OH on multiple pregnancies and other adverse effects could not be answered by this review.
All the comparisons reported data on multiple pregnancy rate and there was no evidence of a difference in this outcome between the treatment groups in all the comparisons. The quality of the evidence ranged from low to moderate. The four studies in our analysis comparing IUI versus IUI with OH all reported multiple pregnancy rates, but only two reported the rates for those with unexplained subfertility. A valid analysis could, therefore, not be performed. All studies using gonadotropins as the stimulation method reported cancellation criteria. However, the highest multiple pregnancy rate was reported by Goverde 2000 (29% in the OH group compared to 4% in the natural cycle group) despite the use of strict cancellation criteria. It should be noted that 95% of the participants included in this comparison received gonadotropin treatment, which could result in higher multiple pregnancy rates compared to CC treatment (Ombelet 2005).
The comparison of IUI versus TI, or expectant management both in stimulated cycles, showed an odds ratio for pregnancy rate per couple of 1.69 (95% CI 1.14 to 2.53) in favour of IUI. It seems appropriate, therefore, to combine IUI and OH. However, the following points need to be taken into account. Firstly, there was insufficient evidence to conclude that IUI in combination with OH improved live birth rates when compared with TI in stimulated cycles. This might be the result of insufficient power, a total of 208 couples in two trials only were included (Chung 1995; Melis 1995), or the fact that Melis included a population with a poor prognosis (all participants had previously had unsuccessful treatment with IUI and OH). Because this study makes up half of the live birth analysis it could mask the promising results from Chung 1995.
Secondly, the results varied according to whether or not one study (Agarwal 2004) was included. In the meta‐analysis six studies were included, in which a total of 517 women were randomised to either treatment with OH alone or with IUI and OH. The inclusion of Agarwal 2004 (n = 140), which had been excluded due to a high risk of bias caused by losses to follow‐up, in a sensitivity analysis resulted in no evidence of effect. The sensitivity of our results after inclusion of a relatively small study emphasises the fragility of our analysis. However, the trial by Agarwal 2004 showed an unexpectedly high pregnancy rate in the control group compared to the treatment group (29% higher). Because there is no reason to believe that timed intercourse would increase the pregnancy rate compared to IUI, and because of the high dropout rate, this study should not be considered representative. It would be more realistic to assume that there is no difference between IUI and TI. Our calculations indicate that it would take a trial of approximately 400 participants showing no difference between IUI and TI to reduce the lower confidence limit to one.
Thirdly, the pooled studies were clinically heterogeneous. There was, however, no evidence of statistically significant heterogeneity. This suggests that the different factors had little effect on the overall conclusions; the included studies differed markedly in terms of treatment methods and quality. The pooled studies also used different treatment protocols. The type of OH drug and dose, the treatment duration and cancellation criteria could have influenced the outcomes. For example, the highest pregnancy rate per couple was found in the study by Arcaini 1996. A reason for this could be that this study used the most aggressive stimulation method, accepted a maximum of six dominant follicles and treated couples for up to five cycles. There were also variations in the patient population among the included studies that could have influenced the outcome, such as previous treatment and the inclusion of women with endometriosis. On the other hand, our results were not sensitive to the inclusion or exclusion of trials on the basis of the above‐mentioned parameters.
Fourthly, the clinical relevance of the result is questionable. The analysis shows evidence of a significant increase in pregnancy rate for cumulative cycles only. What does it clinically mean if the odds to become pregnant for a woman undergoing IUI treatment are 1.68 times higher than for a woman treated with OH alone, if the treatment duration could vary from one to up to five cycles? Stratification for treatment duration gave no evidence of an increase in pregnancy rate if only first cycle data were analysed. This implies that it takes more than one treatment cycle to significantly improve the couple's chances. However, it was not possible to give any clarity about the optimal number of treatment cycles in this review. A risk difference was calculated for the analysis of one to three treatment cycles, to extract the numbers needed to treat. Based on these results, approximately 13 couples need to be treated with one to three cycles of IUI and OH to result in one additional pregnancy.
Furthermore, the clinical relevance of the results is also dependent on the baseline fecundity of a couple. Unfortunately there were not enough data available in this meta‐analysis to perform subgroup analyses for prognostic factors, such as age and duration of subfertility. Overall, we can conclude that an odds ratio of 1.68 for treatment over one to five cycles for couples with different prognoses and baseline fecundity is not specific enough to be helpful in a clinical setting.
Finally, the impact of IUI on other adverse events, such as ovarian hyperstimulation syndrome, miscarriage and ectopic pregnancy could not be adequately estimated due to a lack of information. Adverse events were often not mentioned, or mentioned per group instead of per treatment modality. The studies mentioning 'no events' were included in the meta‐analyses, which might result in underestimation of the adverse events. On the other hand, these adverse events are mostly accredited to OH and not to IUI. It seems therefore unlikely that any significant difference in adverse events would be found when OH with TI is compared to OH with IUI.
Overall completeness and applicability of evidence
To adequately address the question whether IUI with or without OH is an effective treatment for couples with unexplained subfertility, our aim was to analyse the following five treatment comparisons: 1. IUI versus TI or expectant management, both in a natural cycle; 2. IUI versus TI or expectant management, both in a stimulated cycle; 3. IUI in a natural cycle versus IUI in a stimulated cycle; 4. IUI in a stimulated cycle versus TI or expectant management in a natural cycle; and 5. IUI in a natural cycle versus TI or expectant management in a stimulated cycle. Most of the comparisons were investigated in single trials, thereby making it difficult to combine data in meta‐analyses. Where data were pooled in meta‐analyses, the overall effect estimates usually had wide confidence intervals due to small sample size or inadequate power of the trials which contributed data to the pooled estimates.
Furthermore, we were not able to assess all desired outcomes for each comparison. There were not enough data available to retrieve adequate live birth rates, and there were even fewer data available for the adverse effects of each treatment modality. Important prognostic factors such as age, duration of subfertility and previous treatment were poorly reported, making it impossible to perform subgroup analyses.
The four studies in our analysis comparing IUI versus IUI with OH all reported multiple pregnancy rates, but only two reported the rates for those with unexplained subfertility. A valid analysis could not be performed. All studies using gonadotropins as the stimulation method reported cancellation criteria. However, the highest multiple pregnancy rate was reported by Goverde 2000 (29% in the OH group compared to 4% in the natural cycle group) despite the use of strict cancellation criteria. It should be noted that 95% of the participants included in this comparison received gonadotropin treatment, which could result in higher multiple pregnancy rates compared to CC treatment..
Quality of the evidence
The overall quality of the included trials was suboptimal. This was mainly because of imprecision, with effect estimates of most of the GRADE‐specific outcomes having wide confidence intervals.
The quality of fertility trials has been criticised repeatedly. One of the areas of particular concern is what statisticians refer to as the 'unit of analysis' error (Vail 2003). It is methodologically incorrect to report data per cycle when it is women or couples who are randomised because many of the women will have undergone more than one treatment cycle (Dias 2008; Johnson 2003; Vail 2003). Yet pregnancy rate per cycle is a commonly reported outcome in fertility trials and reviews.
Another methodological difficulty in fertility trials is the use of studies with a crossover design. There have been many discussions about whether a crossover design is appropriate for fertility trials, mainly because participants drop out after treatment success, which results in a selected patient population post‐crossover. For this reason, it is said that the crossover design has no place in infertility trials (Daya 1993). A crossover design could result in an overestimation of the treatment effect (Khan 1996; Norman 2000). Whether this overestimation could be statistically corrected for or whether it is clinically relevant remains under debate (Cohlen 1998; McDonnell 2004; Vail 2003). In this systematic review we focused on live birth rates or pregnancy rates per couple. The couple being the denominator, post‐crossover data could not be included because then couples would have received both treatment modalities and results per couple could not be extracted.
The more recent studies adopted expectant management as a control treatment for IUI instead of timed intercourse (Bhattacharya 2008; Steures 2006a). Because timing of intercourse (TI) interferes with the natural coital habits of a couple, expectant management has been proposed as the more appropriate comparison treatment for IUI (Wilcox 1995). A recent meta‐analysis however shows no significant difference in pregnancy rate between studies comparing IUI versus TI and studies with IUI versus expectant management (Snick 2008). Whether it is appropriate to pool studies including TI and expectant management in a meta‐analysis remains unclear. The data of Bhattacharya 2008 and Steures 2006a were not, however, pooled with data of trials applying TI because these trials comprised comparisons that were not subject to many other trials.
It is generally agreed that the aim of fertility treatment should be to achieve a live birth instead of inducing a pregnancy (Land 2003). Healy and others go even further by suggesting that the 'birth emphasizing a successful singleton at term' (BESST) outcome should be the standard measure of success for fertility trials (Daya 2003; Fauser 2005; Healy 2004; Min 2004). We have tried to focus on live birth as the main outcome of interest in this analysis. Unfortunately, live birth was reported by only eight of the 14 included studies. We decided to use live birth data whenever possible for the analyses. If there were not enough live birth data available we used the more often reported pregnancy rates for the main analyses.
Potential biases in the review process
To prevent selection bias, the included studies were independently selected and data extracted by two authors (Ayeleke and Verhulst for the 2015 update). Disagreements were resolved by discussion, keeping the protocol as our guideline to reduce bias. A statistician (Mr Vail) was consulted for the data extraction of complicated crossover trials. We have extracted and calculated the events per randomised couple for this meta‐analysis, which resulted in the exclusion of six studies reporting only post‐crossover or per‐cycle data. As a consequence, the analysis is statistically less biased although a selection bias may have occurred.
A funnel plot was done only for the comparison with the most studies (IUI versus TI both in a stimulated cycle) (Figure 4). The funnel plot is reasonably symmetrical, suggesting that a publication bias is unlikely.

Funnel plot of comparison: 2 IUI versus TI both in stimulated cycle, outcome: 2.3 Pregnancy rate per couple (all cycles).
It should be noted that Asian countries are underrepresented in the included trials. It is not known whether Asian IUI trials have not been done or could not be found with our search.
Agreements and disagreements with other studies or reviews
Previous review articles and meta‐analyses by, for example, Aboulghar 2003, Balasch 2004, Cohlen 2005, Costello 2004, Hughes 1997 and Zeyneloglu 1998 have all assessed the effectiveness of IUI and ovarian hyperstimulation. They have, however, all calculated pregnancy rates per cycle, which makes it difficult to compare with our per‐couple data. Per‐cycle data produce biased results that may exaggerate treatment results (Dias 2008). This could explain why the pregnancy rates found in our meta‐analysis are lower than those generally reported by the above‐mentioned authors.

Methodological quality graph: review authors' judgements about each methodological quality item presented as percentages across all included studies.

Methodological quality summary: review authors' judgements about each methodological quality item for each included study.

Study flow diagram.

Funnel plot of comparison: 2 IUI versus TI both in stimulated cycle, outcome: 2.3 Pregnancy rate per couple (all cycles).
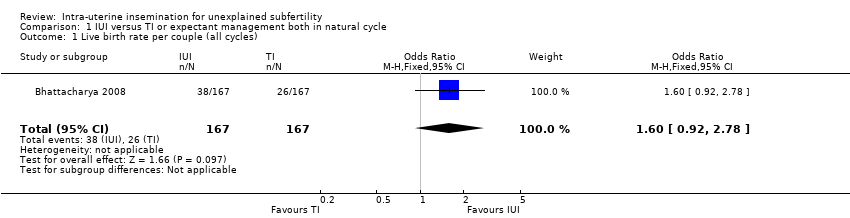
Comparison 1 IUI versus TI or expectant management both in natural cycle, Outcome 1 Live birth rate per couple (all cycles).

Comparison 1 IUI versus TI or expectant management both in natural cycle, Outcome 2 Multiple pregnancy rate per couple.

Comparison 1 IUI versus TI or expectant management both in natural cycle, Outcome 3 Pregnancy rate per couple (all cycles).
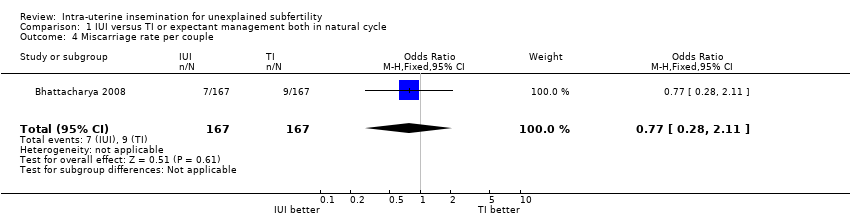
Comparison 1 IUI versus TI or expectant management both in natural cycle, Outcome 4 Miscarriage rate per couple.

Comparison 1 IUI versus TI or expectant management both in natural cycle, Outcome 5 Ectopic pregnancy rate per couple.

Comparison 2 IUI versus TI or expectant management both in stimulated cycle, Outcome 1 Live birth rate per couple (all cycles).

Comparison 2 IUI versus TI or expectant management both in stimulated cycle, Outcome 2 Multiple pregnancy rate per couple.
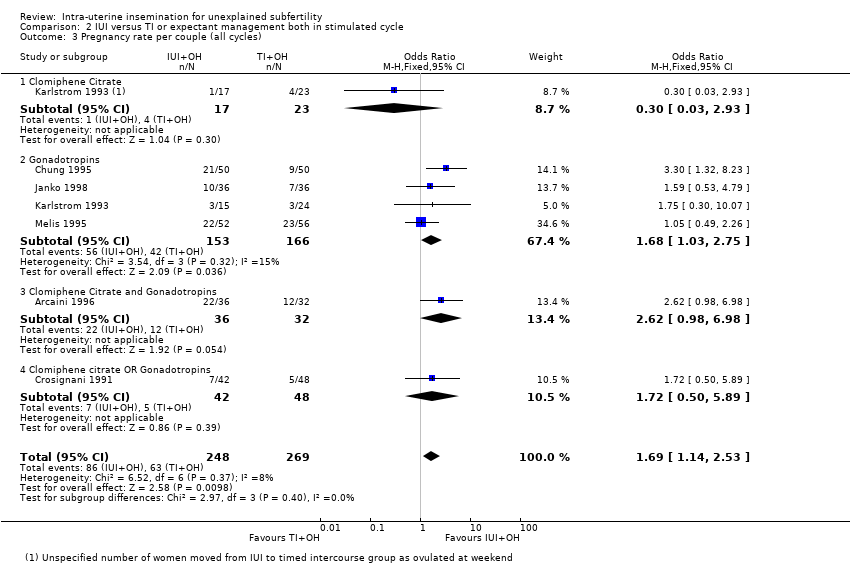
Comparison 2 IUI versus TI or expectant management both in stimulated cycle, Outcome 3 Pregnancy rate per couple (all cycles).
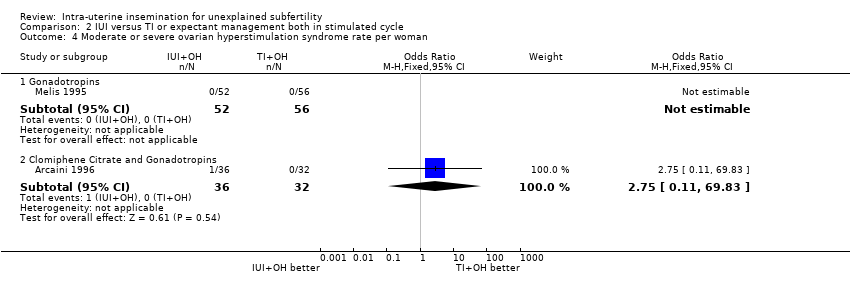
Comparison 2 IUI versus TI or expectant management both in stimulated cycle, Outcome 4 Moderate or severe ovarian hyperstimulation syndrome rate per woman.

Comparison 2 IUI versus TI or expectant management both in stimulated cycle, Outcome 5 Miscarriage rate per couple.

Comparison 2 IUI versus TI or expectant management both in stimulated cycle, Outcome 6 Ectopic pregnancy rate per couple.

Comparison 3 IUI in natural cycle versus IUI in stimulated cycle, Outcome 1 Live birth rate per couple (all cycles).

Comparison 3 IUI in natural cycle versus IUI in stimulated cycle, Outcome 2 Multiple pregnancy rate per couple.

Comparison 3 IUI in natural cycle versus IUI in stimulated cycle, Outcome 3 Pregnancy rate per couple (all cycles).
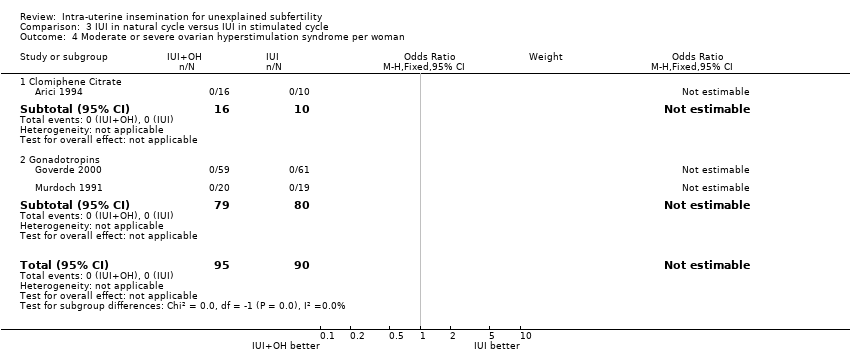
Comparison 3 IUI in natural cycle versus IUI in stimulated cycle, Outcome 4 Moderate or severe ovarian hyperstimulation syndrome per woman.
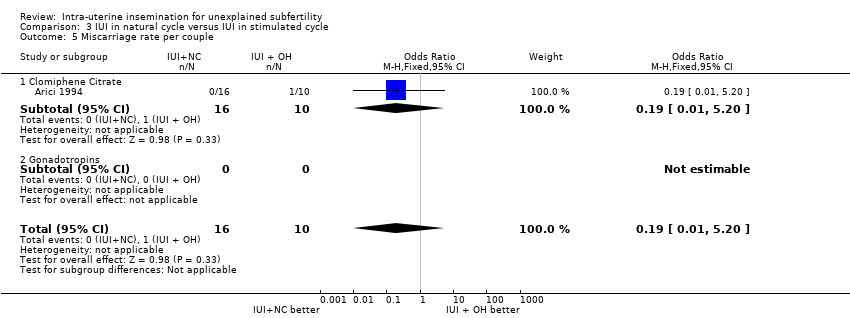
Comparison 3 IUI in natural cycle versus IUI in stimulated cycle, Outcome 5 Miscarriage rate per couple.

Comparison 3 IUI in natural cycle versus IUI in stimulated cycle, Outcome 6 Ectopic pregnancy rate per couple.

Comparison 4 IUI in stimulated cycle versus TI or expectant management in natural cycle, Outcome 1 Live birth rate per couple (all cycles).

Comparison 4 IUI in stimulated cycle versus TI or expectant management in natural cycle, Outcome 2 Multiple pregnancy rate per couple.
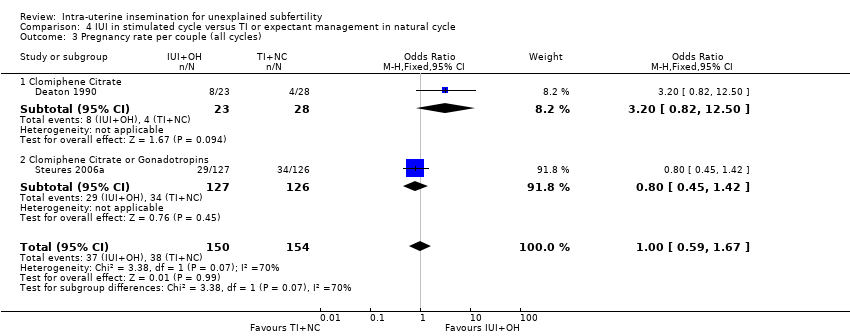
Comparison 4 IUI in stimulated cycle versus TI or expectant management in natural cycle, Outcome 3 Pregnancy rate per couple (all cycles).
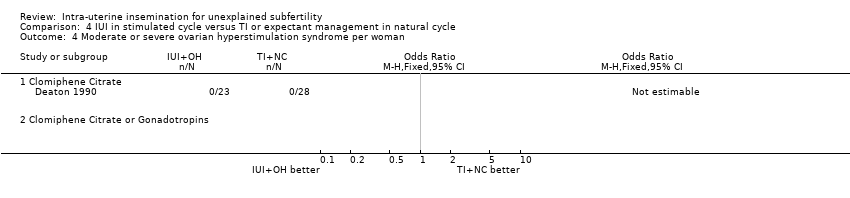
Comparison 4 IUI in stimulated cycle versus TI or expectant management in natural cycle, Outcome 4 Moderate or severe ovarian hyperstimulation syndrome per woman.

Comparison 4 IUI in stimulated cycle versus TI or expectant management in natural cycle, Outcome 5 Miscarriage rate per couple.

Comparison 5 IUI in natural cycle versus TI or expectant management in stimulated cycle, Outcome 1 Live birth rate per couple (all cycles).
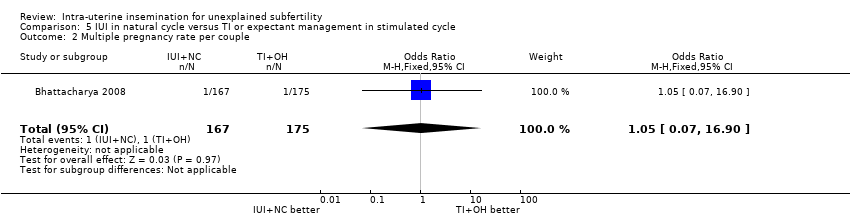
Comparison 5 IUI in natural cycle versus TI or expectant management in stimulated cycle, Outcome 2 Multiple pregnancy rate per couple.
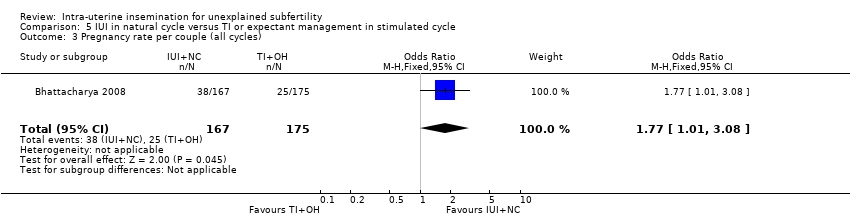
Comparison 5 IUI in natural cycle versus TI or expectant management in stimulated cycle, Outcome 3 Pregnancy rate per couple (all cycles).

Comparison 5 IUI in natural cycle versus TI or expectant management in stimulated cycle, Outcome 4 Miscarriage rate per couple.

Comparison 5 IUI in natural cycle versus TI or expectant management in stimulated cycle, Outcome 5 Ectopic pregnancy rate per couple.
| IUI compared to TI or expectant management both in natural cycle for unexplained subfertility | ||||||
| Patient or population: people with unexplained subfertility | ||||||
| Outcomes | Illustrative comparative risks* (95% CI) | Relative effect | No of Participants | Quality of the evidence | Comments | |
| Assumed risk | Corresponding risk | |||||
| TI or expectant management both in natural cycle | IUI | |||||
| Live birth rate per couple (all cycles) | 156 per 1000 | 228 per 1000 | OR 1.60 | 334 | ⊕⊕⊕⊝ | |
| Multiple pregnancy rate per couple | 12 per 1000 | 6 per 1000 | OR 0.50 | 334 | ⊕⊕⊕⊝ | |
| Pregnancy rate per couple (all cycles) | 162 per 1000 | 228 per 1000 | OR 1.53 | 334 | ⊕⊕⊕⊝ | |
| Ovarian Hyperstimulation Syndrome rate per woman ‐ not reported | Not estimable | ‐ | ||||
| Miscarriage rate per couple | 54 per 1000 | 42 per 1000 | OR 0.77 | 334 | ⊕⊕⊕⊝ | |
| Ectopic pregnancy rate per couple | Not estimable | OR 5.06 | 334 | ⊕⊕⊕⊝ | ||
| *The basis for the assumed risk is the median control group risk across studies. The corresponding risk (and its 95% confidence interval) is based on the assumed risk in the comparison group and the relative effect of the intervention (and its 95% CI). | ||||||
| GRADE Working Group grades of evidence | ||||||
| 1 Small sample size | ||||||
| IUI compared to TI or expectant management both in stimulated cycle for unexplained subfertility | ||||||
| Patient or population: people with unexplained subfertility | ||||||
| Outcomes | Illustrative comparative risks* (95% CI) | Relative effect | No of Participants | Quality of the evidence | Comments | |
| Assumed risk | Corresponding risk | |||||
| TI both in stimulated cycle | IUI | |||||
| Live birth rate per couple (all cycles) | 255 per 1000 | 352 per 1000 | OR 1.59 | 208 | ⊕⊕⊕⊝ | |
| Multiple pregnancy rate per couple | 43 per 1000 | 62 per 1000 | OR 1.46 | 316 | ⊕⊕⊝⊝ | |
| Pregnancy rate per couple (all cycles) | 234 per 1000 | 339 per 1000 | OR 1.69 | 517 | ⊕⊕⊝⊝ | |
| Ovarian Hyperstimulation Syndrome rate per woman | not estimable | OR 2.75 | 68 | ⊕⊕⊝⊝ | ||
| Miscarriage rate per couple | 57 per 1000 | 91 per 1000 | OR 1.66 | 208 | ⊕⊕⊕⊝ | |
| Ectopic pregnancy rate per couple | not estimable | OR 3.06 | 100 | ⊕⊕⊕⊝ | ||
| *The basis for the assumed risk is the median control group risk across studies. The corresponding risk (and its 95% confidence interval) is based on the assumed risk in the comparison group and the relative effect of the intervention (and its 95% CI). | ||||||
| GRADE Working Group grades of evidence | ||||||
| 1 Small sample size | ||||||
| IUI in natural cycle compared to IUI in stimulated cycle for unexplained subfertility | ||||||
| Patient or population: people with unexplained subfertility | ||||||
| Outcomes | Illustrative comparative risks* (95% CI) | Relative effect | No of Participants | Quality of the evidence | Comments | |
| Assumed risk | Corresponding risk | |||||
| IUI in stimulated cycle | IUI in natural cycle | |||||
| Live birth rate per couple (all cycles) | 248 per 1000 | 137 per 1000 | OR 0.48 | 396 | ⊕⊕⊕⊝ | |
| Multiple pregnancy rate per couple | 33 per 1000 | 11 per 1000 | OR 0.33 | 65 | ⊕⊕⊝⊝ | |
| Pregnancy rate per couple (all cycles) | 300 per 1000 | 64 per 1000 | OR 0.16 | 26 | ⊕⊕⊕⊝ | |
| Ovarian Hyperstimulation Syndrome rate per woman5 ‐ not measured | Not estimable3 | ‐ | ||||
| Miscarriage rate per couple | 100 per 1000 | 21 per 1000 | OR 0.19 | 26 | ⊕⊕⊝⊝ | |
| Ectopic pregnancy rate per couple | 23 per 1000 | 4 per 1000 | OR 0.15 | 250 | ⊕⊕⊕⊝ | |
| *The basis for the assumed risk is the median control group risk across studies. The corresponding risk (and its 95% confidence interval) is based on the assumed risk in the comparison group and the relative effect of the intervention (and its 95% CI). | ||||||
| GRADE Working Group grades of evidence | ||||||
| 1 Small sample size | ||||||
| IUI in stimulated cycle compared to TI or expectant management in natural cycle for unexplained subfertility | ||||||
| Patient or population: people with unexplained subfertility | ||||||
| Outcomes | Illustrative comparative risks* (95% CI) | Relative effect | No of Participants | Quality of the evidence | Comments | |
| Assumed risk | Corresponding risk | |||||
| TI or expectant management in natural cycle | IUI in stimulated cycle | |||||
| Live birth rate per couple (all cycles) | 238 per 1000 | 204 per 1000 | OR 0.82 | 253 | ⊕⊕⊕⊝ | |
| Multiple pregnancy rate per couple | 6 per 1000 | 13 per 1000 | OR 2.00 | 304 | ⊕⊕⊕⊝ | |
| Pregnancy rate per couple (all cycles) | 247 per 1000 | 247 per 1000 | OR 1.00 | 304 | ⊕⊕⊕⊝ | |
| Ovarian Hyperstimulation rate per woman ‐ not measured | Not estimable | ‐ | ||||
| Miscarriage rate per couple | 48 per 1000 | 103 per 1000 | OR 2.28 | 253 | ⊕⊕⊕⊝ | |
| Ectopic pregnancy rate per couple ‐ not reported | See comment | See comment | Not estimable | ‐ | See comment | |
| *The basis for the assumed risk is the median control group risk across studies. The corresponding risk (and its 95% confidence interval) is based on the assumed risk in the comparison group and the relative effect of the intervention (and its 95% CI). | ||||||
| GRADE Working Group grades of evidence | ||||||
| 1 Small sample size | ||||||
| IUI in natural cycle compared to TI or expectant management in stimulated cycle for unexplained subfertility | ||||||
| Patient or population: people with unexplained subfertility | ||||||
| Outcomes | Illustrative comparative risks* (95% CI) | Relative effect | No of Participants | Quality of the evidence | Comments | |
| Assumed risk | Corresponding risk | |||||
| TI in stimulated cycle | IUI in natural cycle | |||||
| Live birth rate per couple (all cycles) | 131 per 1000 | 227 per 1000 | OR 1.95 | 342 | ⊕⊕⊕⊝ | |
| Multiple pregnancy rate per couple | 6 per 1000 | 6 per 1000 | OR 1.05 | 342 | ⊕⊕⊕⊝ | |
| Pregnancy rate per couple (all cycles) | 143 per 1000 | 228 per 1000 | OR 1.77 | 342 | ⊕⊕⊕⊝ | |
| Ovarian Hyperstimulation Syndrome rate per woman ‐ not reported | Not estimable | ‐ | ||||
| Miscarriage rate per couple | 46 per 1000 | 42 per 1000 | OR 0.91 | 342 | ⊕⊕⊕⊝ | |
| Ectopic pregnancy rate per couple | Not estimable | OR 5.30 | 342 | ⊕⊕⊕⊝ | ||
| *The basis for the assumed risk is the median control group risk across studies. The corresponding risk (and its 95% confidence interval) is based on the assumed risk in the comparison group and the relative effect of the intervention (and its 95% CI). | ||||||
| GRADE Working Group grades of evidence | ||||||
| 1 Small sample size | ||||||
| Outcome or subgroup title | No. of studies | No. of participants | Statistical method | Effect size |
| 1 Live birth rate per couple (all cycles) Show forest plot | 1 | 334 | Odds Ratio (M‐H, Fixed, 95% CI) | 1.60 [0.92, 2.78] |
| 2 Multiple pregnancy rate per couple Show forest plot | 1 | 334 | Odds Ratio (M‐H, Fixed, 95% CI) | 0.50 [0.04, 5.53] |
| 3 Pregnancy rate per couple (all cycles) Show forest plot | 1 | 334 | Odds Ratio (M‐H, Fixed, 95% CI) | 1.53 [0.88, 2.64] |
| 4 Miscarriage rate per couple Show forest plot | 1 | 334 | Odds Ratio (M‐H, Fixed, 95% CI) | 0.77 [0.28, 2.11] |
| 5 Ectopic pregnancy rate per couple Show forest plot | 1 | 334 | Odds Ratio (M‐H, Fixed, 95% CI) | 5.06 [0.24, 106.21] |
| Outcome or subgroup title | No. of studies | No. of participants | Statistical method | Effect size |
| 1 Live birth rate per couple (all cycles) Show forest plot | 2 | 208 | Odds Ratio (M‐H, Fixed, 95% CI) | 1.59 [0.88, 2.88] |
| 1.1 Gonadotropins | 2 | 208 | Odds Ratio (M‐H, Fixed, 95% CI) | 1.59 [0.88, 2.88] |
| 2 Multiple pregnancy rate per couple Show forest plot | 4 | 316 | Odds Ratio (M‐H, Fixed, 95% CI) | 1.46 [0.55, 3.87] |
| 2.1 Clomiphene Citrate | 1 | 40 | Odds Ratio (M‐H, Fixed, 95% CI) | 0.43 [0.02, 11.18] |
| 2.2 Gonadotropins | 2 | 208 | Odds Ratio (M‐H, Fixed, 95% CI) | 1.61 [0.44, 5.89] |
| 2.3 Clomiphene Citrate and Gonadotropins | 1 | 68 | Odds Ratio (M‐H, Fixed, 95% CI) | 1.88 [0.32, 11.00] |
| 3 Pregnancy rate per couple (all cycles) Show forest plot | 6 | 517 | Odds Ratio (M‐H, Fixed, 95% CI) | 1.69 [1.14, 2.53] |
| 3.1 Clomiphene Citrate | 1 | 40 | Odds Ratio (M‐H, Fixed, 95% CI) | 0.30 [0.03, 2.93] |
| 3.2 Gonadotropins | 4 | 319 | Odds Ratio (M‐H, Fixed, 95% CI) | 1.68 [1.03, 2.75] |
| 3.3 Clomiphene Citrate and Gonadotropins | 1 | 68 | Odds Ratio (M‐H, Fixed, 95% CI) | 2.62 [0.98, 6.98] |
| 3.4 Clomiphene citrate OR Gonadotropins | 1 | 90 | Odds Ratio (M‐H, Fixed, 95% CI) | 1.72 [0.50, 5.89] |
| 4 Moderate or severe ovarian hyperstimulation syndrome rate per woman Show forest plot | 2 | Odds Ratio (M‐H, Fixed, 95% CI) | Subtotals only | |
| 4.1 Gonadotropins | 1 | 108 | Odds Ratio (M‐H, Fixed, 95% CI) | 0.0 [0.0, 0.0] |
| 4.2 Clomiphene Citrate and Gonadotropins | 1 | 68 | Odds Ratio (M‐H, Fixed, 95% CI) | 2.75 [0.11, 69.83] |
| 5 Miscarriage rate per couple Show forest plot | 2 | 208 | Odds Ratio (M‐H, Fixed, 95% CI) | 1.66 [0.56, 4.88] |
| 5.1 Gonadotropins | 2 | 208 | Odds Ratio (M‐H, Fixed, 95% CI) | 1.66 [0.56, 4.88] |
| 6 Ectopic pregnancy rate per couple Show forest plot | 1 | 100 | Odds Ratio (M‐H, Fixed, 95% CI) | 3.06 [0.12, 76.95] |
| 6.1 Gonadotropins | 1 | 100 | Odds Ratio (M‐H, Fixed, 95% CI) | 3.06 [0.12, 76.95] |
| Outcome or subgroup title | No. of studies | No. of participants | Statistical method | Effect size |
| 1 Live birth rate per couple (all cycles) Show forest plot | 4 | 396 | Odds Ratio (M‐H, Fixed, 95% CI) | 0.48 [0.29, 0.82] |
| 1.1 Clomiphene Citrate | 1 | 26 | Odds Ratio (M‐H, Fixed, 95% CI) | 0.27 [0.02, 3.41] |
| 1.2 Gonadotropins | 3 | 370 | Odds Ratio (M‐H, Fixed, 95% CI) | 0.50 [0.29, 0.85] |
| 2 Multiple pregnancy rate per couple Show forest plot | 2 | 65 | Odds Ratio (M‐H, Fixed, 95% CI) | 0.33 [0.01, 8.70] |
| 2.1 Clomiphene Citrate | 1 | 26 | Odds Ratio (M‐H, Fixed, 95% CI) | 0.0 [0.0, 0.0] |
| 2.2 Gonadotropins | 1 | 39 | Odds Ratio (M‐H, Fixed, 95% CI) | 0.33 [0.01, 8.70] |
| 3 Pregnancy rate per couple (all cycles) Show forest plot | 1 | 26 | Odds Ratio (M‐H, Fixed, 95% CI) | 0.16 [0.01, 1.77] |
| 3.1 Clomiphene Citrate | 1 | 26 | Odds Ratio (M‐H, Fixed, 95% CI) | 0.16 [0.01, 1.77] |
| 4 Moderate or severe ovarian hyperstimulation syndrome per woman Show forest plot | 3 | 185 | Odds Ratio (M‐H, Fixed, 95% CI) | 0.0 [0.0, 0.0] |
| 4.1 Clomiphene Citrate | 1 | 26 | Odds Ratio (M‐H, Fixed, 95% CI) | 0.0 [0.0, 0.0] |
| 4.2 Gonadotropins | 2 | 159 | Odds Ratio (M‐H, Fixed, 95% CI) | 0.0 [0.0, 0.0] |
| 5 Miscarriage rate per couple Show forest plot | 1 | 26 | Odds Ratio (M‐H, Fixed, 95% CI) | 0.19 [0.01, 5.20] |
| 5.1 Clomiphene Citrate | 1 | 26 | Odds Ratio (M‐H, Fixed, 95% CI) | 0.19 [0.01, 5.20] |
| 5.2 Gonadotropins | 0 | 0 | Odds Ratio (M‐H, Fixed, 95% CI) | 0.0 [0.0, 0.0] |
| 6 Ectopic pregnancy rate per couple Show forest plot | 2 | 250 | Odds Ratio (M‐H, Fixed, 95% CI) | 0.15 [0.01, 3.02] |
| 6.1 Gonadotropins | 2 | 250 | Odds Ratio (M‐H, Fixed, 95% CI) | 0.15 [0.01, 3.02] |
| Outcome or subgroup title | No. of studies | No. of participants | Statistical method | Effect size |
| 1 Live birth rate per couple (all cycles) Show forest plot | 1 | 253 | Odds Ratio (M‐H, Fixed, 95% CI) | 0.82 [0.45, 1.49] |
| 2 Multiple pregnancy rate per couple Show forest plot | 2 | 304 | Odds Ratio (M‐H, Fixed, 95% CI) | 2.0 [0.18, 22.34] |
| 2.1 Clomiphene Citrate | 1 | 51 | Odds Ratio (M‐H, Fixed, 95% CI) | 0.0 [0.0, 0.0] |
| 2.2 Clomiphene Citrate or Gonadotropins | 1 | 253 | Odds Ratio (M‐H, Fixed, 95% CI) | 2.0 [0.18, 22.34] |
| 3 Pregnancy rate per couple (all cycles) Show forest plot | 2 | 304 | Odds Ratio (M‐H, Fixed, 95% CI) | 1.00 [0.59, 1.67] |
| 3.1 Clomiphene Citrate | 1 | 51 | Odds Ratio (M‐H, Fixed, 95% CI) | 3.2 [0.82, 12.50] |
| 3.2 Clomiphene Citrate or Gonadotropins | 1 | 253 | Odds Ratio (M‐H, Fixed, 95% CI) | 0.80 [0.45, 1.42] |
| 4 Moderate or severe ovarian hyperstimulation syndrome per woman Show forest plot | 1 | Odds Ratio (M‐H, Fixed, 95% CI) | Totals not selected | |
| 4.1 Clomiphene Citrate | 1 | Odds Ratio (M‐H, Fixed, 95% CI) | 0.0 [0.0, 0.0] | |
| 4.2 Clomiphene Citrate or Gonadotropins | 0 | Odds Ratio (M‐H, Fixed, 95% CI) | 0.0 [0.0, 0.0] | |
| 5 Miscarriage rate per couple Show forest plot | 1 | 253 | Odds Ratio (M‐H, Fixed, 95% CI) | 2.28 [0.84, 6.20] |
| Outcome or subgroup title | No. of studies | No. of participants | Statistical method | Effect size |
| 1 Live birth rate per couple (all cycles) Show forest plot | 1 | 342 | Odds Ratio (M‐H, Fixed, 95% CI) | 1.95 [1.10, 3.44] |
| 2 Multiple pregnancy rate per couple Show forest plot | 1 | 342 | Odds Ratio (M‐H, Fixed, 95% CI) | 1.05 [0.07, 16.90] |
| 3 Pregnancy rate per couple (all cycles) Show forest plot | 1 | 342 | Odds Ratio (M‐H, Fixed, 95% CI) | 1.77 [1.01, 3.08] |
| 4 Miscarriage rate per couple Show forest plot | 1 | 342 | Odds Ratio (M‐H, Fixed, 95% CI) | 0.91 [0.32, 2.58] |
| 5 Ectopic pregnancy rate per couple Show forest plot | 1 | 342 | Odds Ratio (M‐H, Random, 95% CI) | 5.30 [0.25, 111.26] |