Physical conditioning as part of a return to work strategy to reduce sickness absence for workers with back pain
Appendices
Appendix 1. MEDLINE search strategy
Search strategy for MEDLINE (Ovid):
1 randomized controlled trial.pt.
2 controlled clinical trial.pt.
3 randomized.ab.
4 placebo.ab,ti.
5 drug therapy.fs.
6 randomly.ab,ti.
7 trial.ab,ti.
8 groups.ab,ti.
9 or/1‐8
10 (animals not (humans and animals)).sh.
11 9 not 10
12 dorsalgia.ti,ab.
13 exp Back Pain/
14 backache.ti,ab.
15 exp Low Back Pain/
16 (lumbar adj pain).ti,ab.
17 coccyx.ti,ab.
18 coccydynia.ti,ab.
19 sciatica.ti,ab.
20 sciatic neuropathy/
21 spondylosis.ti,ab.
22 lumbago.ti,ab.
23 or/12‐22
24 work conditioning.mp.
25 work hardening.mp.
26 functional restoration.mp.
27 exercise$.mp. or exp Exercise/
28 gym$ prog$.mp. [mp=title, abstract, original title, name of substance word, subject heading word, protocol supplementary concept, rare disease supplementary concept, unique identifier]
29 disability evaluation.mp. or exp Disability Evaluation/
30 exp Work/
31 exp Work Capacity Evaluation/
32 worker$.mp.
33 or/24‐32
34 11 and 23 and 33
35 limit 34 to yr="2008 ‐ 2012"
36 limit 34 to ed=20080601‐20120320
37 35 or 36
Appendix 2. Criteria for assessing risk of bias for internal validity
Random sequence generation (selection bias)
Selection bias (biased allocation to interventions) due to inadequate generation of a randomised sequence
There is a low risk of selection bias if the investigators describe a random component in the sequence generation process such as: referring to a random number table, using a computer random number generator, coin tossing, shuffling cards or envelopes, throwing dice, drawing of lots, minimisation (minimisation may be implemented without a random element, and this is considered to be equivalent to being random).
There is a high risk of selection bias if the investigators describe a non‐random component in the sequence generation process, such as: sequence generated by odd or even date of birth, date (or day) of admission, hospital or clinic record number; or allocation by judgement of the clinician, preference of the participant, results of a laboratory test or a series of tests, or availability of the intervention.
Allocation concealment (selection bias)
Selection bias (biased allocation to interventions) due to inadequate concealment of allocations prior to assignment
There is a low risk of selection bias if the participants and investigators enrolling participants could not foresee assignment because one of the following, or an equivalent method, was used to conceal allocation: central allocation (including telephone, web‐based and pharmacy‐controlled randomisation); sequentially numbered drug containers of identical appearance; or sequentially numbered, opaque, sealed envelopes.
There is a high risk of bias if participants or investigators enrolling participants could possibly foresee assignments and thus introduce selection bias, such as allocation based on: using an open random allocation schedule (e.g. a list of random numbers); assignment envelopes were used without appropriate safeguards (e.g. if envelopes were unsealed or non‐opaque or not sequentially numbered); alternation or rotation; date of birth; case record number; or other explicitly unconcealed procedures.
Blinding of participants
Performance bias due to knowledge of the allocated interventions by participants during the study
There is a low risk of performance bias if blinding of participants was ensured and it was unlikely that the blinding could have been broken; or if there was no blinding or incomplete blinding, but the review authors judge that the outcome is not likely to be influenced by lack of blinding.
Blinding of personnel and care providers (performance bias)
Performance bias due to knowledge of the allocated interventions by personnel and care providers during the study
There is a low risk of performance bias if blinding of personnel was ensured and it was unlikely that the blinding could have been broken; or if there was no blinding or incomplete blinding, but the review authors judge that the outcome is not likely to be influenced by lack of blinding.
Blinding of outcome assessor (detection bias)
Detection bias due to knowledge of the allocated interventions by outcome assessors
There is low risk of detection bias if the blinding of the outcome assessment was ensured and it was unlikely that the blinding could have been broken; or if there was no blinding or incomplete blinding, but the review authors judge that the outcome is not likely to be influenced by lack of blinding, or:
-
for patient‐reported outcomes in which the patient was the outcome assessor (e.g. pain, disability): there is a low risk of bias for outcome assessors if there is a low risk of bias for participant blinding (Boutron 2005);
-
for outcome criteria that are clinical or therapeutic events that will be determined by the interaction between patients and care providers (e.g. co‐interventions, length of hospitalisation, treatment failure), in which the care provider is the outcome assessor: there is a low risk of bias for outcome assessors if there is a low risk of bias for care providers (Boutron 2005);
-
for outcome criteria that are assessed from data from medical forms: there is a low risk of bias if the treatment or adverse effects of the treatment could not be noticed in the extracted data (Boutron 2005).
Incomplete outcome data (attrition bias)
Attrition bias due to amount, nature or handling of incomplete outcome data
There is a low risk of attrition bias if there were no missing outcome data; reasons for missing outcome data were unlikely to be related to the true outcome (for survival data, censoring unlikely to be introducing bias); missing outcome data were balanced in numbers, with similar reasons for missing data across groups; for dichotomous outcome data, the proportion of missing outcomes compared with the observed event risk was not enough to have a clinically relevant impact on the intervention effect estimate; for continuous outcome data, the plausible effect size (difference in means or standardised difference in means) among missing outcomes was not enough to have a clinically relevant impact on observed effect size, or missing data were imputed using appropriate methods (if drop‐outs are very large, imputation using even 'acceptable' methods may still suggest a high risk of bias) (van Tulder 2003). The percentage of withdrawals and dropouts should not exceed 20% for short‐term follow‐up and 30% for long‐term follow‐up and should not lead to substantial bias (these percentages are commonly used but arbitrary, not supported by literature) (van Tulder 2003).
Selective reporting (reporting bias)
Reporting bias due to selective outcome reporting
There is low risk of reporting bias if the study protocol is available and all of the study's pre‐specified (primary and secondary) outcomes that are of interest in the review have been reported in the pre‐specified way, or if the study protocol is not available but it is clear that the published reports include all expected outcomes, including those that were pre‐specified (convincing text of this nature may be uncommon).
There is a high risk of reporting bias if not all of the study's pre‐specified primary outcomes have been reported; one or more primary outcomes is reported using measurements, analysis methods or subsets of the data (e.g. subscales) that were not pre‐specified; one or more reported primary outcomes were not pre‐specified (unless clear justification for their reporting is provided, such as an unexpected adverse effect); one or more outcomes of interest in the review are reported incompletely so that they cannot be entered in a meta‐analysis; the study report fails to include results for a key outcome that would be expected to have been reported for such a study.
Group similarity at baseline (selection bias)
Bias due to dissimilarity at baseline for the most important prognostic indicators.
There is low risk of bias if groups are similar at baseline for demographic factors, value of main outcome measure(s), and important prognostic factors (examples in the field of back and neck pain are duration and severity of complaints, vocational status, percentage of patients with neurological symptoms) (van Tulder 2003).
Co‐interventions (performance bias)
Bias because co‐interventions were different across groups
There is low risk of bias if there were no co‐interventions or they were similar between the index and control groups (van Tulder 2003).
Compliance (performance bias)
Bias due to inappropriate compliance with interventions across groups
There is low risk of bias if compliance with the interventions was acceptable, based on the reported intensity or dosage, duration, number and frequency for both the index and control intervention(s). For single‐session interventions (e.g. surgery), this item is irrelevant (van Tulder 2003).
Intention‐to‐treat‐analysis
There is low risk of bias if all randomised patients were reported and analysed in the group to which they were allocated by randomisation.
Timing of outcome assessments (detection bias)
Bias because important outcomes were not measured at the same time across groups
There is low risk of bias if all important outcome assessments for all intervention groups were measured at the same time (van Tulder 2003).
Other bias
Bias due to problems not covered elsewhere in the table
There is a low risk of bias if the study appears to be free of other sources of bias not addressed elsewhere (e.g. study funding).
Appendix 3. GRADE criteria
The GRADE criteria were operationalised in the following way.
-
Limitations of the study refers to the risk of bias assessment of studies. Studies with more than 5 points on the risk of bias assessment were regarded as studies with a low risk of bias. If 75% or more of the studies scored above 5, this item was scored as: no limitations. If between 50% and 75% of the studies scored above 5, this was scored as: serious limitations. If less that 50% of the studies scored above 5: very serious limitations.
-
Consistency refers to the similarity of estimates of treatment effects for the outcome across studies. Study results were considered consistent if direction, effect size and statistical significance were sufficiently similar to lead to the same conclusions. Consistency in direction was defined as 75% or more of the studies showing either benefit or no effect of the workplace intervention. In the case of a benefit, consistency in effect size was defined as 75% or more of the studies showing a clinically important or unimportant effect. Minimal clinically relevant differences were derived from the original review as mentioned above in the quantitative analysis. Consistency in statistical significance was defined by the Chi2 test for heterogeneity.
-
Directness (generalisability) refers to the extent to which the workers, interventions, and outcomes in the studies were comparable to those defined in the inclusion criteria of the review. If there was uncertainty about generalisablity of the results, or if the results were more applicable to a specific population than a general population on work disability, serious or very serious limitations were assigned.
-
Precision of the evidence refers to the confidence in the results. It takes into account the number of studies, patients, and events; and width of the CIs for each outcome. Data were interpreted to be imprecise as multiple studies were combined in a meta‐analysis but the CI (confidence interval) was sufficiently wide that the estimate could either support or refute the effectiveness of the workplace intervention. In the case of imprecise data serious limitations were assigned. Serious limitations could also be assigned if data were judged to be sparse, that is if only one study was available for an outcome, or fewer than 75% of the studies presented data that could be included in the meta‐analysis.
-
Publication bias refers to the probability of selective publication of studies and outcomes.
The overall quality of the evidence for each outcome was the result of the combination of the assessments in all domains.

Forest plot of comparison: 7 Intense PC + CaU versus CaU only, subacute pain, outcome: 7.3 Time to return‐to‐work.
Forest plot of comparison: 11 Intense PC versus multidisciplinary exercise treatment, subacute pain, outcome: 11.1 Proportion off work short‐term follow‐up.
Forest plot of comparison: Intense PCP versus care as usual for workers with chronic back pain, outcome: Time to return‐to‐work at long‐term follow‐up

Forest plot of comparison: Intense PCP versus exercise programme for workers with chronic back pain, outcome: Time to return‐to‐work at intermediate‐term follow‐up.
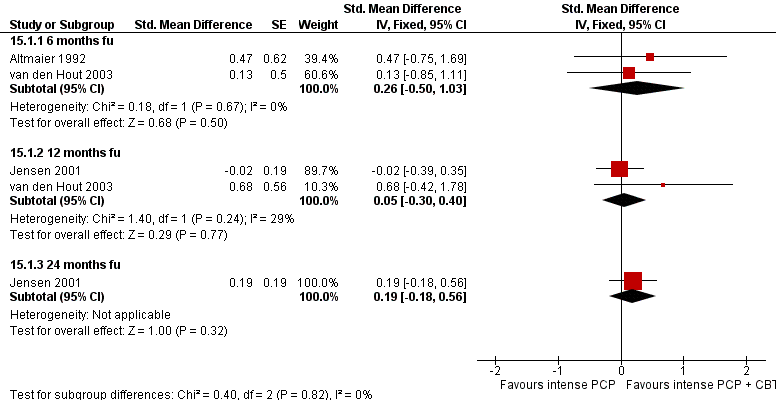
Forest plot of comparison: Intense PCP versus intense PCP with CBT for workers with chronic back pain, outcome: Time to return‐to‐work at long‐term follow‐up.
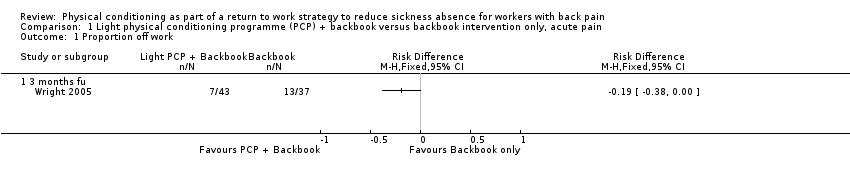
Comparison 1 Light physical conditioning programme (PCP) + backbook versus backbook intervention only, acute pain, Outcome 1 Proportion off work.

Comparison 2 Light physical conditioning programme (PCP) versus care as usual (CaU), acute pain, Outcome 1 Time to return to work long term follow up.

Comparison 3 Intense physical conditioning programme (PCP) versus care as usual (CaU), acute pain, Outcome 1 Proportion off work long term follow up.
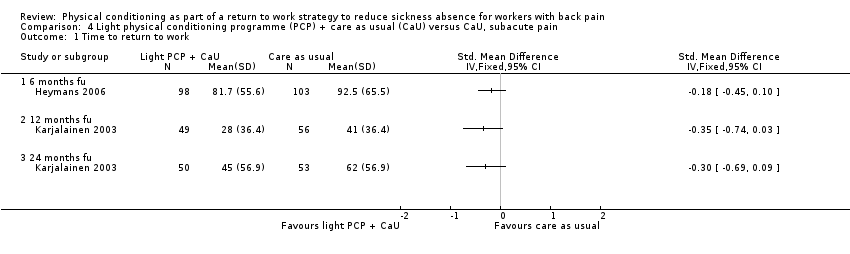
Comparison 4 Light physical conditioning programme (PCP) + care as usual (CaU) versus CaU, subacute pain, Outcome 1 Time to return to work.

Comparison 5 Light physical conditioning programme (PCP) + brief clinical intervention (CI) versus brief CI only, subacute pain, Outcome 1 Time to return to work.

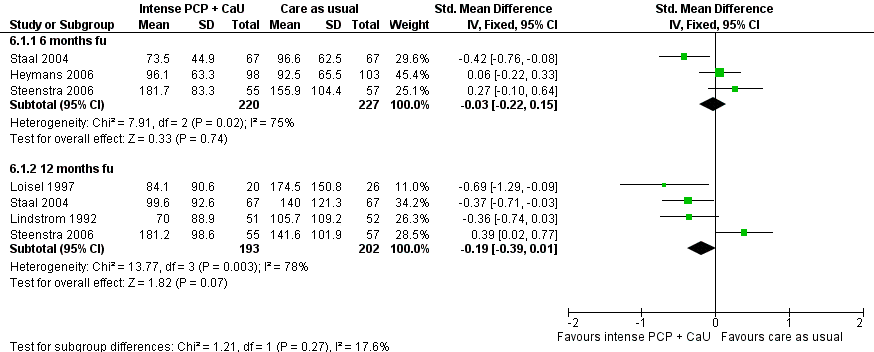
Comparison 6 Intense physical conditioning programme (PCP) + care as usual (CaU) versus CaU only, subacute pain, Outcome 1 Time to return to work.
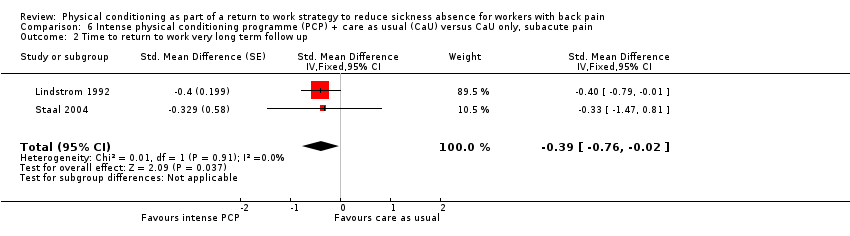
Comparison 6 Intense physical conditioning programme (PCP) + care as usual (CaU) versus CaU only, subacute pain, Outcome 2 Time to return to work very long term follow up.

Comparison 7 Intense physical conditioning programme (PCP) versus light PCP, subacute pain, Outcome 1 Time to return to work.

Comparison 8 Intense physical conditioning programme (PCP) versus cognitive intervention, subacute pain, Outcome 1 Time to return to work short term follow up.

Comparison 9 Intense physical conditioning programme (PCP) versus care as usual (CaU), subacute pain, Outcome 1 Time to return to work.

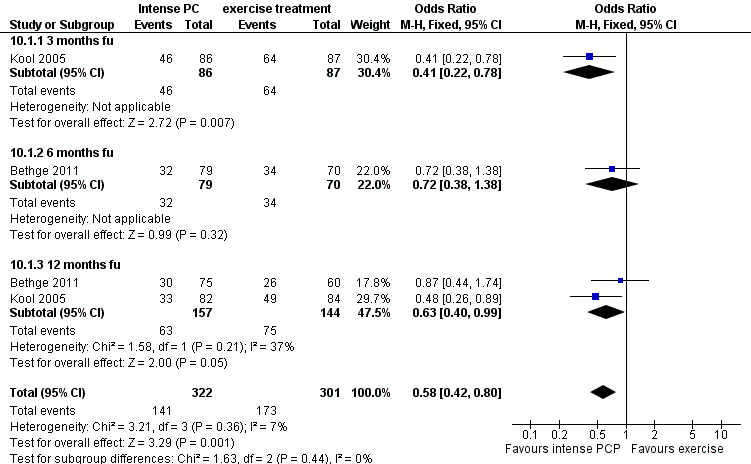
Comparison 10 Intense physical conditioning programme (PCP) versus multidisciplinary exercise treatment, subacute pain, Outcome 1 Proportion off work short term follow up.

Comparison 11 Light physical conditioning programme (PCP) versus care as usual (CaU), chronic pain, Outcome 1 Time to return to work.

Comparison 12 Intense physical conditioning programme (PCP) + care as usual (CaU) versus CaU only, chronic pain, Outcome 1 Time to Return to Work.

Comparison 13 Intense physical conditioning programme (PCP) versus care as usual (CaU), chronic pain, Outcome 1 Time to return to work.

Comparison 14 Intense physical conditioning programme (PCP) versus exercise program, chronic pain, Outcome 1 Proportion off work short term follow up.
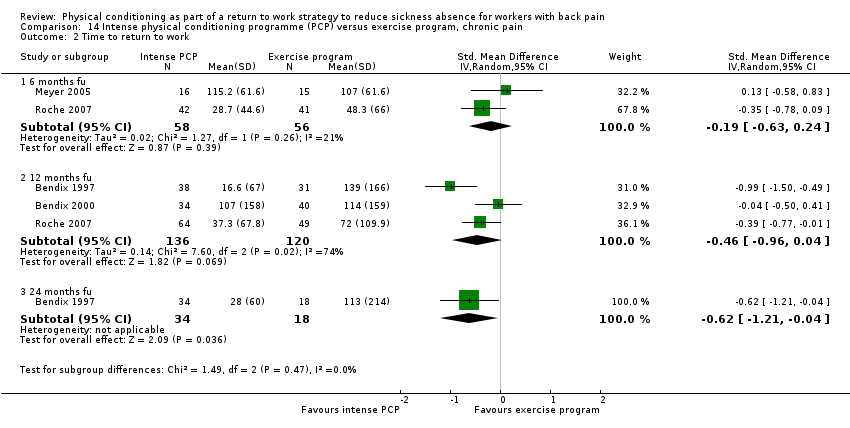
Comparison 14 Intense physical conditioning programme (PCP) versus exercise program, chronic pain, Outcome 2 Time to return to work.

Comparison 15 Intense physical conditioning programme (PCP) versus intense PCP + cognitive behavioural therapy (CBT), chronic pain, Outcome 1 Time to return to work.
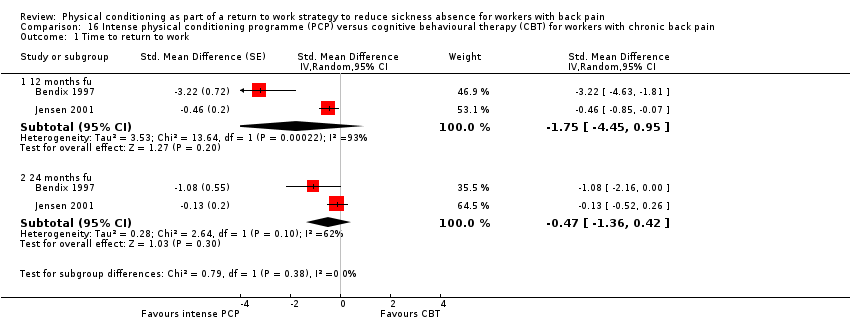
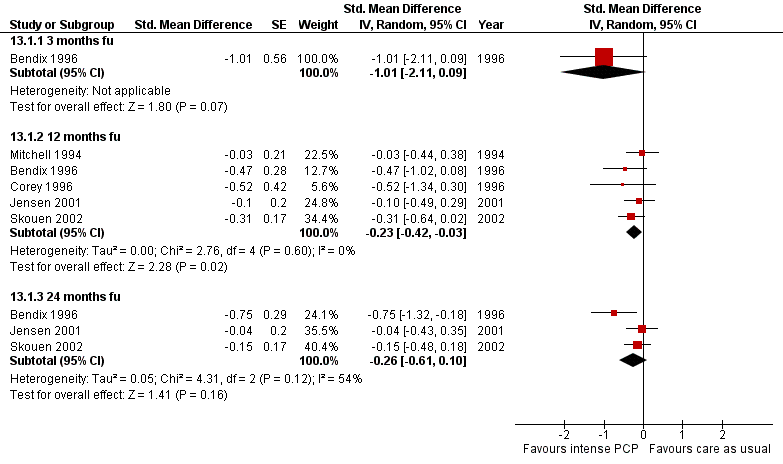
Comparison 16 Intense physical conditioning programme (PCP) versus cognitive behavioural therapy (CBT) for workers with chronic back pain, Outcome 1 Time to return to work.

Comparison 17 Intense physical conditioning programme (PCP) versus light PCP, chronic back pain, Outcome 1 Time to return to work.
| Time span of training | 5 wks | 4 wks | 18 weeks median duration | na | na | 2 wks |
| Number of sessions | 2 per week | 1 per week | after the interview, the participant was seen at least once, and four times on average | 2 | approx. 4 hrs at the start + 6 follow up or individual sessions over a period of 1 year | 1 examination + treatment initially then 3 per week |
| Length of sessions | 20 min | 120 min | 1‐2 hrs | 1‐1,5 hr | unclear | 1 hr |
| Full time | no | no | no | no | no | no |
| group or individual | individual | group | individual | individual | both | both |
| exercises | yes | yes | yes in advice | yes | yes, advice and programme | yes |
| work related exercises | yes | yes | yes in advice | yes | yes in advice | yes |
| operant conditioning behavioural approach | no | no | no | no, although intervention was based on graded activity programme | no | no |
| pain coping/ management | no | no | yes | no | no | no |
| back pain education | no | yes | yes | no | no | no |
| ergonomic advice or occupational training | no | yes | no | no | no | advice on how to modify physical activities specific to the individual's work situation |
| return‐to‐work advice | no | yes | yes | no | no | no |
| workplace visit | no | no | yes | yes | no (not for all individuals) | no |
| therapists involved | physiotherapist | physiotherapist, occupational physician | rehabilitation physician, specialist in clinical social medicine, physiotherapist, social worker, occupational therapist, case manager | physiotherapist, physician | physio therapist, nurse, psychologist | physiotherapist |
| other aspects | written compliance contract | CAU | brief clinical examination | CAU | no | CAU being a back book and advice on how to modify physical activities specific to the indivual's work situation |
| comparison | CAU | CAU/ intense PCP | brief clinical examination only | CAU | CAU / intense PCP | CAU being a back book and advice on how to modify physical activities specific to the individual's work situation ‐ only |
| Time span of training | 3 wks | 3 wks | 6 wks | 3 wks | 3 wks | 33 days | 3 wks | 8 wks |
| Number of sessions | 2 per day | 39 hrs per week + 3x6 hrs follow up | 135 hr in total | 39 hours per week + 3x6 hrs follow‐up | total of 82.2 hours of therapy | 6.5 hr per day | up to 41 | 2 per week |
| Length of sessions | ? | na | na | na | 1‐1.5 hrs | na | 15 min‐1hr | 1 hr |
| Full time | no | yes | yes | yes | yes | yes | no | no |
| group or individual | both | group | group | group | group | both | both | individual |
| exercises | yes | yes | yes | yes | yes | yes | yes | yes |
| work related exercises | yes | yes | yes | yes | yes | yes | yes | yes |
| operant conditioning behavioural approach | yes | yes | yes | yes | yes | yes | not clear | yes |
| pain coping/ management | yes | yes | yes | yes | unclear | yes | yes | no |
| back pain education | yes | yes | yes | yes | yes | yes | no | no |
| ergonomic advice or occupational training | no | occupational therapy and ergonomic training | occupational therapy and ergonomic training | occupational therapy and ergonomic training | no | no | occupational therapy | yes |
| return‐to‐work advice | no | no | no | no | yes | no | no | yes |
| workplace visit | no | no | no | no | no | no | no | no |
| therapists involved | multidisciplinary | multidisciplinary | multidisciplinary including physician, psychologist | occupational therapist, physician, psychologist,physical therapist, social worker | physician, social worker, psychologist, physical therapist | interdisciplinary programme | physiotherapist, occupational therapist, nurse, physician | physiotherapist |
| other aspects | vocational rehabilitation | recreation activities | aerobics, recreational activities | recreation activities | no | no | no | CAU |
| comparison | PCP + CBT | CAU | exercise therapy / pain management | outpatient intensive physical training | inpatient conventional musculoskeletal rehabilitation | CAU | CAU | CAU‐only/ light PCP |
| Time span of training | 4 wks | 3 wks | 12 wks | until RTW | 13 wks | 8 wks | 8 wks | 5 wks |
| Number of sessions | 6 sessions + 20 hrs exercise + 6 booster sessions | 4 hrs per day / 6 days a week | varying | approx. 11 with physical therapist, approx 10 self training sessions (3 per week) | 3,5 hr per day, 5 days a week | 6 hrs per day, 5 days a week | ||
| Lenght of sessions | ||||||||
| Full time | no | almost | no | no | unclear | almost | yes | yes |
| group or individual | both | group | individual | individual | unclear | both | group | group |
| exercises | yes | yes | yes | yes | yes | yes | yes | yes |
| work related exercises | yes | yes | yes | yes | yes | yes | yes | yes |
| operant conditioning behavioural approach | yes | no | yes | yes | yes | yes | yes | no |
| pain coping/ management | 2 didactic sessions on psychological aspects of pain + 2 sessions on medical aspects of pain | no | no | no | no | yes | no | no |
| back pain education | yes | no | no | yes | yes | no | yes | no |
| ergonomic advice or occupational training | 2 sessions on ergonomics | work simulation | yes | no | yes, participatory ergonomics evaluation | education in ergonomics | no | occupational therapy |
| return‐to‐work advice | yes, workplace visit + rehabilitation plan | no | yes | yes | yes | yes | no | no |
| workplace visit | yes | no | yes | yes | yes | yes | no | no |
| therapists involved | physician, physical therapist, psychologist, | rheumatologist, physical and occupational therapist, sports therapist, social worker, nurse | clinical occupational physician, medical specialist, physiotherapist | physical therapist | back pain specialist; multidisciplinary medical, ergonomic and rehabilitation staff | interdisciplinary:rehabilitation physicians, psychologist, social worker, occupational therapist, physiotherapist | unclear | specialist in physical medicine, physiotherapist, psychologist |
| other aspects | no | no | CAU | CAU | CAU | case‐manager recreational activities | no | no |
| comparison | CAU / CBT PCP + CBT | pain centred treatment | CAU‐only | CAU‐only | CAU‐only | exercise therapy | CAU | active individual therapy |
| Time span of training | 4 wks | max 3 months | 13 wks | 15 wks | 8 wks |
| Number of sessions | 5 per week for 4 weeks + follow‐up as in LMT | 2 per week until RTW | 2 per week 26 in total | 2‐3 per week | 28 |
| Lenght of sessions | 6 hr | 1 hr | 1 hr | 1 hr | 30‐90 min |
| Full time | almost | no | no | no | no |
| group or individual | both | individual | individual | group | both |
| exercises | yes | yes | yes | yes | yes |
| work related exercises | yes | yes | yes | not clear | yes |
| operant conditioning behavioural approach | yes | yes | yes | no | yes |
| pain/ coping management | no | no | no | no | no |
| back pain education | yes | no | no | no | yes |
| ergonomic advice or occupational training | yes | no | no | yes, training had a focus on ergonomic principles and functional tasks | yes, training by occupational therapist |
| return‐to‐work advice | no | yes | yes | no | yes |
| Workplace visit | no, occasional workplace intervention | no, but intervention was at workplace | no | no | yes, if necessary |
| therapists involved | physio therapist, nurse, psychologist | physiotherapist, occupational physician | physiotherapist, occupational physician | physical therapist | physiotherapist, occupational therapist, psychologist, occupational physician |
| other aspects | no | CAU/gradually increasing exercise, GP or occupational physician if workers wanted to | CAU/gradually increasing exercise | exercises accompanied by music | contact with patients' supervisor |
| comparison | CAU/ light PCP | CAU‐only | CAU‐only | CAU/ cognitive intervention | PCP + CBT |
| Study ID | 1 | 2 | 3 | 4 | 5 |
| + | ‐ | + | ‐ | + | |
| + | + | + | ‐ | + | |
| + | + | + | + | + | |
| + | + | + | ‐ | + | |
| + | + | + | ‐ | + | |
| + | + | ‐ | ‐ | + | |
| + | + | + | ‐ | + | |
| + | + | + | ‐ | + | |
| + | + | + | ‐ | + | |
| + | + | + | ‐ | + | |
| + | + | + | ‐ | + | |
| + | + | + | + | + | |
| + | + | + | + | + | |
| + | + | + | + | + | |
| + | + | + | + | + | |
| + | + | + | + | + | |
| + | + | + | ‐ | + | |
| + | + | + | ‐ | + | |
| + | + | + | + | + | |
| + | + | + | ‐ | + | |
| + | + | ‐ | ‐ | + | |
| + | + | + | ‐ | + | |
| + | + | + | ‐ | + | |
| + | + | + | ‐ | + | |
| + | + | + | ‐ | + |
| Outcome or subgroup title | No. of studies | No. of participants | Statistical method | Effect size |
| 1 Proportion off work Show forest plot | 1 | Risk Difference (M‐H, Fixed, 95% CI) | Totals not selected | |
| 1.1 3 months fu | 1 | Risk Difference (M‐H, Fixed, 95% CI) | 0.0 [0.0, 0.0] | |
| Outcome or subgroup title | No. of studies | No. of participants | Statistical method | Effect size |
| 1 Time to return to work long term follow up Show forest plot | 1 | 190 | Std. Mean Difference (IV, Fixed, 95% CI) | ‐0.02 [‐0.30, 0.27] |
| 1.1 12 months fu | 1 | 190 | Std. Mean Difference (IV, Fixed, 95% CI) | ‐0.02 [‐0.30, 0.27] |
| Outcome or subgroup title | No. of studies | No. of participants | Statistical method | Effect size |
| 1 Proportion off work long term follow up Show forest plot | 1 | 70 | Odds Ratio (M‐H, Fixed, 95% CI) | 0.22 [0.05, 1.06] |
| Outcome or subgroup title | No. of studies | No. of participants | Statistical method | Effect size |
| 1 Time to return to work Show forest plot | 2 | Std. Mean Difference (IV, Fixed, 95% CI) | Totals not selected | |
| 1.1 6 months fu | 1 | Std. Mean Difference (IV, Fixed, 95% CI) | 0.0 [0.0, 0.0] | |
| 1.2 12 months fu | 1 | Std. Mean Difference (IV, Fixed, 95% CI) | 0.0 [0.0, 0.0] | |
| 1.3 24 months fu | 1 | Std. Mean Difference (IV, Fixed, 95% CI) | 0.0 [0.0, 0.0] | |
| Outcome or subgroup title | No. of studies | No. of participants | Statistical method | Effect size |
| 1 Time to return to work Show forest plot | 1 | 351 | Std. Mean Difference (IV, Fixed, 95% CI) | 0.21 [0.00, 0.42] |
| 1.1 12 months fu | 1 | 351 | Std. Mean Difference (IV, Fixed, 95% CI) | 0.21 [0.00, 0.42] |
| Outcome or subgroup title | No. of studies | No. of participants | Statistical method | Effect size |
| 1 Time to return to work Show forest plot | 5 | Std. Mean Difference (IV, Fixed, 95% CI) | Subtotals only | |
| 1.1 6 months fu | 3 | 447 | Std. Mean Difference (IV, Fixed, 95% CI) | ‐0.03 [‐0.22, 0.15] |
| 1.2 12 months fu | 4 | 395 | Std. Mean Difference (IV, Fixed, 95% CI) | ‐0.19 [‐0.39, 0.01] |
| 2 Time to return to work very long term follow up Show forest plot | 2 | Std. Mean Difference (Fixed, 95% CI) | ‐0.39 [‐0.76, ‐0.02] | |
| Outcome or subgroup title | No. of studies | No. of participants | Statistical method | Effect size |
| 1 Time to return to work Show forest plot | 1 | Std. Mean Difference (IV, Random, 95% CI) | Totals not selected | |
| 1.1 6 months fu | 1 | Std. Mean Difference (IV, Random, 95% CI) | 0.0 [0.0, 0.0] | |
| Outcome or subgroup title | No. of studies | No. of participants | Statistical method | Effect size |
| 1 Time to return to work short term follow up Show forest plot | 1 | 64 | Std. Mean Difference (IV, Fixed, 95% CI) | ‐0.10 [‐0.59, 0.40] |
| Outcome or subgroup title | No. of studies | No. of participants | Statistical method | Effect size |
| 1 Time to return to work Show forest plot | 1 | 59 | Mean Difference (IV, Fixed, 95% CI) | ‐7.20 [‐43.64, 29.24] |
| 1.1 3 months fu | 1 | 59 | Mean Difference (IV, Fixed, 95% CI) | ‐7.20 [‐43.64, 29.24] |
| Outcome or subgroup title | No. of studies | No. of participants | Statistical method | Effect size |
| 1 Proportion off work short term follow up Show forest plot | 2 | 623 | Odds Ratio (M‐H, Fixed, 95% CI) | 0.58 [0.42, 0.80] |
| 1.1 3 months fu | 1 | 173 | Odds Ratio (M‐H, Fixed, 95% CI) | 0.41 [0.22, 0.78] |
| 1.2 6 months fu | 1 | 149 | Odds Ratio (M‐H, Fixed, 95% CI) | 0.72 [0.38, 1.38] |
| 1.3 12 months fu | 2 | 301 | Odds Ratio (M‐H, Fixed, 95% CI) | 0.63 [0.40, 0.99] |
| Outcome or subgroup title | No. of studies | No. of participants | Statistical method | Effect size |
| 1 Time to return to work Show forest plot | 1 | Std. Mean Difference (IV, Fixed, 95% CI) | Totals not selected | |
| 1.1 12 months fu | 1 | Std. Mean Difference (IV, Fixed, 95% CI) | 0.0 [0.0, 0.0] | |
| 1.2 24 months fu | 1 | Std. Mean Difference (IV, Fixed, 95% CI) | 0.0 [0.0, 0.0] | |
| Outcome or subgroup title | No. of studies | No. of participants | Statistical method | Effect size |
| 1 Time to Return to Work Show forest plot | 1 | Std. Mean Difference (Fixed, 95% CI) | ‐4.42 [‐5.06, ‐3.79] | |
| 1.1 12 months fu | 1 | Std. Mean Difference (Fixed, 95% CI) | ‐4.42 [‐5.06, ‐3.79] | |
| Outcome or subgroup title | No. of studies | No. of participants | Statistical method | Effect size |
| 1 Time to return to work Show forest plot | 5 | Std. Mean Difference (Random, 95% CI) | Subtotals only | |
| 1.1 3 months fu | 1 | Std. Mean Difference (Random, 95% CI) | ‐1.01 [‐2.11, 0.09] | |
| 1.2 12 months fu | 5 | Std. Mean Difference (Random, 95% CI) | ‐0.23 [‐0.42, ‐0.03] | |
| 1.3 24 months fu | 3 | Std. Mean Difference (Random, 95% CI) | ‐0.26 [‐0.61, 0.10] | |
| Outcome or subgroup title | No. of studies | No. of participants | Statistical method | Effect size |
| 1 Proportion off work short term follow up Show forest plot | 1 | 136 | Odds Ratio (M‐H, Fixed, 95% CI) | 1.0 [0.37, 2.70] |
| 2 Time to return to work Show forest plot | 4 | Std. Mean Difference (IV, Random, 95% CI) | Subtotals only | |
| 2.1 6 months fu | 2 | 114 | Std. Mean Difference (IV, Random, 95% CI) | ‐0.19 [‐0.63, 0.24] |
| 2.2 12 months fu | 3 | 256 | Std. Mean Difference (IV, Random, 95% CI) | ‐0.46 [‐0.96, 0.04] |
| 2.3 24 months fu | 1 | 52 | Std. Mean Difference (IV, Random, 95% CI) | ‐0.62 [‐1.21, ‐0.04] |
| Outcome or subgroup title | No. of studies | No. of participants | Statistical method | Effect size |
| 1 Time to return to work Show forest plot | 3 | Std. Mean Difference (Fixed, 95% CI) | Subtotals only | |
| 1.1 6 months fu | 2 | Std. Mean Difference (Fixed, 95% CI) | 0.26 [‐0.50, 1.03] | |
| 1.2 12 months fu | 2 | Std. Mean Difference (Fixed, 95% CI) | 0.05 [‐0.30, 0.40] | |
| 1.3 24 months fu | 1 | Std. Mean Difference (Fixed, 95% CI) | 0.19 [‐0.18, 0.56] | |
| Outcome or subgroup title | No. of studies | No. of participants | Statistical method | Effect size |
| 1 Time to return to work Show forest plot | 2 | Std. Mean Difference (Random, 95% CI) | Subtotals only | |
| 1.1 12 months fu | 2 | Std. Mean Difference (Random, 95% CI) | ‐1.75 [‐4.45, 0.95] | |
| 1.2 24 months fu | 2 | Std. Mean Difference (Random, 95% CI) | ‐0.47 [‐1.36, 0.42] | |
| Outcome or subgroup title | No. of studies | No. of participants | Statistical method | Effect size |
| 1 Time to return to work Show forest plot | 1 | Std. Mean Difference (IV, Fixed, 95% CI) | Totals not selected | |
| 1.1 12 months fu | 1 | Std. Mean Difference (IV, Fixed, 95% CI) | 0.0 [0.0, 0.0] | |
| 1.2 24 months fu | 1 | Std. Mean Difference (IV, Fixed, 95% CI) | 0.0 [0.0, 0.0] | |