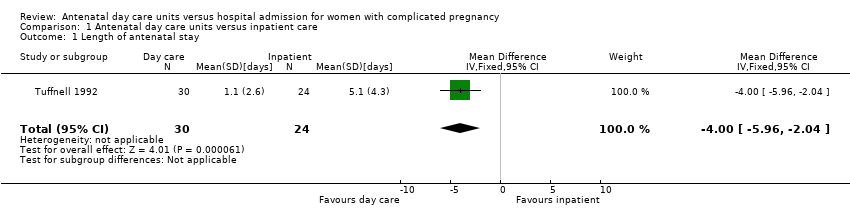
| 1 Length of antenatal stay Show forest plot | 1 | 54 | Mean Difference (IV, Fixed, 95% CI) | ‐2.00 [‐5.96, ‐2.04] |
|
| 2 Women admitted antenatally Show forest plot | 2 | 109 | Risk Ratio (M‐H, Fixed, 95% CI) | 0.46 [0.34, 0.62] |
|
| 3 Outpatient hospital visits Show forest plot | 1 | 54 | Mean Difference (IV, Fixed, 95% CI) | 1.5 [0.54, 2.46] |
|
| 4 Total antenatal care episodes Show forest plot | 1 | 395 | Mean Difference (IV, Fixed, 95% CI) | 0.41 [0.05, 0.77] |
|
| 5 Antenatal hospital stay for less than three days (as either inpatient or staying on the day unit) Show forest plot | 1 | 55 | Risk Ratio (M‐H, Fixed, 95% CI) | 0.95 [0.64, 1.41] |
|
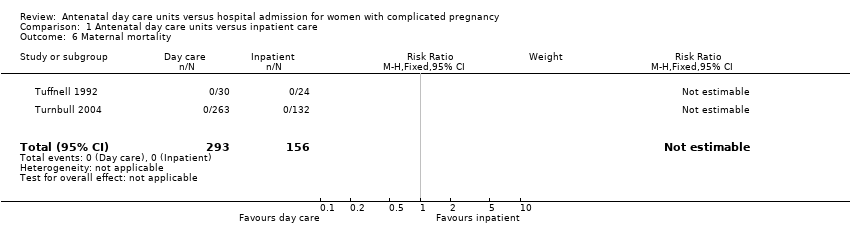
| 6 Maternal mortality Show forest plot | 2 | 449 | Risk Ratio (M‐H, Fixed, 95% CI) | 0.0 [0.0, 0.0] |
|
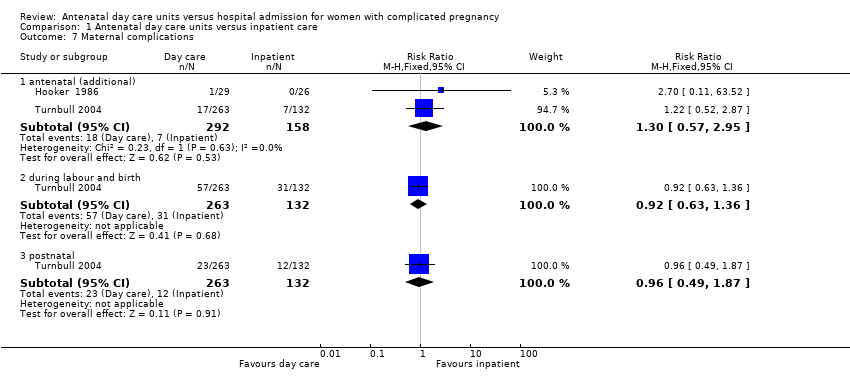
| 7 Maternal complications Show forest plot | 2 | | Risk Ratio (M‐H, Fixed, 95% CI) | Subtotals only |
|
| 7.1 antenatal (additional) | 2 | 450 | Risk Ratio (M‐H, Fixed, 95% CI) | 1.30 [0.57, 2.95] |
| 7.2 during labour and birth | 1 | 395 | Risk Ratio (M‐H, Fixed, 95% CI) | 0.92 [0.63, 1.36] |
| 7.3 postnatal | 1 | 395 | Risk Ratio (M‐H, Fixed, 95% CI) | 0.96 [0.49, 1.87] |
| 8 Maternal high blood pressure Show forest plot | 1 | | Risk Ratio (M‐H, Fixed, 95% CI) | Subtotals only |
|
| 8.1 > 140/90 mmHg at birth | 1 | 395 | Risk Ratio (M‐H, Fixed, 95% CI) | 0.98 [0.82, 1.17] |
| 8.2 requiring urgent assessment (> 160 mmHg) | 1 | 395 | Risk Ratio (M‐H, Fixed, 95% CI) | 0.69 [0.38, 1.27] |
| 8.3 medical emergency (> 160/110 mmHg) at birth | 1 | 395 | Risk Ratio (M‐H, Fixed, 95% CI) | 0.68 [0.32, 1.45] |
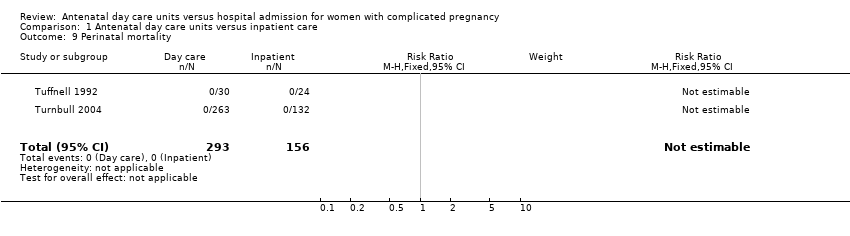
| 9 Perinatal mortality Show forest plot | 2 | 449 | Risk Ratio (M‐H, Fixed, 95% CI) | 0.0 [0.0, 0.0] |
|
| 10 Apgar score at five minutes Show forest plot | 1 | 54 | Mean Difference (IV, Fixed, 95% CI) | 0.0 [‐0.29, 0.29] |
|
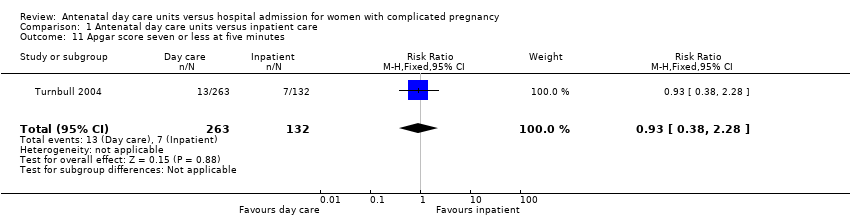
| 11 Apgar score seven or less at five minutes Show forest plot | 1 | 395 | Risk Ratio (M‐H, Fixed, 95% CI) | 0.93 [0.38, 2.28] |
|
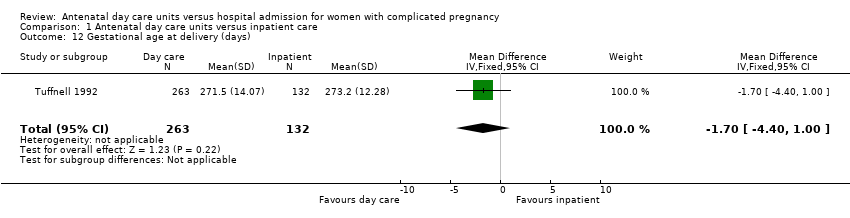
| 12 Gestational age at delivery (days) Show forest plot | 1 | 395 | Mean Difference (IV, Fixed, 95% CI) | ‐1.70 [‐4.40, 1.00] |
|
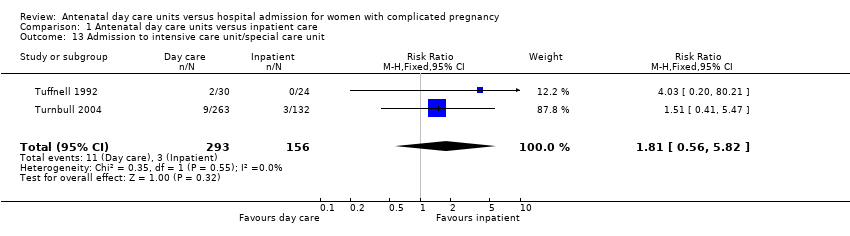
| 13 Admission to intensive care unit/special care unit Show forest plot | 2 | 449 | Risk Ratio (M‐H, Fixed, 95% CI) | 1.81 [0.56, 5.82] |
|
| 14 Birthweight (grams) Show forest plot | 2 | 448 | Mean Difference (IV, Fixed, 95% CI) | ‐26.30 [‐135.92, 83.31] |
|
| 15 Postnatal stay Show forest plot | 2 | 449 | Mean Difference (IV, Fixed, 95% CI) | 0.14 [‐0.18, 0.47] |
|
| 16 Women requiring readmission after discharge (postnatal) Show forest plot | 1 | 395 | Risk Ratio (M‐H, Fixed, 95% CI) | 0.56 [0.22, 1.43] |
|
| 17 Women visiting emergency department after discharge (postnatal) Show forest plot | 1 | 395 | Risk Ratio (M‐H, Fixed, 95% CI) | 0.68 [0.35, 1.32] |
|
| 18 Induction/augmentation of labour Show forest plot | 2 | | Risk Ratio (M‐H, Random, 95% CI) | Subtotals only |
|
| 18.1 Induction of labour | 1 | 54 | Risk Ratio (M‐H, Random, 95% CI) | 0.43 [0.22, 0.83] |
| 18.2 Induction or augmentation of labour | 1 | 395 | Risk Ratio (M‐H, Random, 95% CI) | 0.94 [0.79, 1.13] |
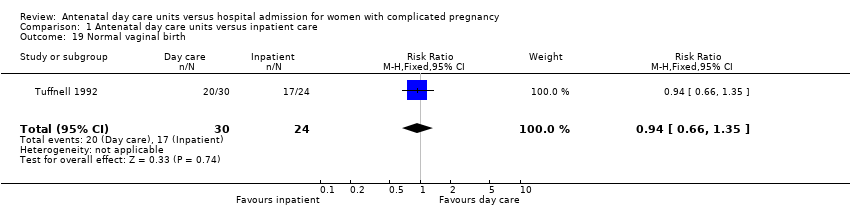
| 19 Normal vaginal birth Show forest plot | 1 | 54 | Risk Ratio (M‐H, Fixed, 95% CI) | 0.94 [0.66, 1.35] |
|
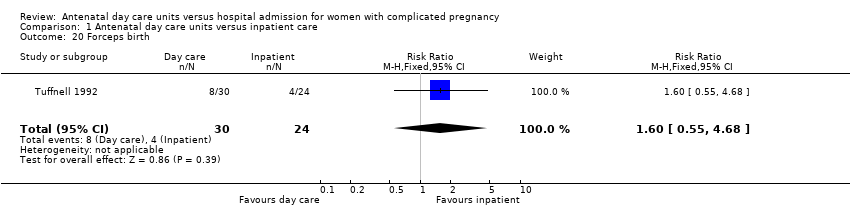
| 20 Forceps birth Show forest plot | 1 | 54 | Risk Ratio (M‐H, Fixed, 95% CI) | 1.6 [0.55, 4.68] |
|
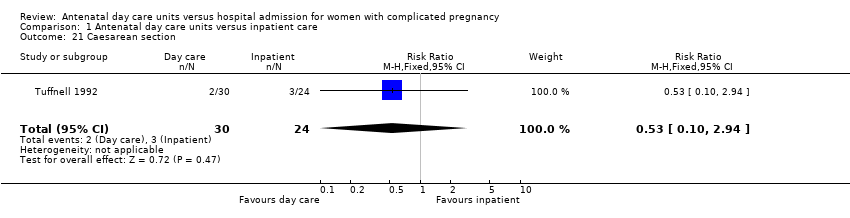
| 21 Caesarean section Show forest plot | 1 | 54 | Risk Ratio (M‐H, Fixed, 95% CI) | 0.53 [0.10, 2.94] |
|
| 22 Dissatisfaction with care: "spent too much time in hospital" Show forest plot | 1 | 45 | Risk Ratio (M‐H, Fixed, 95% CI) | 0.35 [0.08, 1.62] |
|
| 23 Dissatisfaction with care: "I am satisfied with the care I received" (number disagreeing or not sure) Show forest plot | 1 | 350 | Risk Ratio (M‐H, Fixed, 95% CI) | 0.40 [0.18, 0.88] |
|
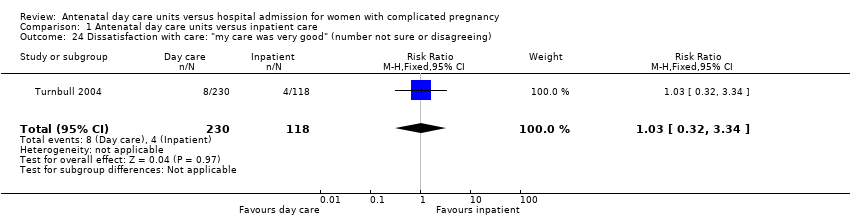
| 24 Dissatisfaction with care: "my care was very good" (number not sure or disagreeing) Show forest plot | 1 | 348 | Risk Ratio (M‐H, Fixed, 95% CI) | 1.03 [0.32, 3.34] |
|
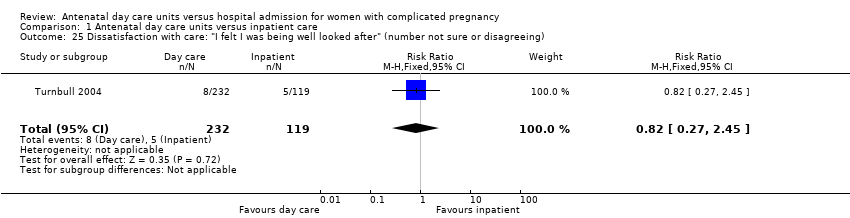
| 25 Dissatisfaction with care: "I felt I was being well looked after" (number not sure or disagreeing) Show forest plot | 1 | 351 | Risk Ratio (M‐H, Fixed, 95% CI) | 0.82 [0.27, 2.45] |
|
| 26 Average total length of stay (antenatal, intrapartum, postnatal) all cases (mothers and babies) Show forest plot | 1 | 395 | Mean Difference (IV, Fixed, 95% CI) | ‐1.31 [‐2.36, ‐0.26] |
|
| 27 Public health cost: average total cost (all cases, includes mothers and babies)(Australian $s) Show forest plot | 1 | 395 | Mean Difference (IV, Fixed, 95% CI) | 415.10 [‐603.86, 1434.06] |
|