Unidades de atención prenatal diurna versus ingreso al hospital para mujeres con complicaciones en el embarazo
Referencias
References to studies included in this review
References to studies excluded from this review
Additional references
References to other published versions of this review
Characteristics of studies
Characteristics of included studies [ordered by study ID]
Ir a:
| Methods | RCT. | |
| Participants | 55 women with raised blood pressure and, or pre‐eclampsia, who "would normally have been admitted to hospital for monitoring blood pressure... provided that her condition was not so severe that admission was mandatory". Setting: London hospital, UK, 1984. | |
| Interventions | Intervention group: admission to the day care unit (a side ward of the obstetric unit) with 2‐hourly blood pressure monitoring. Comparison group: hospital admission. | |
| Outcomes | Maternal and perinatal morbidity and mortality, Apgar score, subsequent management. | |
| Notes | Published and unpublished data were used for data extraction. | |
| Risk of bias | ||
| Bias | Authors' judgement | Support for judgement |
| Adequate sequence generation? | Unclear risk | "Allocated at random." |
| Allocation concealment? | Unclear risk | No information provided. |
| Blinding? | High risk | Different care management. |
| Blinding? | High risk | |
| Blinding? | High risk | |
| Incomplete outcome data addressed? | Unclear risk | 55 women were randomised. It was not clear in the results whether all women were accounted for (in the unpublished paper 1 woman with serious morbidity who was not followed up in the study hospital was re‐included in our analyses). |
| Free of selective reporting? | Unclear risk | Data were derived from a short abstract and unpublished data, little information was provided. |
| Free of other bias? | Unclear risk | The mean diastolic blood pressure at baseline was higher in the day unit group: 98 versus 94 mm Hg in the comparison group. |
| Methods | RCT. Women were informed of group allocation at recruitment (Zelen's pre‐consent randomisation). | |
| Participants | 54 out of 59 eligible women were enrolled in the study and randomised. 30 women were enrolled in the day care group, 24 in the control group. Inclusion criteria: women presenting at 26 weeks of pregnancy or later with non‐proteinuric hypertension (diastolic BP > 90 mm Hg and/or systolic BP >150 mm Hg for 2 readings at least 15 minutes apart). Exclusion criteria: women that had had a previous admission to hospital during the index pregnancy and women with proteinuria or with a diastolic BP > 105 mm Hg or systolic BP > 170 mm Hg. Setting: hospital in Leeds, UK in 1989. All women randomised completed the trial. | |
| Interventions | Intervention group: patients referred to the day unit were seen the morning after referral. 5 BP readings were made; urine was checked for protein; platelet count and serum urate concentration were measured; and a cardiotocograph was done. Doppler waveform analyses were done if considered necessary by the clinician. After each visit the woman was reviewed, and further visits were arranged according to perceived clinical need; either discharged back to clinic, followed up in the day unit, or admitted to hospital. | |
| Outcomes | A record was kept of the woman's blood pressure, weight and stage of gestation at referral, and the action taken after randomisation. Outpatient attendance and admissions and the proportion of time in hospital were recorded prospectively from day of entry to the study to delivery. Clinical complications, the method of management, and labour and delivery details were recorded. Patient satisfaction was assessed by a confidential postal questionnaire sent to all women 4 to 6 weeks after delivery. | |
| Notes | Economic analyses were performed but not published. Sample size of 25 women in each arm of the study would have an 80% chance of detecting a 50% reduction in duration of stay at P < 0.05 with a 1‐tailed test. 5 eligible women did not enter the study, and were not randomised, because the referring doctors preferred to use the day care unit. | |
| Risk of bias | ||
| Bias | Authors' judgement | Support for judgement |
| Adequate sequence generation? | Unclear risk | Decribed as "simple randomisation". |
| Allocation concealment? | Low risk | Sealed opaque sequentially numbered envelopes opened by midwife who had had no previous contact with the women. |
| Blinding? | High risk | Care options were discussed with the women (Zelen randomisation ‐ randomisation before consent, no women withdrew after randomisation). |
| Blinding? | High risk | Different care protocols. |
| Blinding? | High risk | Case notes would have revealed group allocation. |
| Incomplete outcome data addressed? | Unclear risk | Full data available for outcomes collected during the antenatal period and for delivery. 9 women, 3 in the control group and 6 in the intervention group, did not return postal questionnaires about patient satisfaction (17% attrition) which was completed 4‐6 weeks after delivery. |
| Free of selective reporting? | Low risk | None apparent. Non‐significant findings reported. |
| Free of other bias? | Unclear risk | The mean systolic BP was slightly higher in the comparison group (day care group mean 140 (SD 8) comparison group mean 134 (SD 9). |
| Methods | Parallel RCT; Zelen design with double consent. | |
| Participants | 395 women being admitted to the day care unit as an alternative to hospital admission. Inclusion criteria: women with 3 clinical disorders (proteinuric hypertension, non‐proteinuric hypertension or PPROM after 28 weeks) for which there was no clear clinical indication for inpatient admission or any indication of fetal compromise. A woman with PPROM at 28 weeks' gestation or later was considered for inclusion if initial assessment indicated that labour was not imminent, there were no signs of infection or haemorrhage, she lived within 40 minutes of the hospital and she had been an inpatient for less than a week. (Indications for immediate admission: systolic blood pressure > 160 mmHg, diastolic blood pressure > 110 mmHg, proteinuria of +++ or more on dipstick testing; any clinical indication of irritability of the central nervous system or splanchnic congestion; any biochemical signs of organ dysfunction (such as abnormal liver or renal function test results or evidence of haemolysis or thrombocytopenia)). Exclusion criteria: women presenting for cardiotocography alone were excluded; also multiple pregnancy, inability to communicate in English, and previous admission in the current pregnancy for the presenting complication. Setting: tertiary women's hospital, Adelaide, Australia. | |
| Interventions | Intervention group: day care unit. Unit with sitting and dining areas and a "deinstitutionalised environment". Families were able to accompany women. The unit was open between 09.00 to 17.00 hrs. Tests were initiated on admission with review after 2‐3hours. Comparison group: admission to medical ward with limited visiting hours and a stay of at least 1 night. | |
| Outcomes | Clinical outcomes, maternal satisfaction with care and psychological wellbeing (questionnaires 4 days after randomisation and 7 weeks post delivery). Economic data. | |
| Notes | ||
| Risk of bias | ||
| Bias | Authors' judgement | Support for judgement |
| Adequate sequence generation? | Low risk | External randomisation by computer‐generated sequence. |
| Allocation concealment? | Low risk | Third party telephone randomisation (Zelen method, patients randomised before final consent). |
| Blinding? | High risk | Women aware of treatment alternatives. |
| Blinding? | High risk | Different care packages. |
| Blinding? | High risk | Some data extraction from notes was carried out by midwives not providing care but the notes are likely to have included details of management. |
| Incomplete outcome data addressed? | Low risk | 26 women (7%) did not receive care according to the allocation but they were analysed by randomisation group. Low rates of attrition for outcomes collected from notes (< 5%). The response rate for women's questionnaires 4 days post randomisation was relatively high (approximately 88%). |
| Free of selective reporting? | Low risk | None apparent, but pre‐specified outcomes were very broad (e.g. that day care units would result in "no difference in clinical outcome"). |
| Free of other bias? | Low risk | Both groups had similar baseline characteristics, although there were slightly more smokers in the comparison group (14.4%) compared with the day care group (12.5%). |
BP: blood pressure
hrs: hours
mmHg: millimetres of mercury
PPROM: premature, prelabour rupture of the membranes
RCT: randomised controlled trial
SD: standard deviation
Characteristics of excluded studies [ordered by study ID]
Ir a:
| Study | Reason for exclusion |
| This study compared inpatient versus outpatient management of raised diastolic blood pressure. The inpatient group were admitted on the day of recruitment to the study or on the next day. The intervention group included 2 groups of women who were managed in different ways: (i) women were referred to a day care unit where they had a protocol for monitoring women's condition including urine analysis and blood pressure checks and 4 hours' bed rest, OR (ii) women were assessed in the antenatal clinic which had no facilities for bed rest, cardiotography or ultrasound. Women in both groups were given urine testing equipment to use on discharge home. The study was excluded as separate results were not provided for women attending the day care unit. It was not clear how many women in the outpatient group attended the day care unit or whether women in the two outpatient groups had similar characteristics. |
Data and analyses
| Outcome or subgroup title | No. of studies | No. of participants | Statistical method | Effect size |
| 1 Length of antenatal stay Show forest plot | 1 | 54 | Mean Difference (IV, Fixed, 95% CI) | ‐2.00 [‐5.96, ‐2.04] |
| Analysis 1.1  Comparison 1 Antenatal day care units versus inpatient care, Outcome 1 Length of antenatal stay. | ||||
| 2 Women admitted antenatally Show forest plot | 2 | 109 | Risk Ratio (M‐H, Fixed, 95% CI) | 0.46 [0.34, 0.62] |
| Analysis 1.2  Comparison 1 Antenatal day care units versus inpatient care, Outcome 2 Women admitted antenatally. | ||||
| 3 Outpatient hospital visits Show forest plot | 1 | 54 | Mean Difference (IV, Fixed, 95% CI) | 1.5 [0.54, 2.46] |
| Analysis 1.3  Comparison 1 Antenatal day care units versus inpatient care, Outcome 3 Outpatient hospital visits. | ||||
| 4 Total antenatal care episodes Show forest plot | 1 | 395 | Mean Difference (IV, Fixed, 95% CI) | 0.41 [0.05, 0.77] |
| Analysis 1.4  Comparison 1 Antenatal day care units versus inpatient care, Outcome 4 Total antenatal care episodes. | ||||
| 5 Antenatal hospital stay for less than three days (as either inpatient or staying on the day unit) Show forest plot | 1 | 55 | Risk Ratio (M‐H, Fixed, 95% CI) | 0.95 [0.64, 1.41] |
| Analysis 1.5  Comparison 1 Antenatal day care units versus inpatient care, Outcome 5 Antenatal hospital stay for less than three days (as either inpatient or staying on the day unit). | ||||
| 6 Maternal mortality Show forest plot | 2 | 449 | Risk Ratio (M‐H, Fixed, 95% CI) | 0.0 [0.0, 0.0] |
| Analysis 1.6  Comparison 1 Antenatal day care units versus inpatient care, Outcome 6 Maternal mortality. | ||||
| 7 Maternal complications Show forest plot | 2 | Risk Ratio (M‐H, Fixed, 95% CI) | Subtotals only | |
| Analysis 1.7  Comparison 1 Antenatal day care units versus inpatient care, Outcome 7 Maternal complications. | ||||
| 7.1 antenatal (additional) | 2 | 450 | Risk Ratio (M‐H, Fixed, 95% CI) | 1.30 [0.57, 2.95] |
| 7.2 during labour and birth | 1 | 395 | Risk Ratio (M‐H, Fixed, 95% CI) | 0.92 [0.63, 1.36] |
| 7.3 postnatal | 1 | 395 | Risk Ratio (M‐H, Fixed, 95% CI) | 0.96 [0.49, 1.87] |
| 8 Maternal high blood pressure Show forest plot | 1 | Risk Ratio (M‐H, Fixed, 95% CI) | Subtotals only | |
| Analysis 1.8  Comparison 1 Antenatal day care units versus inpatient care, Outcome 8 Maternal high blood pressure. | ||||
| 8.1 > 140/90 mmHg at birth | 1 | 395 | Risk Ratio (M‐H, Fixed, 95% CI) | 0.98 [0.82, 1.17] |
| 8.2 requiring urgent assessment (> 160 mmHg) | 1 | 395 | Risk Ratio (M‐H, Fixed, 95% CI) | 0.69 [0.38, 1.27] |
| 8.3 medical emergency (> 160/110 mmHg) at birth | 1 | 395 | Risk Ratio (M‐H, Fixed, 95% CI) | 0.68 [0.32, 1.45] |
| 9 Perinatal mortality Show forest plot | 2 | 449 | Risk Ratio (M‐H, Fixed, 95% CI) | 0.0 [0.0, 0.0] |
| Analysis 1.9  Comparison 1 Antenatal day care units versus inpatient care, Outcome 9 Perinatal mortality. | ||||
| 10 Apgar score at five minutes Show forest plot | 1 | 54 | Mean Difference (IV, Fixed, 95% CI) | 0.0 [‐0.29, 0.29] |
| Analysis 1.10  Comparison 1 Antenatal day care units versus inpatient care, Outcome 10 Apgar score at five minutes. | ||||
| 11 Apgar score seven or less at five minutes Show forest plot | 1 | 395 | Risk Ratio (M‐H, Fixed, 95% CI) | 0.93 [0.38, 2.28] |
| Analysis 1.11  Comparison 1 Antenatal day care units versus inpatient care, Outcome 11 Apgar score seven or less at five minutes. | ||||
| 12 Gestational age at delivery (days) Show forest plot | 1 | 395 | Mean Difference (IV, Fixed, 95% CI) | ‐1.70 [‐4.40, 1.00] |
| Analysis 1.12  Comparison 1 Antenatal day care units versus inpatient care, Outcome 12 Gestational age at delivery (days). | ||||
| 13 Admission to intensive care unit/special care unit Show forest plot | 2 | 449 | Risk Ratio (M‐H, Fixed, 95% CI) | 1.81 [0.56, 5.82] |
| Analysis 1.13  Comparison 1 Antenatal day care units versus inpatient care, Outcome 13 Admission to intensive care unit/special care unit. | ||||
| 14 Birthweight (grams) Show forest plot | 2 | 448 | Mean Difference (IV, Fixed, 95% CI) | ‐26.30 [‐135.92, 83.31] |
| Analysis 1.14  Comparison 1 Antenatal day care units versus inpatient care, Outcome 14 Birthweight (grams). | ||||
| 15 Postnatal stay Show forest plot | 2 | 449 | Mean Difference (IV, Fixed, 95% CI) | 0.14 [‐0.18, 0.47] |
| Analysis 1.15  Comparison 1 Antenatal day care units versus inpatient care, Outcome 15 Postnatal stay. | ||||
| 16 Women requiring readmission after discharge (postnatal) Show forest plot | 1 | 395 | Risk Ratio (M‐H, Fixed, 95% CI) | 0.56 [0.22, 1.43] |
| Analysis 1.16  Comparison 1 Antenatal day care units versus inpatient care, Outcome 16 Women requiring readmission after discharge (postnatal). | ||||
| 17 Women visiting emergency department after discharge (postnatal) Show forest plot | 1 | 395 | Risk Ratio (M‐H, Fixed, 95% CI) | 0.68 [0.35, 1.32] |
| Analysis 1.17  Comparison 1 Antenatal day care units versus inpatient care, Outcome 17 Women visiting emergency department after discharge (postnatal). | ||||
| 18 Induction/augmentation of labour Show forest plot | 2 | Risk Ratio (M‐H, Random, 95% CI) | Subtotals only | |
| Analysis 1.18  Comparison 1 Antenatal day care units versus inpatient care, Outcome 18 Induction/augmentation of labour. | ||||
| 18.1 Induction of labour | 1 | 54 | Risk Ratio (M‐H, Random, 95% CI) | 0.43 [0.22, 0.83] |
| 18.2 Induction or augmentation of labour | 1 | 395 | Risk Ratio (M‐H, Random, 95% CI) | 0.94 [0.79, 1.13] |
| 19 Normal vaginal birth Show forest plot | 1 | 54 | Risk Ratio (M‐H, Fixed, 95% CI) | 0.94 [0.66, 1.35] |
| Analysis 1.19  Comparison 1 Antenatal day care units versus inpatient care, Outcome 19 Normal vaginal birth. | ||||
| 20 Forceps birth Show forest plot | 1 | 54 | Risk Ratio (M‐H, Fixed, 95% CI) | 1.6 [0.55, 4.68] |
| Analysis 1.20  Comparison 1 Antenatal day care units versus inpatient care, Outcome 20 Forceps birth. | ||||
| 21 Caesarean section Show forest plot | 1 | 54 | Risk Ratio (M‐H, Fixed, 95% CI) | 0.53 [0.10, 2.94] |
| Analysis 1.21  Comparison 1 Antenatal day care units versus inpatient care, Outcome 21 Caesarean section. | ||||
| 22 Dissatisfaction with care: "spent too much time in hospital" Show forest plot | 1 | 45 | Risk Ratio (M‐H, Fixed, 95% CI) | 0.35 [0.08, 1.62] |
| Analysis 1.22  Comparison 1 Antenatal day care units versus inpatient care, Outcome 22 Dissatisfaction with care: "spent too much time in hospital". | ||||
| 23 Dissatisfaction with care: "I am satisfied with the care I received" (number disagreeing or not sure) Show forest plot | 1 | 350 | Risk Ratio (M‐H, Fixed, 95% CI) | 0.40 [0.18, 0.88] |
| Analysis 1.23  Comparison 1 Antenatal day care units versus inpatient care, Outcome 23 Dissatisfaction with care: "I am satisfied with the care I received" (number disagreeing or not sure). | ||||
| 24 Dissatisfaction with care: "my care was very good" (number not sure or disagreeing) Show forest plot | 1 | 348 | Risk Ratio (M‐H, Fixed, 95% CI) | 1.03 [0.32, 3.34] |
| Analysis 1.24  Comparison 1 Antenatal day care units versus inpatient care, Outcome 24 Dissatisfaction with care: "my care was very good" (number not sure or disagreeing). | ||||
| 25 Dissatisfaction with care: "I felt I was being well looked after" (number not sure or disagreeing) Show forest plot | 1 | 351 | Risk Ratio (M‐H, Fixed, 95% CI) | 0.82 [0.27, 2.45] |
| Analysis 1.25  Comparison 1 Antenatal day care units versus inpatient care, Outcome 25 Dissatisfaction with care: "I felt I was being well looked after" (number not sure or disagreeing). | ||||
| 26 Average total length of stay (antenatal, intrapartum, postnatal) all cases (mothers and babies) Show forest plot | 1 | 395 | Mean Difference (IV, Fixed, 95% CI) | ‐1.31 [‐2.36, ‐0.26] |
| Analysis 1.26  Comparison 1 Antenatal day care units versus inpatient care, Outcome 26 Average total length of stay (antenatal, intrapartum, postnatal) all cases (mothers and babies). | ||||
| 27 Public health cost: average total cost (all cases, includes mothers and babies)(Australian $s) Show forest plot | 1 | 395 | Mean Difference (IV, Fixed, 95% CI) | 415.10 [‐603.86, 1434.06] |
| Analysis 1.27  Comparison 1 Antenatal day care units versus inpatient care, Outcome 27 Public health cost: average total cost (all cases, includes mothers and babies)(Australian $s). | ||||
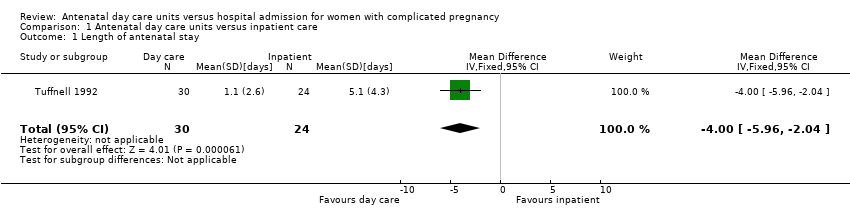
Comparison 1 Antenatal day care units versus inpatient care, Outcome 1 Length of antenatal stay.

Comparison 1 Antenatal day care units versus inpatient care, Outcome 2 Women admitted antenatally.

Comparison 1 Antenatal day care units versus inpatient care, Outcome 3 Outpatient hospital visits.

Comparison 1 Antenatal day care units versus inpatient care, Outcome 4 Total antenatal care episodes.

Comparison 1 Antenatal day care units versus inpatient care, Outcome 5 Antenatal hospital stay for less than three days (as either inpatient or staying on the day unit).
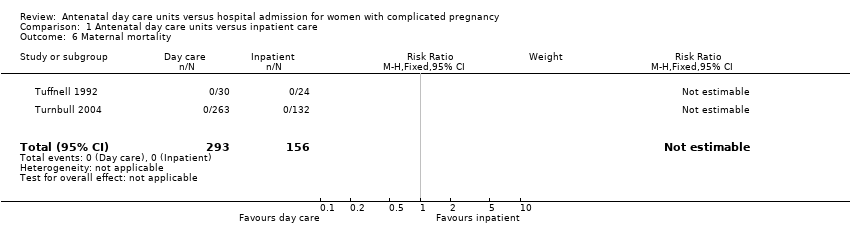
Comparison 1 Antenatal day care units versus inpatient care, Outcome 6 Maternal mortality.
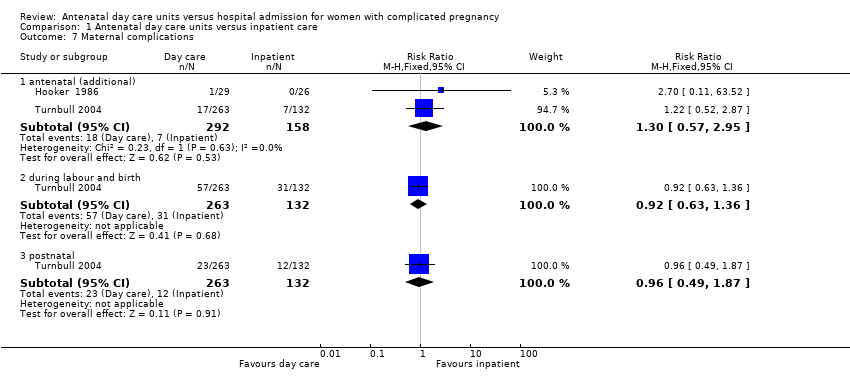
Comparison 1 Antenatal day care units versus inpatient care, Outcome 7 Maternal complications.

Comparison 1 Antenatal day care units versus inpatient care, Outcome 8 Maternal high blood pressure.
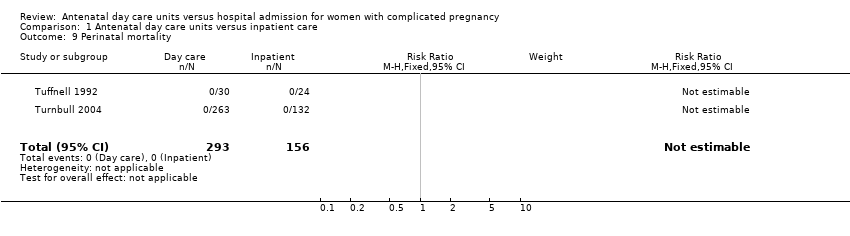
Comparison 1 Antenatal day care units versus inpatient care, Outcome 9 Perinatal mortality.

Comparison 1 Antenatal day care units versus inpatient care, Outcome 10 Apgar score at five minutes.
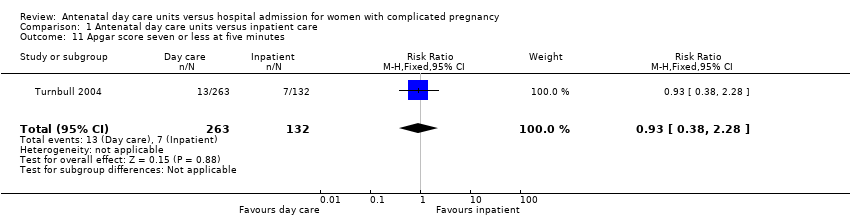
Comparison 1 Antenatal day care units versus inpatient care, Outcome 11 Apgar score seven or less at five minutes.
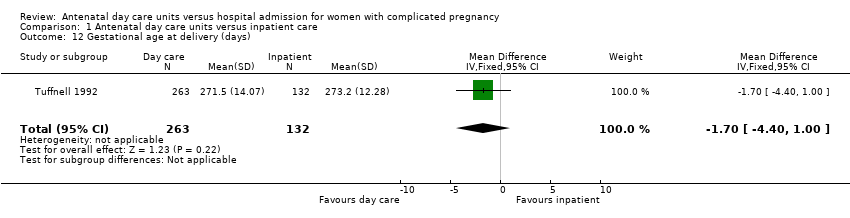
Comparison 1 Antenatal day care units versus inpatient care, Outcome 12 Gestational age at delivery (days).
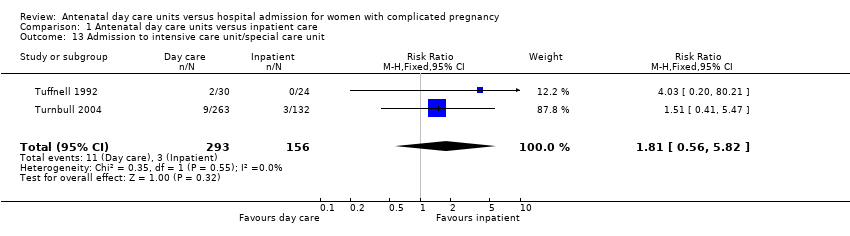
Comparison 1 Antenatal day care units versus inpatient care, Outcome 13 Admission to intensive care unit/special care unit.

Comparison 1 Antenatal day care units versus inpatient care, Outcome 14 Birthweight (grams).

Comparison 1 Antenatal day care units versus inpatient care, Outcome 15 Postnatal stay.

Comparison 1 Antenatal day care units versus inpatient care, Outcome 16 Women requiring readmission after discharge (postnatal).

Comparison 1 Antenatal day care units versus inpatient care, Outcome 17 Women visiting emergency department after discharge (postnatal).

Comparison 1 Antenatal day care units versus inpatient care, Outcome 18 Induction/augmentation of labour.
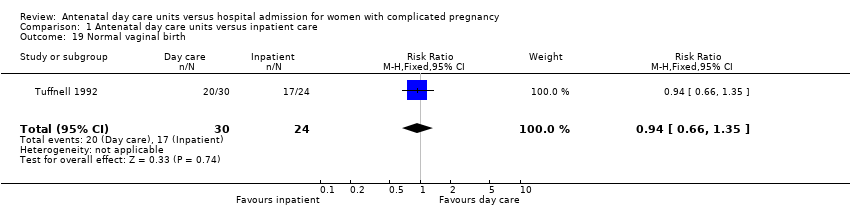
Comparison 1 Antenatal day care units versus inpatient care, Outcome 19 Normal vaginal birth.
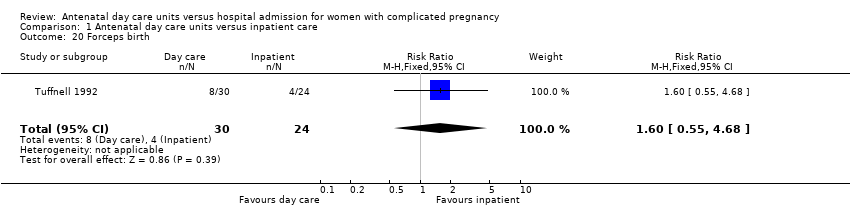
Comparison 1 Antenatal day care units versus inpatient care, Outcome 20 Forceps birth.
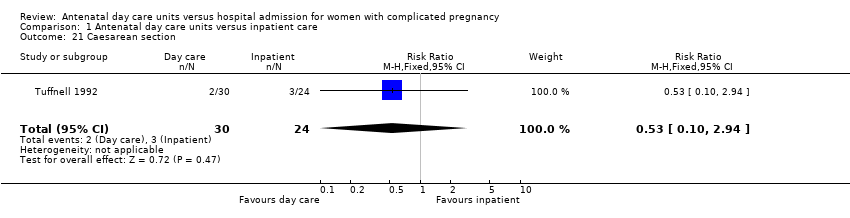
Comparison 1 Antenatal day care units versus inpatient care, Outcome 21 Caesarean section.

Comparison 1 Antenatal day care units versus inpatient care, Outcome 22 Dissatisfaction with care: "spent too much time in hospital".

Comparison 1 Antenatal day care units versus inpatient care, Outcome 23 Dissatisfaction with care: "I am satisfied with the care I received" (number disagreeing or not sure).
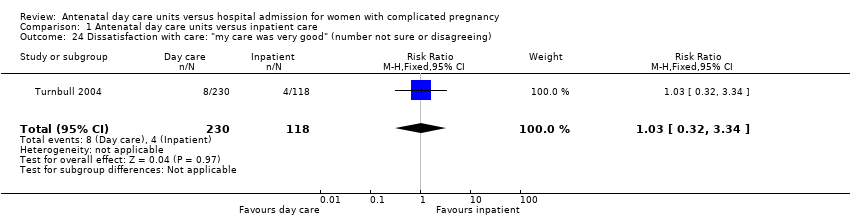
Comparison 1 Antenatal day care units versus inpatient care, Outcome 24 Dissatisfaction with care: "my care was very good" (number not sure or disagreeing).
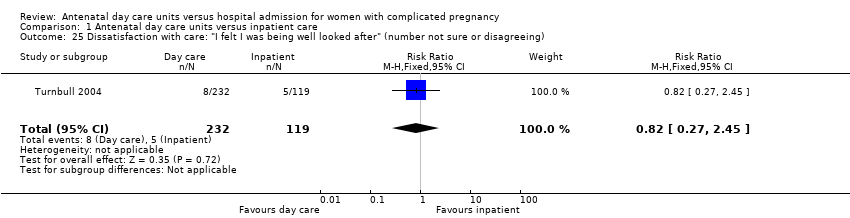
Comparison 1 Antenatal day care units versus inpatient care, Outcome 25 Dissatisfaction with care: "I felt I was being well looked after" (number not sure or disagreeing).

Comparison 1 Antenatal day care units versus inpatient care, Outcome 26 Average total length of stay (antenatal, intrapartum, postnatal) all cases (mothers and babies).

Comparison 1 Antenatal day care units versus inpatient care, Outcome 27 Public health cost: average total cost (all cases, includes mothers and babies)(Australian $s).
| Outcome or subgroup title | No. of studies | No. of participants | Statistical method | Effect size |
| 1 Length of antenatal stay Show forest plot | 1 | 54 | Mean Difference (IV, Fixed, 95% CI) | ‐2.00 [‐5.96, ‐2.04] |
| 2 Women admitted antenatally Show forest plot | 2 | 109 | Risk Ratio (M‐H, Fixed, 95% CI) | 0.46 [0.34, 0.62] |
| 3 Outpatient hospital visits Show forest plot | 1 | 54 | Mean Difference (IV, Fixed, 95% CI) | 1.5 [0.54, 2.46] |
| 4 Total antenatal care episodes Show forest plot | 1 | 395 | Mean Difference (IV, Fixed, 95% CI) | 0.41 [0.05, 0.77] |
| 5 Antenatal hospital stay for less than three days (as either inpatient or staying on the day unit) Show forest plot | 1 | 55 | Risk Ratio (M‐H, Fixed, 95% CI) | 0.95 [0.64, 1.41] |
| 6 Maternal mortality Show forest plot | 2 | 449 | Risk Ratio (M‐H, Fixed, 95% CI) | 0.0 [0.0, 0.0] |
| 7 Maternal complications Show forest plot | 2 | Risk Ratio (M‐H, Fixed, 95% CI) | Subtotals only | |
| 7.1 antenatal (additional) | 2 | 450 | Risk Ratio (M‐H, Fixed, 95% CI) | 1.30 [0.57, 2.95] |
| 7.2 during labour and birth | 1 | 395 | Risk Ratio (M‐H, Fixed, 95% CI) | 0.92 [0.63, 1.36] |
| 7.3 postnatal | 1 | 395 | Risk Ratio (M‐H, Fixed, 95% CI) | 0.96 [0.49, 1.87] |
| 8 Maternal high blood pressure Show forest plot | 1 | Risk Ratio (M‐H, Fixed, 95% CI) | Subtotals only | |
| 8.1 > 140/90 mmHg at birth | 1 | 395 | Risk Ratio (M‐H, Fixed, 95% CI) | 0.98 [0.82, 1.17] |
| 8.2 requiring urgent assessment (> 160 mmHg) | 1 | 395 | Risk Ratio (M‐H, Fixed, 95% CI) | 0.69 [0.38, 1.27] |
| 8.3 medical emergency (> 160/110 mmHg) at birth | 1 | 395 | Risk Ratio (M‐H, Fixed, 95% CI) | 0.68 [0.32, 1.45] |
| 9 Perinatal mortality Show forest plot | 2 | 449 | Risk Ratio (M‐H, Fixed, 95% CI) | 0.0 [0.0, 0.0] |
| 10 Apgar score at five minutes Show forest plot | 1 | 54 | Mean Difference (IV, Fixed, 95% CI) | 0.0 [‐0.29, 0.29] |
| 11 Apgar score seven or less at five minutes Show forest plot | 1 | 395 | Risk Ratio (M‐H, Fixed, 95% CI) | 0.93 [0.38, 2.28] |
| 12 Gestational age at delivery (days) Show forest plot | 1 | 395 | Mean Difference (IV, Fixed, 95% CI) | ‐1.70 [‐4.40, 1.00] |
| 13 Admission to intensive care unit/special care unit Show forest plot | 2 | 449 | Risk Ratio (M‐H, Fixed, 95% CI) | 1.81 [0.56, 5.82] |
| 14 Birthweight (grams) Show forest plot | 2 | 448 | Mean Difference (IV, Fixed, 95% CI) | ‐26.30 [‐135.92, 83.31] |
| 15 Postnatal stay Show forest plot | 2 | 449 | Mean Difference (IV, Fixed, 95% CI) | 0.14 [‐0.18, 0.47] |
| 16 Women requiring readmission after discharge (postnatal) Show forest plot | 1 | 395 | Risk Ratio (M‐H, Fixed, 95% CI) | 0.56 [0.22, 1.43] |
| 17 Women visiting emergency department after discharge (postnatal) Show forest plot | 1 | 395 | Risk Ratio (M‐H, Fixed, 95% CI) | 0.68 [0.35, 1.32] |
| 18 Induction/augmentation of labour Show forest plot | 2 | Risk Ratio (M‐H, Random, 95% CI) | Subtotals only | |
| 18.1 Induction of labour | 1 | 54 | Risk Ratio (M‐H, Random, 95% CI) | 0.43 [0.22, 0.83] |
| 18.2 Induction or augmentation of labour | 1 | 395 | Risk Ratio (M‐H, Random, 95% CI) | 0.94 [0.79, 1.13] |
| 19 Normal vaginal birth Show forest plot | 1 | 54 | Risk Ratio (M‐H, Fixed, 95% CI) | 0.94 [0.66, 1.35] |
| 20 Forceps birth Show forest plot | 1 | 54 | Risk Ratio (M‐H, Fixed, 95% CI) | 1.6 [0.55, 4.68] |
| 21 Caesarean section Show forest plot | 1 | 54 | Risk Ratio (M‐H, Fixed, 95% CI) | 0.53 [0.10, 2.94] |
| 22 Dissatisfaction with care: "spent too much time in hospital" Show forest plot | 1 | 45 | Risk Ratio (M‐H, Fixed, 95% CI) | 0.35 [0.08, 1.62] |
| 23 Dissatisfaction with care: "I am satisfied with the care I received" (number disagreeing or not sure) Show forest plot | 1 | 350 | Risk Ratio (M‐H, Fixed, 95% CI) | 0.40 [0.18, 0.88] |
| 24 Dissatisfaction with care: "my care was very good" (number not sure or disagreeing) Show forest plot | 1 | 348 | Risk Ratio (M‐H, Fixed, 95% CI) | 1.03 [0.32, 3.34] |
| 25 Dissatisfaction with care: "I felt I was being well looked after" (number not sure or disagreeing) Show forest plot | 1 | 351 | Risk Ratio (M‐H, Fixed, 95% CI) | 0.82 [0.27, 2.45] |
| 26 Average total length of stay (antenatal, intrapartum, postnatal) all cases (mothers and babies) Show forest plot | 1 | 395 | Mean Difference (IV, Fixed, 95% CI) | ‐1.31 [‐2.36, ‐0.26] |
| 27 Public health cost: average total cost (all cases, includes mothers and babies)(Australian $s) Show forest plot | 1 | 395 | Mean Difference (IV, Fixed, 95% CI) | 415.10 [‐603.86, 1434.06] |