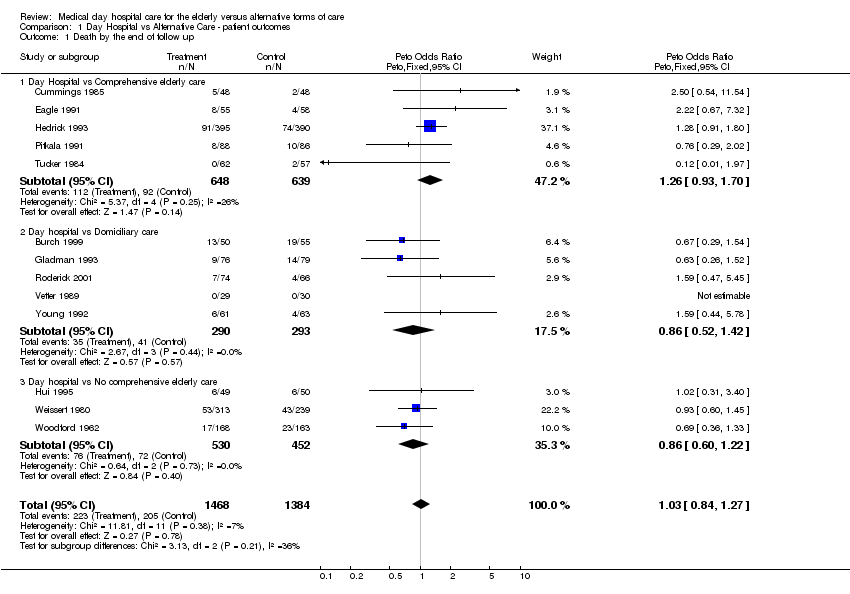
| 1 Death by the end of follow up Show forest plot | 13 | 2852 | Peto Odds Ratio (Peto, Fixed, 95% CI) | 1.03 [0.84, 1.27] |
|
| 1.1 Day Hospital vs Comprehensive elderly care | 5 | 1287 | Peto Odds Ratio (Peto, Fixed, 95% CI) | 1.26 [0.93, 1.70] |
| 1.2 Day hospital vs Domiciliary care | 5 | 583 | Peto Odds Ratio (Peto, Fixed, 95% CI) | 0.86 [0.52, 1.42] |
| 1.3 Day hospital vs No comprehensive elderly care | 3 | 982 | Peto Odds Ratio (Peto, Fixed, 95% CI) | 0.86 [0.60, 1.22] |
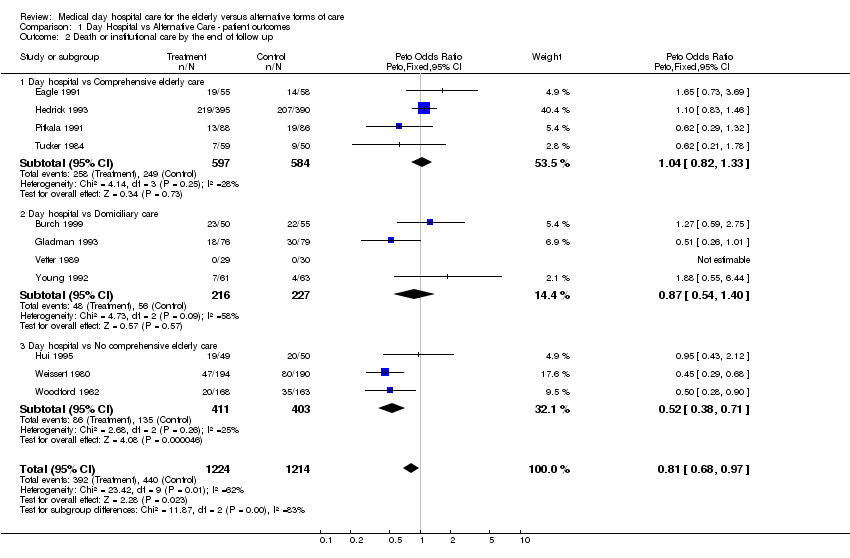
| 2 Death or institutional care by the end of follow up Show forest plot | 11 | 2438 | Peto Odds Ratio (Peto, Fixed, 95% CI) | 0.81 [0.68, 0.97] |
|
| 2.1 Day hospital vs Comprehensive elderly care | 4 | 1181 | Peto Odds Ratio (Peto, Fixed, 95% CI) | 1.04 [0.82, 1.33] |
| 2.2 Day hospital vs Domiciliary care | 4 | 443 | Peto Odds Ratio (Peto, Fixed, 95% CI) | 0.87 [0.54, 1.40] |
| 2.3 Day hospital vs No comprehensive elderly care | 3 | 814 | Peto Odds Ratio (Peto, Fixed, 95% CI) | 0.52 [0.38, 0.71] |
| 3 Death or deterioration in activities of daily living (ADL) Show forest plot | 7 | 1268 | Peto Odds Ratio (Peto, Fixed, 95% CI) | 0.98 [0.78, 1.23] |
|
| 3.1 Day hospital vs Comprehensive elderly care | 1 | 174 | Peto Odds Ratio (Peto, Fixed, 95% CI) | 1.17 [0.64, 2.17] |
| 3.2 Day hospital vs Domiciliary care | 4 | 443 | Peto Odds Ratio (Peto, Fixed, 95% CI) | 1.34 [0.90, 1.99] |
| 3.3 Day hospital vs No comprehensive elderly care | 2 | 651 | Peto Odds Ratio (Peto, Fixed, 95% CI) | 0.76 [0.56, 1.05] |
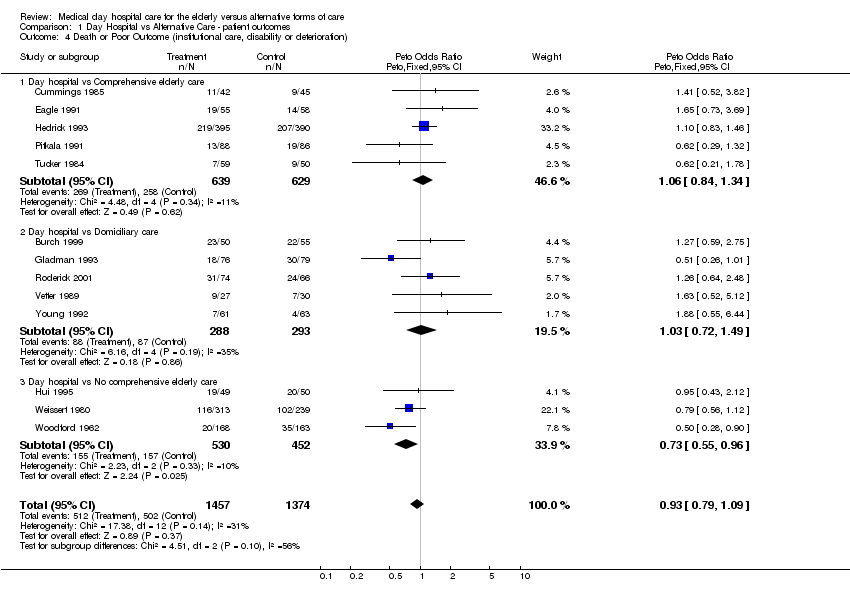
| 4 Death or Poor Outcome (institutional care, disability or deterioration) Show forest plot | 13 | 2831 | Peto Odds Ratio (Peto, Fixed, 95% CI) | 0.93 [0.79, 1.09] |
|
| 4.1 Day hospital vs Comprehensive elderly care | 5 | 1268 | Peto Odds Ratio (Peto, Fixed, 95% CI) | 1.06 [0.84, 1.34] |
| 4.2 Day hospital vs Domiciliary care | 5 | 581 | Peto Odds Ratio (Peto, Fixed, 95% CI) | 1.03 [0.72, 1.49] |
| 4.3 Day hospital vs No comprehensive elderly care | 3 | 982 | Peto Odds Ratio (Peto, Fixed, 95% CI) | 0.73 [0.55, 0.96] |
| 5 Deterioration in activities of daily living (ADL) in survivors Show forest plot | 7 | 905 | Peto Odds Ratio (Peto, Fixed, 95% CI) | 0.99 [0.73, 1.34] |
|
| 5.1 Day hospital vs Comprehensive elderly care | 1 | 149 | Peto Odds Ratio (Peto, Fixed, 95% CI) | 1.21 [0.58, 2.50] |
| 5.2 Day hospital vs Domiciliary care | 4 | 349 | Peto Odds Ratio (Peto, Fixed, 95% CI) | 1.51 [0.94, 2.44] |
| 5.3 Day hospital vs No comprehensive elderly care | 2 | 407 | Peto Odds Ratio (Peto, Fixed, 95% CI) | 0.60 [0.38, 0.96] |
| 6 Activities of daily living (ADL) scores Show forest plot | | | Other data | No numeric data |
|
| 6.1 Day hospital vs Comprehensive elderly care | | | Other data | No numeric data |
| 6.2 Day hospital vs Domiciliary care | | | Other data | No numeric data |
| 6.3 Day hospital vs No comprehensive elderly care | | | Other data | No numeric data |
| 7 Subjective health status Show forest plot | | | Other data | No numeric data |
|
| 7.1 Day hospital vs Comprehensive elderly care | | | Other data | No numeric data |
| 7.2 Day hospital vs Domiciliary care | | | Other data | No numeric data |
| 7.3 Day hospital vs No comprehensive elderly care | | | Other data | No numeric data |
| 8 Patient satisfaction Show forest plot | | | Other data | No numeric data |
|
| 8.1 Day hospital vs Comprehensive elderly care | | | Other data | No numeric data |
| 8.2 Day hospital vs Domiciliary care | | | Other data | No numeric data |
| 8.3 Day hospital vs No comprehensive elderly care | | | Other data | No numeric data |
| 9 Carer Distress Show forest plot | | | Other data | No numeric data |
|
| 9.1 Day hospital vs Comprehensive elderly care | | | Other data | No numeric data |
| 9.2 Day hospital vs Domiciliary care | | | Other data | No numeric data |
| 9.3 Day hospital vs No comprehensive elderly care | | | Other data | No numeric data |