| | Analgesia | Rescue medication |
| Study ID | Treatment | PI or PR | Number with 50% PR | PGE: v good or excellent | Median time to use (hr) | Number using |
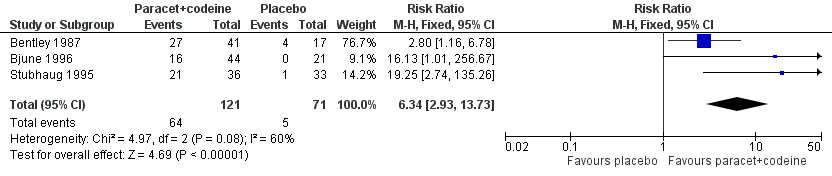
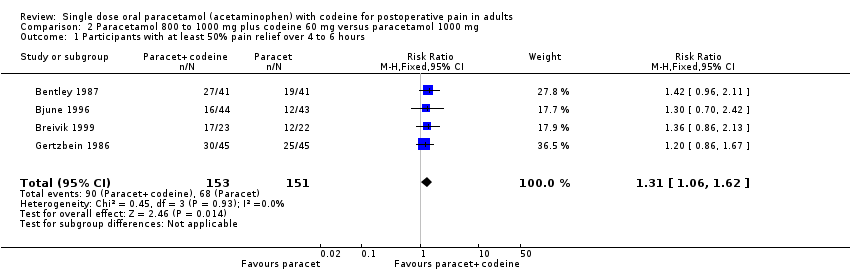
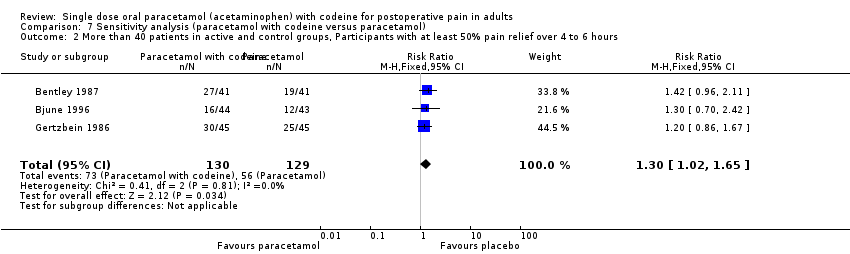
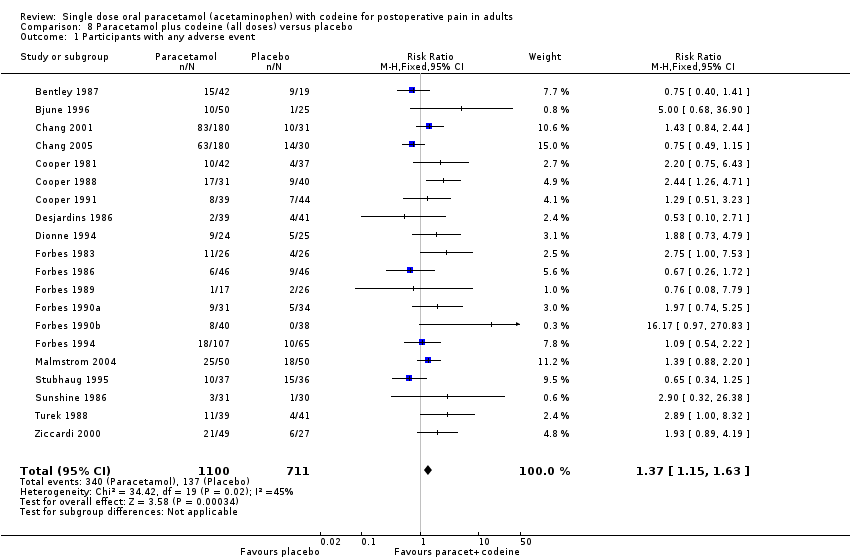
| Bentley 1987 | (1) Paracetamol+codeine 1000/60 mg, n=41 (2) Paracetamol 1000 mg, n=41 (3) Codeine 60 mg, n=21 (4) Placebo, n=17 | TOTPAR 5: (1) 11.5 (2) 8.7 (4) 4.9 | (1) 27/41 (2) 19/41 (4) 4/17 | No data | (1) 4.1 (2) 3.3 (4) 1.4 | at 4 hr: (1) 44 (2) 68 (4) 81 |
| Bjune 1996 | (1) Paracetamol+codeine 800/60 mg, n=50 (2) Paracetamol 1000 mg, n=50 (3) Placebo, n=25 | TOTPAR 6: severe pain (1) 10.5 (2) 6.4 (3) 0 moderate pain (1) 6.5 (2) 8.0 (3) 1.5 | (1) 16/44 (2) 12/43 (3) 0/21 | No usable data | No data | No data |
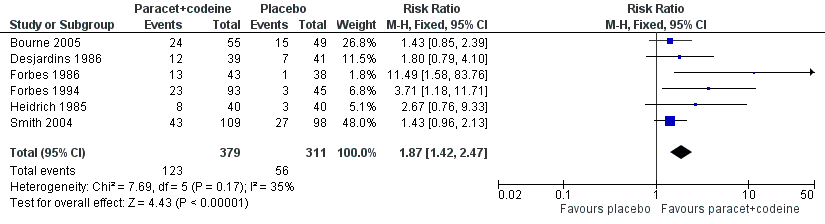
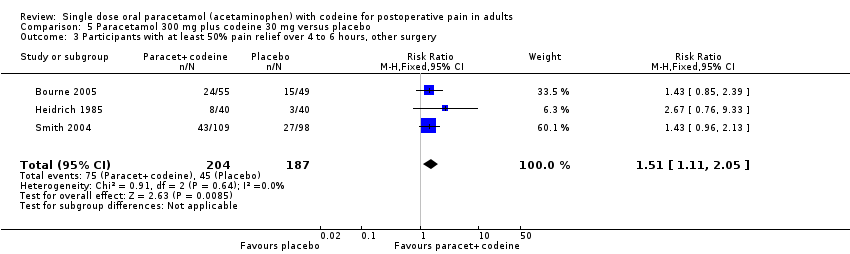
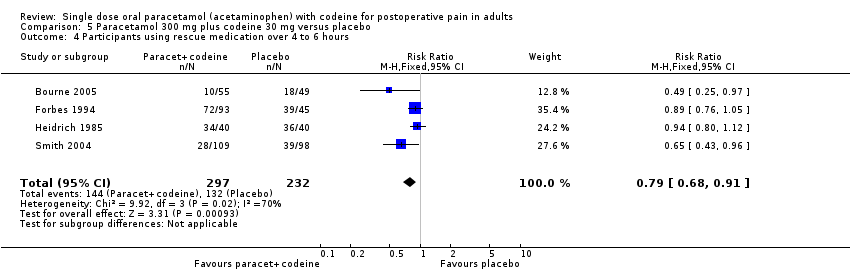
| Bourne 2005 | (1) Paracetamol+codeine 300/30 mg, n=55 (2) Paracetamol+tramadol 325/37.5 mg, n=49 (3) Placebo, n=49 | SPID 4: (1) 2.8 (3) 2.1 Baseline PI: (1) 2.1 (2) 2.2 | (1) 24/55 (3) 15/49 | No usable data | No data | at 4 hr: (1) 18 (3) 37 |
| Breivik 1999 | (1) Paracetamol+codeine 1000/60 mg n=24 (2) Paracetamol 1000 mg, n=22 (3) Diclofenac 100 mg, n=22 (4) Paracetamol+diclofenac 1000/100 mg, n=24 (5) Paracetamol+diclofenac+codeine 1000/100/60 mg, n=24 | TOTPAR 6: (1) 15.5 (2) 12.1 | (1) 17/23 (2) 12/22 | No data | No data | at 6 hr: (1) 17 (2) 38 |
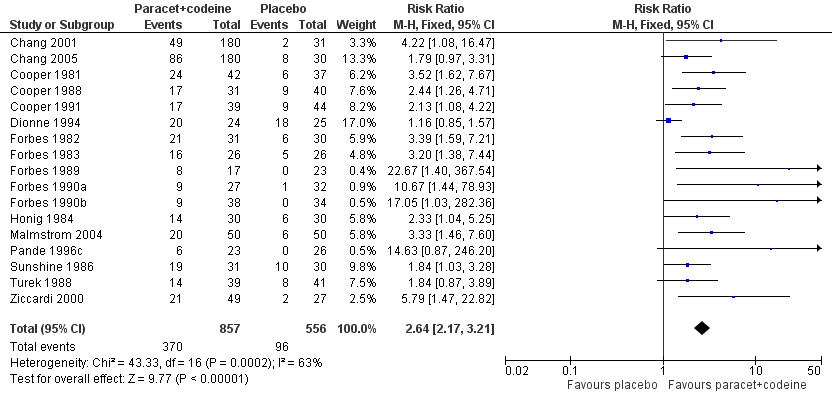
| Chang 2001 | (1) Paracetamol+codeine 600/60 mg n=180 (2) Rofecoxib 50mg n=182 (3) Placebo n=31 | TOTPAR 6: (1) 7.0 (3) 3.4 | (1) 49/180 (3) 2/31 | (1) 27/180 (3) 0/31 | (1) 2.3 (3) 1.6 | No data |
| Chang 2005 | (1) Paracetamol+codeine 600/60 mg n=180 (2) Rofecoxib 50 mg n=180 (3) Placebo n=30 | TOTPAR 6: (1) 10.7 (3) 6.7 | (1) 86/180 (3) 8/30 | (1) 123/180 (3) 3/30 | (1) 6.5 (3) 3.2 | at 24 hr: (1) 86 (3) 73 |
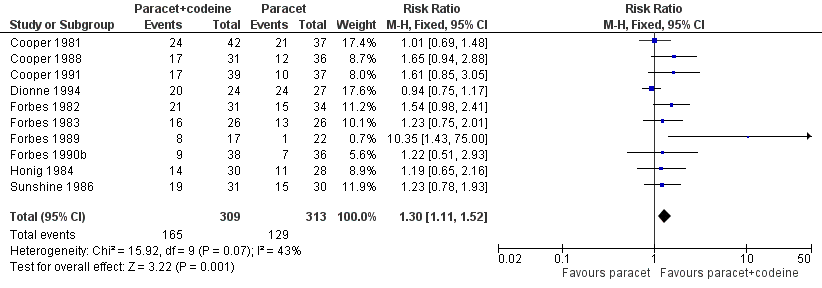
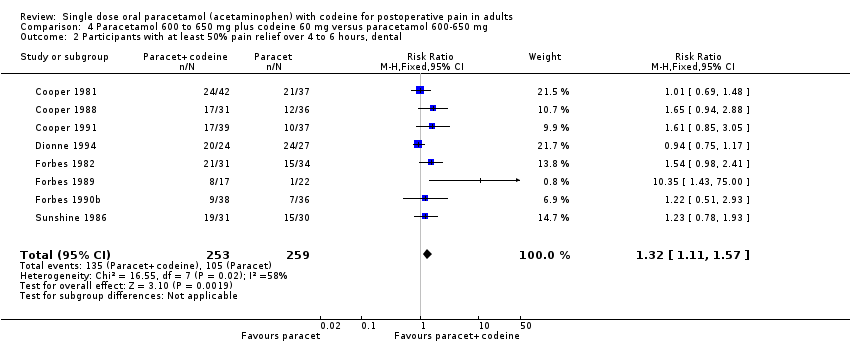
| Cooper 1981 | (1) Paracetamol+codeine 650/60 mg, n=42 (2) Paracetamol 650 mg, n=37 (3) Paracetamol+d‐propoxyphene 650/100 mg, n=42 (4) Ibuprofen 200 mg, n=42 (5) Placebo, n=37 | TOTPAR 4: (1) 8.4 (2) 8.2 (5) 3.4 | (1) 24/42 (2) 21/37 (5) 6/37 | No usable data | Mean: (1) 3.1 (2) 3.5 (5) 2.9 | at 4 hr: (1) 12 (2) 5 (5) 54 |
| Cooper 1988 | (1) Paracetamol+codeine 600/60 mg, n=31 (2) Paracetamol 600 mg, n=36 (3) Meclofenamate Na 100 mg, n=36 (2) Placebo, n=40 | TOTPAR 6: (1) 12.0 (2) 8.0 (4) 6.3 | (1) 17/31 (2) 12/36 (4) 9/40 | (1) 15/31 (2) 12/36 (4) 8/40 | No data | at 6 hr: (1) 58 (2) 78 (4) 82 |
| Cooper 1991 | (1) Paracetamol+codeine 650/60 mg, n=39 (2) Paracetamol 650 mg, n=37 (3) Zomepirac 100 mg, n=23 (4) Flurbiprofen 50 mg, n=42 (5) Flurbiprofen 100 mg, n=41 (6) Placebo, n=44 | TOTPAR 6: (1) 10.1 (2) 6.8 (6) 5.7 | (1) 17/39 (2) 10/37 (6) 9/44 | (1) 14/39 (2) 3/37 (6) 2/44 | Mean: (1) 3.5 (2) 3.2 (6) 3.1 | at 6 hr: (1) 80 (2) 95 (6) 84 |
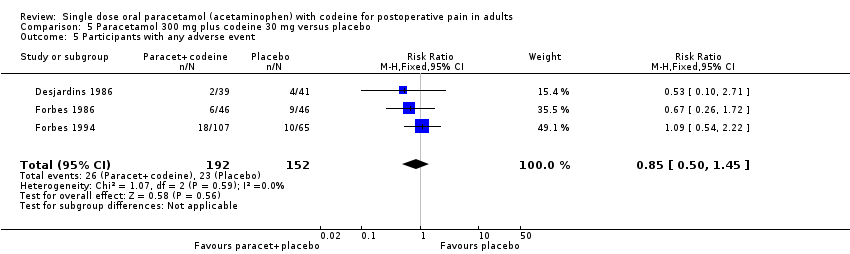
| Desjardins 1986 | (1) Paracetamol+codeine 300/30 mg, n=39 (2) Aspirin+butalbital+caffeine+codeine 325/50/40/30 mg, n=43 (3) Placebo, n=41 | TOTPAR 6: (1) 7.8 (3) 5.1 | (1) 12/39 (3) 7/41 | No usable data | Mean: (1) 3.4 (3) 3.0 | No data |
| Dionne 1994 | (1) Paracetamol+codeine 650/60 mg, n=24 (2) Paracetamol 650 mg, n=27 (3) Flurbiprofen 50 mg, n=25 (4) Flurbiprofen 100 mg, n=22 (5) Placebo, n=25 | TOTPAR 6: (1) 16.9 (2) 18.4 (5) 14.9 | (1) 20/24 (2) 24/27 (5) 18/25 | No usable data | No data | No data |
| Forbes 1982 | (1) Paracetamol+codeine 600/60 mg, n=31 (2) Paracetamol 600 mg, n=34 (3) Diflusinal 500 mg, n=32 (4) Diflusinal 1000 mg, n=32 (5) Placebo, n=30 | TOTPAR 4: (1) 9.7 (2) 8.9 (5) 3.8 | (1) 21/31 (2) 15/34 (5) 6/30 | No usable data | (1) 5.3 (2) 3.5 (5) 2.4 | at 6 hr: (1) 56 (2) 70 (5) 82 |
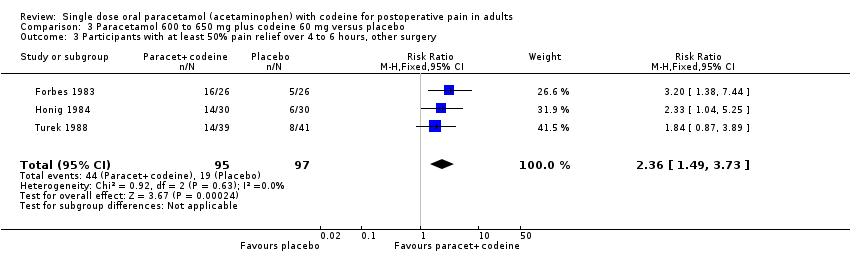
| Forbes 1983 | (1) Paracetamol+codeine 600/60 mg, n=26 (2) Paracetamol 600 mg, n=26 (3) Diflusinal 500 mg, n=26 (4) Diflusinal 1000 mg, n=28 (5) Placebo, n=26 | TOTPAR 6: (1) 13.5 (2) 11.2 (5) 5.4 | (1) 16/26 (2) 13/26 (5) 5/26 | No usable data | (1) 5.3 (2) 4.0 (5) 2.4 | at 6 hr: (1) 63 (2) 73 (5) 86 |
| Forbes 1986 | (1) Paracetamol+codeine 300/30 mg, n=43 (2) Aspirin+butalbital+caffeine+codeine 325/50/40/15 mg, n=41 (3) Placebo, n=38 | TOTPAR 6: (1) 7.4 (3) 2.4 | (1) 13/43 (2) 1/38 | No usable data | Mean: (1) 4.5 (2) 3.0 | No data |
| Forbes 1989 | (1) Paracetamol+codeine 600/60 mg, n=17 (2) Paracetamol 600 mg, n=22 (3) Flurbiprofen 100 mg, n=26 (4) Placebo, n=23 | TOTPAR 6: (1) 10.5 (2) 4.5 (3) 2.0 | (1) 8/17 (2) 1/22 (4) 0/23 | No usable data | (1) 5.1 (2) 2.8 (4) 1.7 | at 6 hr: (1) 64 (2) 82 (4) 91 |
| Forbes 1990a | (1) Paracetamol+codeine 600/60 mg, n=27 (2) Aspirin 650 mg, n=32 (3) Ketorolac 10 mg, n=37 (4) Placebo, n=32 | TOTPAR 6: (1) 8.6 (4) 2.9 | (1) 9/27 (4) 1/32 | No usable data | Mean: (1) 4.3 (4) 3.1 | at 6 hr: (1) 85 (4) 84 |
| Forbes 1990b | (1) Paracetamol+codeine 600/60 mg, n=38 (2) Paracetamol 600 mg, n=36 (3) Ketorolac 10 mg, n=31 (4) Ketorolac 20 mg, n=35 (5) ibuprofen 400 mg, n=32 (6) Placebo, n=34 | TOTPAR 6: (1) 6.2 (2) 5.8 (6) 1.9 | (1) 9/38 (2) 7/36 (6) 0/34 | No usable data | (1) 2.6 (2) 3.0 (6) 1.8 | at 6 hr: (1) 82 (2) 81 (6) 97 |
| Forbes 1994 | (1) Paracetamol+codeine 300/30 mg, n=93 (2) Paracetamol+hydrocodone bitartrate 500/7.5 mg, n=94 (3) Placebo, n=45 | TOTPAR 6: (1) 6.6 (3) 3.4 | (1) 23/93 (3) 3/45 | No usable data | Mean: (1) 3.9 (3) 3.4 | at 6 hr: (1) 77 (3) 87 |
| Gertzbein 1986 | (1) Paracetamol+codeine 1000/60 mg, n=45 (2) Paracetamol 1000 mg, n=45 | TOTPAR 5: (1) 11.5 (2) 10.2 | (1) 30/45 (2) 25/45 | No usable data | Mean: (1) 3.8 (2) 3.6 | No data |
| Heidrich 1985 | (1) Paracetamol+codeine 300/30 mg, n=40 (2) Ibuprofen 400 mg, n=40 (3) Placebo, n=40 | TOTPAR 6: (1) 5.5 (3) 3.3 | (1) 8/40 (3) 3/40 | No data | Mean: (1) 4.7 (3) 3.5 | (1) 85 (3) 90 |
| Honig 1984 | (1) Paracetamol+codeine 600/60 mg, n=30 (2) Paracet 600 mg, n=28 (3) Codeine 60 mg, n=28 (4) Placebo, n=30 | TOTPAR 6: (1) 10.6 (2) 8.9 (4) 5.9 | (1) 14/30 (2) 11/28 (4) 6/30 | (1) 12/30 (2) 8/28 (4) 4/30 | No data | at 6 hr: (1) 33 (2) 43 (4) 53 |
| Malmstrom 2004 | (1) Paracetamol+codeine 600/60 mg, n=50 (2) Etoricoxib 120 mg, n=50 (3) Naproxen sodium 550 mg, n=50 (4) Placebo, n=50 | TOTPAR 6: (1) 9.2 (4) 4.2 | (1) 20/50 (4) 6/50 | at 8 hr: (1) 24/50 (4) 7/50 | (1) 3.6 (4) 1.6 | at 24 hr: (1) 76 (4) 99 |
| Pande 1996a | (1) Paracetamol+codeine 600/60 mg, n=23 (2) Placebo, n=26 | SPID 6: (1) 3.1 (2) 0 Baseline PI: 2.5 | (1) 6/23 (2) 0/26 | No usable data | No data | No data |
| Smith 2004 | 1)Paracetamol+codeine 300/30 mg, n=109 2) Paracetamol+tramadol 325/37.5 mg, n=98 3) Placebo n=98 | SPID 4: (1) 2.7 (3) 2.0 | (1) 43/109 (3) 27/98 | No usable data | No data | at 4 hr: (1) 26 (3) 40 |
| Stubhaug 1995 | (1) Paracetamol+codeine 1000/60 mg, n=36 (2) Tramadol 50 mg, n=33 (3) Tramadol 100 mg, n=35 (4) Placebo, n=33 | VAS SPID 6: (1) 204 (4) 17 Baseline PI: (1) 67 (4) 66 | (1) 21/36 (4) 1/33 | No usable data | (1) >6 (4) 2.8 | at 6 hr: (1) 36 (4) 82 |
| Sunshine 1986 | (1) Paracetamol+codeine 650/60 mg, n=31 (2) Paracetamol 650 mg, n=30 (3) Flurbiprofen 50 mg, n=31 (4) Flurbiprofen 100 mg, n=29 (5) Zomepirac 100 mg, n=31 (6) Placebo, n=30 | TOTPAR 6: (1) 13.4 (2) 11.1 (6) 8.3 | (1) 19/31 (2) 15/30 (6) 10/30 | No usable data | No data | at 6 hr: (1) 30 (2) 47 (6) 43 |
| Turek 1988 | (1) Paracetamol+codeine 650/60 mg, n=39 (2) Ketoprofen 50 mg, n=41 (3) Ketoprofen 150 mg, n=39 (4) Placebo, n=41 | TOTPAR 6: (1) 8.1 (4) 4.6 | (1) 14/39 (4) 8/41 | No usable data | Mean: (1) 3.5 (4) 2.2 | at 6 hr: (1) 67 (4) 83 |
| Ziccardi 2000 | (1) Paracetamol+codeine 300/30 mg, n=49 (2) Ibuprofen+hydrocodone 200/75 mg, n=49 (3) Placebo, n=27 | TOTPAR 6: (1) 9.8 (3) 3.5 | (1) 21/49 (3) 2/27 | No usable data | (1) 3.0 (3) 1.0 | No data |