| 1 Wound infections Show forest plot | 40 | 4904 | Peto Odds Ratio (Peto, Fixed, 95% CI) | 0.45 [0.35, 0.58] |
|
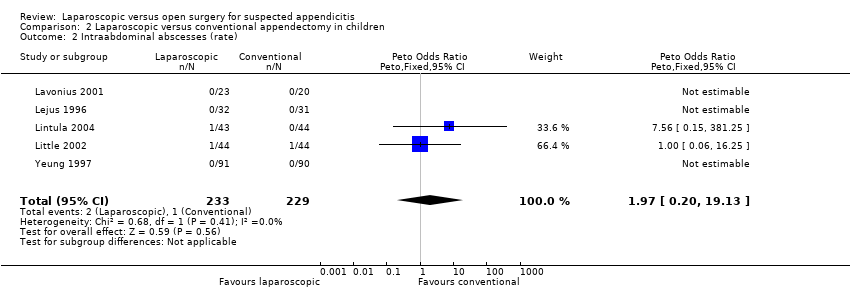
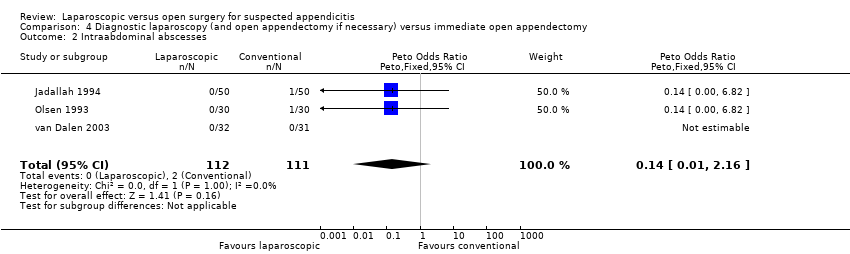
| 2 Intraabdominal abscesses Show forest plot | 40 | 4953 | Peto Odds Ratio (Peto, Fixed, 95% CI) | 2.48 [1.45, 4.21] |
|
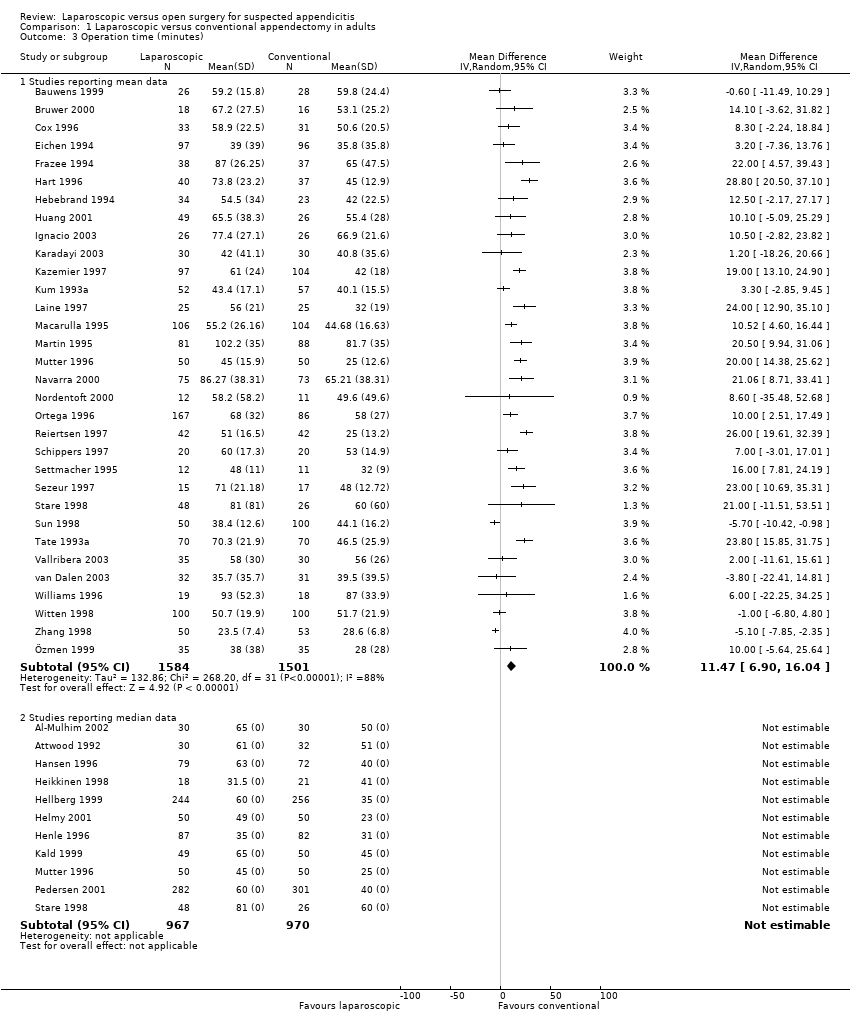
| 3 Operation time (minutes) Show forest plot | 41 | | Mean Difference (IV, Random, 95% CI) | Subtotals only |
|
| 3.1 Studies reporting mean data | 32 | 3085 | Mean Difference (IV, Random, 95% CI) | 11.47 [6.90, 16.04] |
| 3.2 Studies reporting median data | 11 | 1937 | Mean Difference (IV, Random, 95% CI) | 0.0 [0.0, 0.0] |
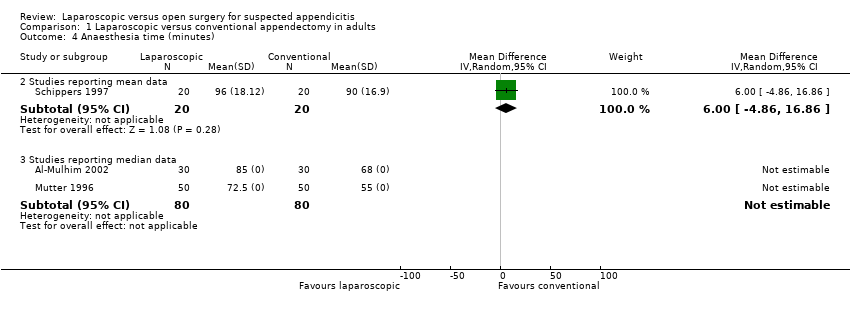
| 4 Anaesthesia time (minutes) Show forest plot | 3 | | Mean Difference (IV, Random, 95% CI) | Subtotals only |
|
| 4.2 Studies reporting mean data | 1 | 40 | Mean Difference (IV, Random, 95% CI) | 6.0 [‐4.86, 16.86] |
| 4.3 Studies reporting median data | 2 | 160 | Mean Difference (IV, Random, 95% CI) | 0.0 [0.0, 0.0] |
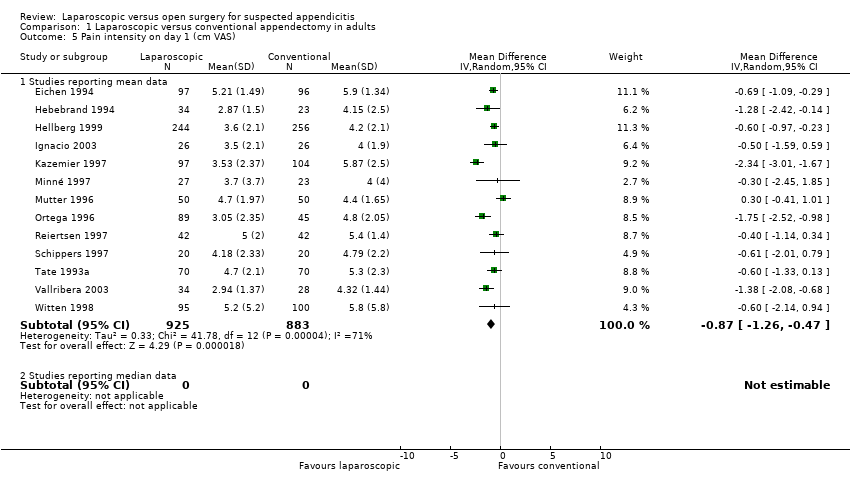
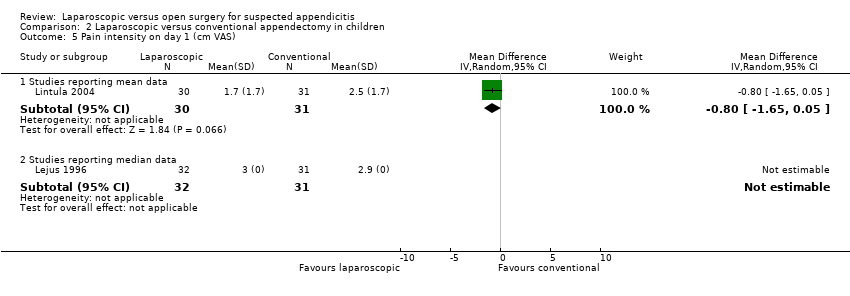
| 5 Pain intensity on day 1 (cm VAS) Show forest plot | 13 | | Mean Difference (IV, Random, 95% CI) | Subtotals only |
|
| 5.1 Studies reporting mean data | 13 | 1808 | Mean Difference (IV, Random, 95% CI) | ‐0.87 [‐1.26, ‐0.47] |
| 5.2 Studies reporting median data | 0 | 0 | Mean Difference (IV, Random, 95% CI) | 0.0 [0.0, 0.0] |
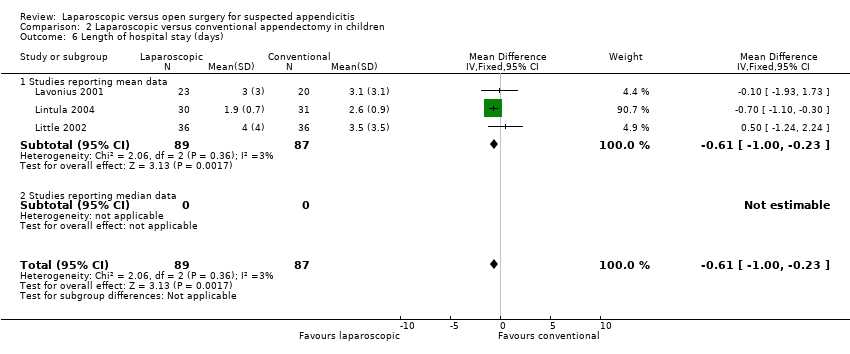
| 6 Length of hospital stay Show forest plot | 38 | | Mean Difference (IV, Random, 95% CI) | Subtotals only |
|
| 6.1 Studies reporting mean data | 26 | 2900 | Mean Difference (IV, Random, 95% CI) | ‐1.05 [‐1.49, ‐0.62] |
| 6.2 Studies reporting median data | 12 | 1988 | Mean Difference (IV, Random, 95% CI) | 0.0 [0.0, 0.0] |
| 7 Time until reintroduction of liquid diet (days) Show forest plot | 5 | | Mean Difference (IV, Random, 95% CI) | Subtotals only |
|
| 7.1 Studies reporting means | 4 | 600 | Mean Difference (IV, Random, 95% CI) | ‐0.50 [‐0.87, ‐0.13] |
| 7.2 Studies reporting medians | 1 | 60 | Mean Difference (IV, Random, 95% CI) | 0.0 [0.0, 0.0] |
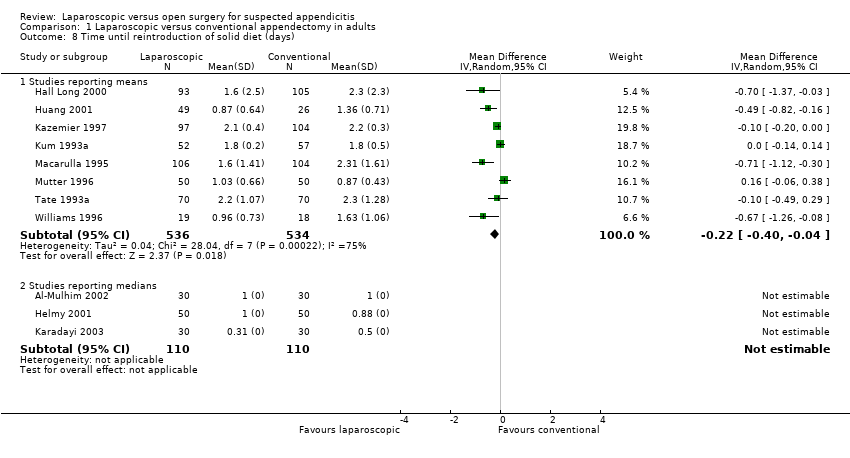
| 8 Time until reintroduction of solid diet (days) Show forest plot | 11 | | Mean Difference (IV, Random, 95% CI) | Subtotals only |
|
| 8.1 Studies reporting means | 8 | 1070 | Mean Difference (IV, Random, 95% CI) | ‐0.22 [‐0.40, ‐0.04] |
| 8.2 Studies reporting medians | 3 | 220 | Mean Difference (IV, Random, 95% CI) | 0.0 [0.0, 0.0] |
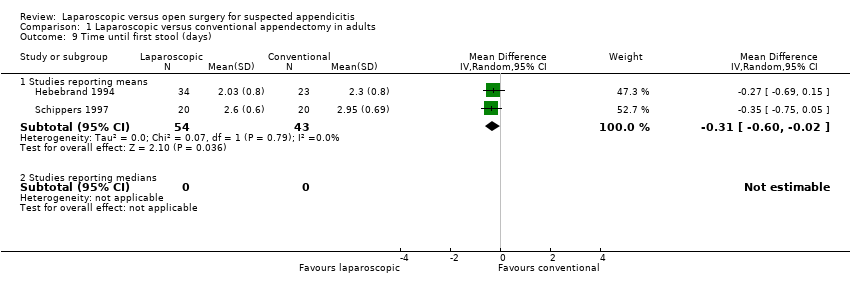
| 9 Time until first stool (days) Show forest plot | 2 | | Mean Difference (IV, Random, 95% CI) | Subtotals only |
|
| 9.1 Studies reporting means | 2 | 97 | Mean Difference (IV, Random, 95% CI) | ‐0.31 [‐0.60, ‐0.02] |
| 9.2 Studies reporting medians | 0 | 0 | Mean Difference (IV, Random, 95% CI) | 0.0 [0.0, 0.0] |
| 10 Time until return to normal activity (days) Show forest plot | 20 | | Mean Difference (IV, Random, 95% CI) | Subtotals only |
|
| 10.1 Studies reporting means | 11 | 1126 | Mean Difference (IV, Random, 95% CI) | ‐5.86 [‐8.11, ‐3.61] |
| 10.2 Studies reporting medians | 9 | 1733 | Mean Difference (IV, Random, 95% CI) | 0.0 [0.0, 0.0] |
| 11 Time until return to work (days) Show forest plot | 12 | | Mean Difference (IV, Random, 95% CI) | Subtotals only |
|
| 11.1 Studies reporting means | 5 | 522 | Mean Difference (IV, Random, 95% CI) | 0.00 [‐1.97, 1.98] |
| 11.2 Studies reporting medians | 7 | 1303 | Mean Difference (IV, Random, 95% CI) | 0.0 [0.0, 0.0] |
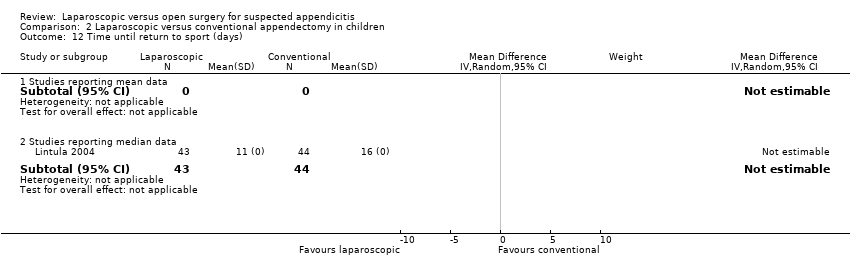
| 12 Time until return to sport (days) Show forest plot | 2 | | Mean Difference (IV, Random, 95% CI) | Subtotals only |
|
| 12.1 Studies reporting means | 0 | 0 | Mean Difference (IV, Random, 95% CI) | 0.0 [0.0, 0.0] |
| 12.2 Studies reporting medians | 2 | 223 | Mean Difference (IV, Random, 95% CI) | 0.0 [0.0, 0.0] |
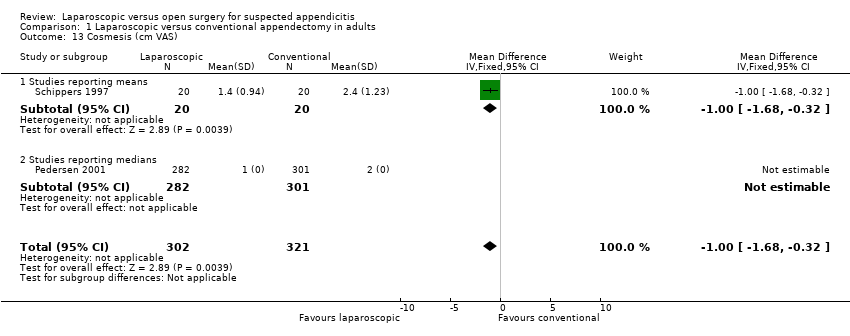
| 13 Cosmesis (cm VAS) Show forest plot | 2 | 623 | Mean Difference (IV, Fixed, 95% CI) | ‐1.0 [‐1.68, ‐0.32] |
|
| 13.1 Studies reporting means | 1 | 40 | Mean Difference (IV, Fixed, 95% CI) | ‐1.0 [‐1.68, ‐0.32] |
| 13.2 Studies reporting medians | 1 | 583 | Mean Difference (IV, Fixed, 95% CI) | 0.0 [0.0, 0.0] |
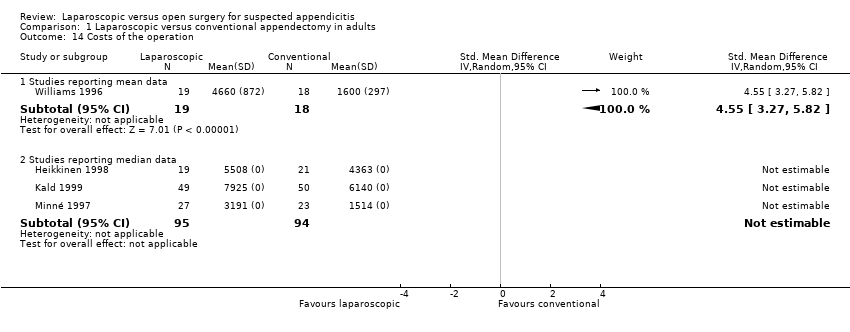
| 14 Costs of the operation Show forest plot | 4 | | Std. Mean Difference (IV, Random, 95% CI) | Subtotals only |
|
| 14.1 Studies reporting mean data | 1 | 37 | Std. Mean Difference (IV, Random, 95% CI) | 4.55 [3.27, 5.82] |
| 14.2 Studies reporting median data | 3 | 189 | Std. Mean Difference (IV, Random, 95% CI) | 0.0 [0.0, 0.0] |
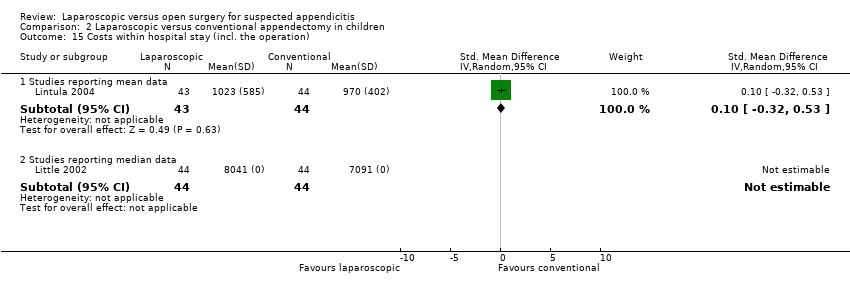
| 15 Costs within hospital stay (incl. the operation) Show forest plot | 7 | | Std. Mean Difference (IV, Random, 95% CI) | Subtotals only |
|
| 15.1 Studies reporting mean data | 3 | 404 | Std. Mean Difference (IV, Random, 95% CI) | 0.20 [‐0.29, 0.68] |
| 15.2 Studies reporting median data | 4 | 339 | Std. Mean Difference (IV, Random, 95% CI) | 0.0 [0.0, 0.0] |
| 16 Costs outside hospital Show forest plot | 3 | | Std. Mean Difference (IV, Random, 95% CI) | Subtotals only |
|
| 16.1 Studies reporting mean data | 1 | 198 | Std. Mean Difference (IV, Random, 95% CI) | ‐0.35 [‐0.63, ‐0.07] |
| 16.2 Studies reporting median data | 2 | 96 | Std. Mean Difference (IV, Random, 95% CI) | 0.0 [0.0, 0.0] |