Scolaris Content Display Scolaris Content Display

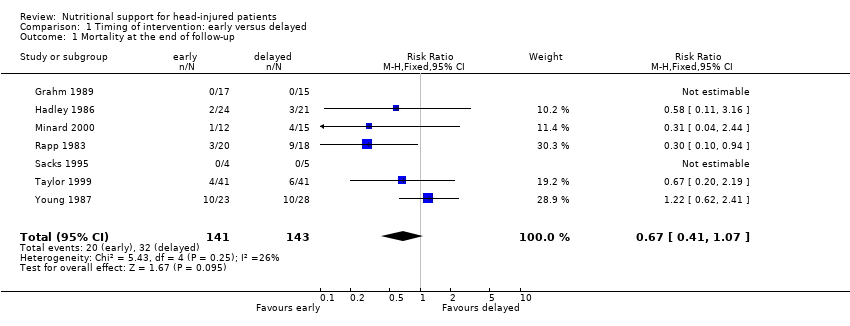
Comparison 1 Timing of intervention: early versus delayed, Outcome 1 Mortality at the end of follow‐up.
Figuras y tablas -
Analysis 1.1

Comparison 1 Timing of intervention: early versus delayed, Outcome 1 Mortality at the end of follow‐up.

Comparison 1 Timing of intervention: early versus delayed, Outcome 2 Poor outcome at the end of follow‐up.
Figuras y tablas -
Analysis 1.2

Comparison 1 Timing of intervention: early versus delayed, Outcome 2 Poor outcome at the end of follow‐up.

Study

Grahm 1989

The median length of ICU stay was 7 days (range 4 to 19 days) for the early group and 10 days for the control group.

Minard 2000

The average length of ICU stay was 18.5 in the early group and 11.3 in the late group. when deaths were excluded the average length of stay was 19.3 in the early group and 11.7 in the late group.

Taylor 1999

The early enhanced enteral nutrition group achieved discharge more quickly (median days to discharge 30 versus 46 for the control group).

Figuras y tablas -
Analysis 1.3

Comparison 1 Timing of intervention: early versus delayed, Outcome 3 Length of hospital stay.

Study

Grahm 1989

In the early jejunal EN group (n= 17) 3 patients had an infection of some sort (2 had pneumonia and 1 had bronchitis). In the delayed EN group (n=15) there was a total of 14 infections in 10 patients reported (3 pneumonia, 10 bronchitis, 1 ventriculitis).

Hadley 1986

In the TPN group (n=24) there was a total of 17 bacterial infections. In the NG group (n=21) there was a total of 15 bacterial infections. These infections occured in 25 patients however it is not reported how many of those patients were in each group. Only the total number of infections for each group is reported.

Minard 2000

In the early nutrition group 6 patients developed pneumonia and in the late group 7 patients developed pneumonia

Sacks 1995

In the early TPN group (n=4) 3 patients developed an infection. In the delayed TPN group (n=5) four patients developed an infection. This information was obtained on contact with the author.

Taylor 1999

One patient in each group suffered aspiration pneumonia (confirmed by tracheal aspiration of feed). Pneumonia from all causes occured in 63% of the delayed group and 44% of the early group.

Young 1987

The incidence of infections was recorded as percentages. In the TPN group (n=23), no patients had sepsis, 26.1% got a urinary tract infection, and 26.1% had pneumonia. In the EN group (n=28) 10.7% had sepsis, 25% had a urinary tract infection and 32.1% had pneumonia. Septicemia was defined by fever, increased WBC count, and positive blood cultures.

Figuras y tablas -
Analysis 1.4

Comparison 1 Timing of intervention: early versus delayed, Outcome 4 Infections.

Comparison 2 Route of intervention: parenteral versus enteral, Outcome 1 Mortality at the end of follow‐up.
Figuras y tablas -
Analysis 2.1

Comparison 2 Route of intervention: parenteral versus enteral, Outcome 1 Mortality at the end of follow‐up.

Comparison 2 Route of intervention: parenteral versus enteral, Outcome 2 Poor outcome at the end of follow‐up.
Figuras y tablas -
Analysis 2.2

Comparison 2 Route of intervention: parenteral versus enteral, Outcome 2 Poor outcome at the end of follow‐up.

Study

Borzotta 1994

In the TPN group the mean length of hospital stay in days was 39.9 (SD 14) and in the EN group the mean length of stay in days was 39.1 (SD23.1).

Chiarelli 1996

The median number of days for hospital stay was given. For the EN group the number was 41 (SD 23) and for the mixed nutrition group the median number of days was 37 (SD 13).

Figuras y tablas -
Analysis 2.3

Comparison 2 Route of intervention: parenteral versus enteral, Outcome 3 Length of hospital stay.

Study

Borzotta 1994

In the TPN group (n=21) there was a total of 39 infections (sinusitis 6, bronchitis 6, pneumonia 9, peritonitis 1, wound infection 1, clostridium difficile 4, UTI 6, intravascular device 2, bacteremia 4). This was a total of 1.86 infections per patient.
In the ENT group (n=28), there was a total of 51 infections (meningitis 2, sinusitis 3, bronchitis 6, pneumonia 15, wound infection 6, clostridium difficile 2, UTI 6, intravascular device 3, bacteremia 8). This was a total of 1.89 infections per patient.

Chiarelli 1996

In the group weaned to TEN (n=12) there were 6 cases of bronchoaspiration and in the group weaned to a mixture of TEN and TPN there were 7 cases of bronchoaspiration.

Hadley 1986

In the TPN group (n=24) there was a total of 17 infections (9 pneumonia, 3 sepsis, 1 wound infection, 2 meningitis and 2 urinary tract). In the NG group (n=21) there was a total of 15 infections (10 pneumonia, 1 sepsis, 2 wound infections, 1 meningitis and 1 urinary tract). These infections occured in 25 patients; however it is not reported how many of those patients were in each group. Only the total number of infections for each group is reported.
NB these are the same data that are in the early vs late comparison.

Young 1987

The incidence of infections was recorded as percentages. In the TPN group (n=23), no patients had sepsis, 26.1% got a urinary tract infection, and 26.1% had pneumonia. In the EN group (n=28) 10.7% had sepsis, 25% had a urinary tract infection and 32.1% had pneumonia.
NB these are the same data that are in the early vs late comparison.

Figuras y tablas -
Analysis 2.4

Comparison 2 Route of intervention: parenteral versus enteral, Outcome 4 Infections.

Comparison 3 Enteral nutrition: jejunal versus gastric, Outcome 1 Mortality at the end of follow‐up.
Figuras y tablas -
Analysis 3.1

Comparison 3 Enteral nutrition: jejunal versus gastric, Outcome 1 Mortality at the end of follow‐up.

Comparison 1. Timing of intervention: early versus delayed

Outcome or subgroup title

No. of studies

No. of participants

Statistical method

Effect size

1 Mortality at the end of follow‐up Show forest plot

7

284

Risk Ratio (M‐H, Fixed, 95% CI)

0.67 [0.41, 1.07]

2 Poor outcome at the end of follow‐up Show forest plot

3

165

Risk Ratio (M‐H, Fixed, 95% CI)

0.75 [0.50, 1.11]

3 Length of hospital stay Show forest plot

Other data

No numeric data

4 Infections Show forest plot

Other data

No numeric data

Figuras y tablas -
Comparison 1. Timing of intervention: early versus delayed
Comparison 2. Route of intervention: parenteral versus enteral

Outcome or subgroup title

No. of studies

No. of participants

Statistical method

Effect size

1 Mortality at the end of follow‐up Show forest plot

5

207

Risk Ratio (M‐H, Fixed, 95% CI)

0.66 [0.41, 1.07]

2 Poor outcome at the end of follow‐up Show forest plot

2

83

Risk Ratio (M‐H, Fixed, 95% CI)

0.69 [0.40, 1.19]

3 Length of hospital stay Show forest plot

Other data

No numeric data

4 Infections Show forest plot

Other data

No numeric data

Figuras y tablas -
Comparison 2. Route of intervention: parenteral versus enteral
Comparison 3. Enteral nutrition: jejunal versus gastric

Outcome or subgroup title

No. of studies

No. of participants

Statistical method

Effect size

1 Mortality at the end of follow‐up Show forest plot

1

32

Risk Ratio (M‐H, Fixed, 95% CI)

0.0 [0.0, 0.0]

2 Infections

Other data

No numeric data

Figuras y tablas -
Comparison 3. Enteral nutrition: jejunal versus gastric