Glucocorticosteroides para pacientes con hepatitis alcohólica
Información
- DOI:
- https://doi.org/10.1002/14651858.CD001511.pub3Copiar DOI

- Base de datos:
-
- Cochrane Database of Systematic Reviews
- Versión publicada:
-
- 02 noviembre 2017see what's new
- Tipo:
-
- Intervention
- Etapa:
-
- Review
- Grupo Editorial Cochrane:
-
Grupo Cochrane de Hepatobiliar
- Copyright:
-
- Copyright © 2017 The Cochrane Collaboration. Published by John Wiley & Sons, Ltd.
Cifras del artículo
Altmetric:
Citado por:
Autores
Contributions of authors
CP, DV, and GC: drafted the review.
DN, ET, and CG: revised the review.
CP and DV are the guarantors of the review.
All authors approved the review.
Sources of support
Internal sources
-
The Cochrane Hepato‐Biliary Group Editorial Team Office, Denmark.
External sources
-
No sources of support supplied
Declarations of interest
CP: no financial, academic, or personal conflicts of interest.
DV: no financial, academic, or personal conflicts of interest.
GC: no financial, academic, or personal conflicts of interest.
ET: no financial, academic, or personal conflicts of interest.
DN: no financial, academic, or personal conflicts of interest.
CG: no financial, academic, or personal conflicts of interest.
Acknowledgements
Cochrane Review Group funding acknowledgement: the Danish State is the largest single funder of Cochrane Hepato‐Biliary through its investment in the Copenhagen Trial Unit, Centre for Clinical Intervention Research, Copenhagen, Denmark. Disclaimer: The views and opinions expressed in this review are those of the authors and do not necessarily reflect those of the Danish State or the Copenhagen Trial Unit.
Peer reviewers: Kurinchi S Gurusamy, UK; Michael Ronan Lucey, USA.
Contact editor: Dario Conte, Italy.
Sign‐off editor: Mirella Fraquelli, Italy.
Version history
| Published | Title | Stage | Authors | Version |
| 2019 Apr 09 | Glucocorticosteroids for people with alcoholic hepatitis | Review | Chavdar S Pavlov, Daria L Varganova, Giovanni Casazza, Emmanuel Tsochatzis, Dimitrinka Nikolova, Christian Gluud | |
| 2017 Nov 02 | Glucocorticosteroids for people with alcoholic hepatitis | Review | Chavdar S Pavlov, Daria L Varganova, Giovanni Casazza, Emmanuel Tsochatzis, Dimitrinka Nikolova, Christian Gluud | |
| 2016 Jun 17 | Glucocorticosteroids for people with alcoholic hepatitis | Protocol | Chavdar S Pavlov, Emmanuel Tsochatzis, Giovanni Casazza, Dimitrinka Nikolova, Edvard Volcek, Christian Gluud | |
| 1999 Jan 25 | Glucocorticosteroids for alcoholic hepatitis | Protocol | Humberto Saconato, Christian Gluud, Erik Christensen, Álvaro N Atallah | |
Differences between protocol and review
-
Review author team changed.
-
We removed the word 'alcohol' from the outcome "Alcohol liver‐related mortality up to three months follow‐up after end of treatment" as it was superfluous.
-
Outcomes
-
All‐cause mortality is now better defined. Duration of treatment varied across the trials and also mortality data for up to three‐months' follow‐up. This is why we have modified all‐cause mortality to all‐cause mortality at the end of treatment, up to three months' follow‐up after randomisation, and one year following randomisation. Thus, our primary time point has become "all‐cause mortality up to three months' follow‐up after randomisation".
-
Trials also reported data on liver‐related mortality, any complication, and non‐serious adverse events up to three months' follow‐up after randomisation. Thus, three months' follow‐up after randomisation has also become our primary time point for the latter outcomes. However, serious adverse events were reported mostly during the treatment period.
-
Regarding exploratory outcomes, we created tables, as we did not have sufficient data for analysis.
-
-
As we did not have trials with low risk of bias, we calculated the diversity‐adjusted required information size (DARIS) for our Trial Sequential Analysis using data from all included trials.
-
We calculated and reported the Trial Sequential Analysis‐adjusted CI as a supplement to the naive 95% CI.
-
We changed the risk of type I error from 2.5% (as originally planned based on the three primary outcomes) into type I error of 1%, as we performed Trial Sequential Analysis on all primary and secondary outcomes.
Notes
Cochrane Reviews can be expected to have a high percentage of overlap in the methods section because of standardised methods. In addition, overlap may be observed across two of our protocols as they share at least four common authors.
Keywords
MeSH
Medical Subject Headings (MeSH) Keywords
Medical Subject Headings Check Words
Adult; Aged; Female; Humans; Male; Middle Aged;
PICO

Study flow diagram

Risk of bias graph: review authors' judgements about each risk of bias domain presented as percentages across all included studies

Risk of bias summary: review authors' judgements about each risk of bias domain for each included study

All‐cause mortality up to three months after randomisation. Fifteen trials provided data. The diversity‐adjusted required information size (DARIS) was calculated based on all‐cause mortality of 30% in the control group; risk ratio reduction in the glucocorticosteroid group of 20%; type I error of 1%; and type II error of 20% (80% power). Trial diversity was 62%. The required information size was 6734 participants. The cumulative Z‐curve (blue line) did not cross the trial sequential monitoring boundaries for benefit or harm (red inward sloping lines) and did not enter the trial sequential monitoring area for futility (inner‐wedge with red outward sloping lines). The green dotted lines show the conventional boundaries of the naive alpha of 5% equal to Z‐scores of +1.96 and ‐1.96.

Funnel plot of comparison 1. Glucocorticosteroids versus no intervention/placebo, outcome 1.1 all‐cause mortality

All‐cause mortality at the end of treatment (median 28 days (range 3 days to 12 weeks) (post hoc analysis). Fourteen trials provided data. The diversity‐adjusted required information size (DARIS) was calculated based on all‐cause mortality of 22% in the control group; risk ratio reduction in the glucocorticosteroid group of 20%; type I error of 1%; and type II error of 20% (80% power). Trial diversity was 59%. The required information size was 9242 participants. The cumulative Z‐curve (blue line) did not cross the trial sequential monitoring boundaries for benefit or harm (red inward sloping lines) and did not enter the trial sequential monitoring area for futility (inner‐wedge with red outward sloping lines). The green dotted lines show the conventional boundaries of the naive alpha of 5% equal to Z‐scores of +1.96 and ‐1.96.

All‐cause mortality up to 1 year (post hoc analysis). Three trials provided data. The diversity‐adjusted required information size (DARIS) was calculated based on mortality in the control group of 40%; risk ratio reduction of 20% in the glucocorticosteroid group; type I error of 1%; and type II error of 20% (80% power). Trial diversity was 0%. The required information size was 1695 participants. The cumulative Z‐curve (blue line) did not cross the trial sequential monitoring boundaries for benefit or harm (red inward sloping lines). The cumulative Z‐curve crossed the inner‐wedge futility line (red outward sloping lines). The green dotted lines show the conventional boundaries of the naive alpha of 5% equal to Z‐scores of +1.96 and ‐1.96.
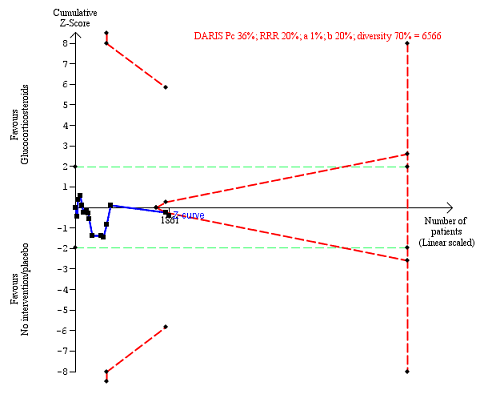
Serious adverse events during treatment. There are 15 trials providing data. The diversity‐adjusted required information size (DARIS) was calculated based on an incidence rate of serious adverse events in the control group of 36%; risk ratio reduction of 20% in the glucocorticosteroid group; type I error of 1%; and type II error of 20% (80% power). Trial diversity was 70%. The required information size was 6566 participants. The cumulative Z‐curve (blue line) did not cross the trial sequential monitoring boundaries for benefit or harm (red inward sloping lines), but it entered the trial sequential monitoring area for futility (inner‐wedge futility line red outward sloping lines) indicating that sufficient information was provided. The green dotted lines show the conventional boundaries of the naive alpha of 5% equal to Z‐scores of +1.96 and ‐1.96.
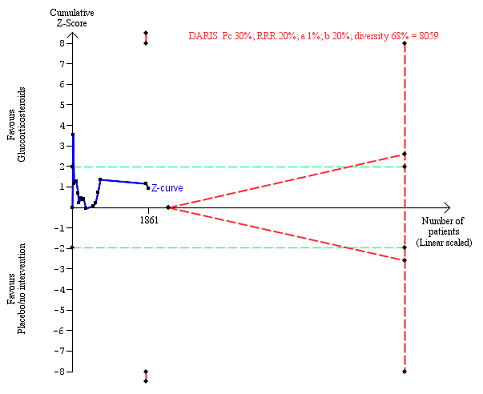
Liver‐related mortality up to three months after randomisation. Fifteen trials provided data. The diversity‐adjusted required information size (DARIS) was calculated based on liver‐ related mortality of 30% in the control group; risk ratio reduction in the glucocorticosteroid group of 20%; type I error of 1%; and type II error of 20% (80% power). Trial diversity was 68%. The required information size was 8059 participants. The cumulative Z‐curve (blue line) did not cross the trial sequential monitoring boundaries for benefit or harm (red inward sloping lines) and did not enter the trial sequential monitoring area for futility (inner‐wedge with red outward sloping lines). The green dotted lines show the conventional boundaries of the naive alpha of 5% equal to Z‐scores of +1.96 and ‐1.96.
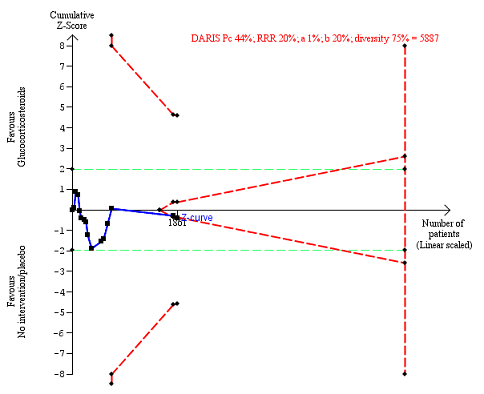
Any complications up to three months after randomisation. Fifteen trials provided data. The diversity‐adjusted required information size (DARIS) was calculated based on any complications of 44% in the control group; risk ratio reduction in the glucocorticosteroid group of 20%; type I error of 1%; and type II error of 20% (80% power). Trial diversity was 75%. The required information size was 5887 participants. The cumulative Z‐curve (blue line) did not cross the trial sequential monitoring boundaries for benefit or harm (red inward sloping lines). The cumulative Z‐curve crossed the inner‐wedge futility line (red outward sloping lines). The green dotted lines show the conventional boundaries of the naive alpha of 5% equal to Z‐scores of +1.96 and ‐1.96.
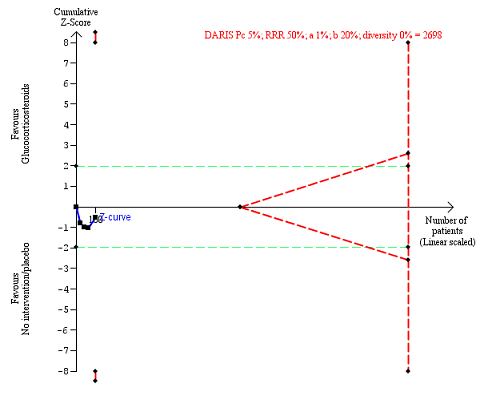
Non‐serious adverse events up to three months after randomisation. Four trials provided data. The diversity‐adjusted required information size (DARIS) was calculated based on non‐serious adverse events of 5% in the control group; risk ratio reduction in the glucocorticosteroid group of 50%; type I error of 1%; and type II error of 20% (80% power). Trial diversity was 0%. The required information size was 2698 participants. The cumulative Z‐curve (blue line) did not cross the trial sequential monitoring boundaries for benefit or harm (red inward sloping lines) and did not enter the trial sequential monitoring area for futility (inner‐wedge with red outward sloping lines). The green dotted lines show the conventional boundaries of the naive alpha of 5% equal to Z‐scores of +1.96 and ‐1.96.

Comparison 1 Glucocorticosteroids versus no intervention/placebo, Outcome 1 All‐cause mortality.

Comparison 1 Glucocorticosteroids versus no intervention/placebo, Outcome 2 Health‐related quality of life.

Comparison 1 Glucocorticosteroids versus no intervention/placebo, Outcome 3 Number of participants with serious adverse events during treatment.

Comparison 1 Glucocorticosteroids versus no intervention/placebo, Outcome 4 Liver‐related mortality.
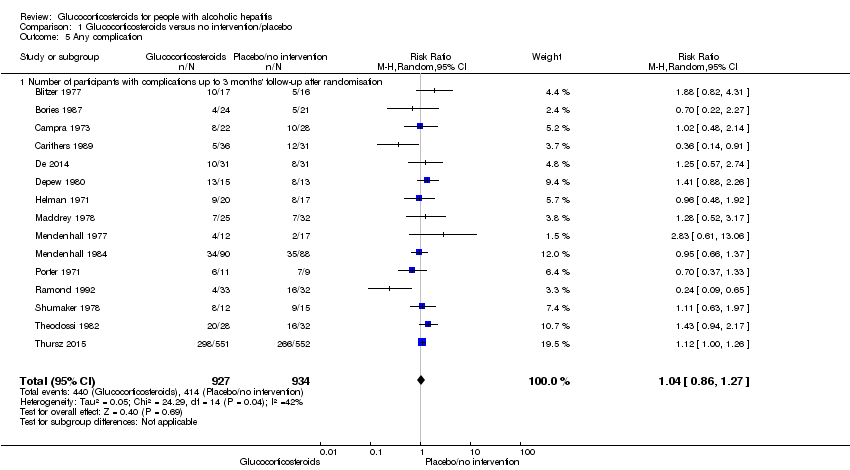
Comparison 1 Glucocorticosteroids versus no intervention/placebo, Outcome 5 Any complication.

Comparison 1 Glucocorticosteroids versus no intervention/placebo, Outcome 6 Number of participants with non‐serious adverse events up to 3 months' follow‐up after randomisation.

Comparison 2 Subgroup analysis: all‐cause mortality up to 3 months after randomisation, Outcome 1 Severity of alcoholic hepatitis.

Comparison 2 Subgroup analysis: all‐cause mortality up to 3 months after randomisation, Outcome 2 Glucocorticosteroid (prednisolone) dose.
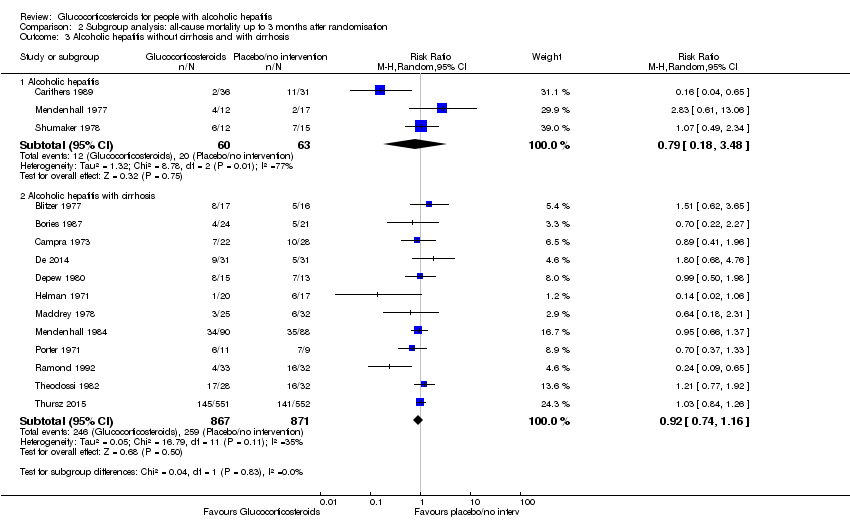
Comparison 2 Subgroup analysis: all‐cause mortality up to 3 months after randomisation, Outcome 3 Alcoholic hepatitis without cirrhosis and with cirrhosis.

Comparison 2 Subgroup analysis: all‐cause mortality up to 3 months after randomisation, Outcome 4 Hepatorenal syndrome.

Comparison 2 Subgroup analysis: all‐cause mortality up to 3 months after randomisation, Outcome 5 Ascites.

Comparison 3 Sensitivity analysis: all‐cause mortality, Outcome 1 Best‐worst scenario all‐cause mortality to 3 months follow‐up.

Comparison 3 Sensitivity analysis: all‐cause mortality, Outcome 2 Worst‐best scenario all‐cause mortality to 3 months follow‐up.

Comparison 4 Sensitivity analysis: serious adverse events, Outcome 1 Best‐worse scenario of serious adverse events during treatment.

Comparison 4 Sensitivity analysis: serious adverse events, Outcome 2 Worst‐best scenario of serious adverse events during treatment.
| Glucocorticosteroids for people with alcoholic hepatitis | ||||||
| Patient or population: participants with alcoholic hepatitis at high risk of mortality and morbidity Settings: hospitals and clinics Intervention: glucocorticosteroids Comparison: placebo or no intervention | ||||||
| Outcomes | Illustrative comparative risks* (95% CI) | Relative effect | No of participants | Quality of the evidence | Comments | |
| Assumed risk | Corresponding risk | |||||
| Placebo or no intervention | Glucocorticosteroids | |||||
| All‐cause mortality: 3 months following randomisation | 298 per 1000 | 278 per 1000 | RR 0.90 (0.70 to 1.15) | 1861 (15 RCTs) | ⊕⊝⊝⊝1 | The Trial Sequential Analysis‐adjusted CI was 0.36 to 2.32 |
| Health‐related quality of life: up to 3 months (measured withEuropean Quality of Life ‐ 5 Dimensions‐3 Levels (EQ‐ 5D‐3L) scale) | The mean value is 0.592 | The mean value is 0.553 | MD ‐0.04; (‐0.11 to 0.03) | 377 (1 RCT) | ⊕⊕⊝⊝2 low | We did not perform Trial Sequential Analysis |
| Serious adverse events during treatment | 361 per 1000 | 389 per 1000 | RR 1.05 (0.85 to 1.29) | 1861 (15 RCTs) | ⊕⊕⊝⊝3 | The Trial Sequential Analysis‐adjusted CI was 0.60 to 1.82 |
| Liver‐related mortality: up to 3 months following randomisation | 298 per 1000 | 277 per 1000 | RR 0.89 (0.69 to 1.14) | 1861 (15 RCTs) | ⊕⊕⊝⊝4 | The Trial Sequential Analysis‐adjusted CI was 0.32 to 2.45 |
| Any complication: up to 3 months following randomisation | 443 per 1000 | 474 per 1000 | RR 1.04 (0.86 to 1.27) | 1861 (15 RCTs) | ⊕⊕⊝⊝5 | The Trial Sequential Analysis‐adjusted CI was 0.67 to 1.63 |
| Number of participants with non‐serious adverse events: up to 3 months' follow‐up after end of treatment | 51 per 1000 | 120 per 1000 | RR 1.99 (0.72 to 5.48) | 160 (4 RCTs) | ⊕⊝⊝⊝6 | The Trial Sequential Analysis‐adjusted CI was 0.01 to 249.60 |
| *The basis for the assumed risk (e.g. the median control group risk across studies) is provided in footnotes. The corresponding risk (and its 95% confidence interval) is based on the assumed risk in the comparison group and the relative effect of the intervention (and its 95% CI). | ||||||
| GRADE Working Group grades of evidence | ||||||
| 1Downgraded 3 levels: 1 level due to within‐study risk of bias (high overall risk of bias in all the trials); 1 level due to inconsistency of the data (there is wide variation in the effect estimates across studies; there is little overlap of confidence intervals associated with the effect estimates; presence of moderate heterogeneity: I² = 45%; heterogeneity could be explained with selection bias); 1 level due to imprecision of effect estimates (the trial sequential analysis showed that additional evidence is needed and that we have not yet reached the required information size). | ||||||
| Trial | Gastrointestinal haemorrhage | Hepatorenal syndrome (with or without hepatic failure) | Septicaemia | Hepatocellular carcinoma | ||||
| Prednisolone | Placebo | Prednisolone | Placebo | Prednisolone | Placebo | Prednisolone | Placebo | |
| 3 | ||||||||
| 4 | 2 | |||||||
| 3 | 5 | 4 | ||||||
| 3 | 2 | 2 | 2 fungal | 1 | ||||
| Not reported | ||||||||
| 1 | 1 | 3 | 6 | |||||
| 3 | 3 | 2 | ||||||
| 2 | 1 | 2 | 1 | |||||
| 11 | 6 | 7 | 6 | |||||
| 3 | 3 | 2 | ||||||
| 2 | 4 | 1 | ||||||
| 2 | ||||||||
| 1 | 2 | 1 | 1 | |||||
| 2 | 3 | 3 | 3 | 1 | ||||
| Type of adverse event | Prednisolone group | Placebo group |
| Gastrointestinal haemorrhage plus variceal bleeding | 40 | 28 |
| Infections | 74 | 43 |
| ‐ lung | 38 | 17 |
| ‐ sepsis | 14 | 14 |
| Outcome or subgroup title | No. of studies | No. of participants | Statistical method | Effect size |
| 1 All‐cause mortality Show forest plot | 15 | Risk Ratio (M‐H, Random, 95% CI) | Subtotals only | |
| 1.1 Up to 3 months after randomisation | 15 | 1861 | Risk Ratio (M‐H, Random, 95% CI) | 0.90 [0.70, 1.15] |
| 1.2 At the end of treatment | 14 | 1824 | Risk Ratio (M‐H, Random, 95% CI) | 0.87 [0.66, 1.15] |
| 1.3 At 1 year after randomisation | 3 | 1343 | Risk Ratio (M‐H, Random, 95% CI) | 1.03 [0.91, 1.17] |
| 2 Health‐related quality of life Show forest plot | 1 | Mean Difference (IV, Random, 95% CI) | Totals not selected | |
| 2.1 Up to three months | 1 | Mean Difference (IV, Random, 95% CI) | 0.0 [0.0, 0.0] | |
| 2.2 Up to one year | 1 | Mean Difference (IV, Random, 95% CI) | 0.0 [0.0, 0.0] | |
| 3 Number of participants with serious adverse events during treatment Show forest plot | 15 | 1861 | Risk Ratio (M‐H, Random, 95% CI) | 1.05 [0.85, 1.29] |
| 4 Liver‐related mortality Show forest plot | 15 | 1861 | Risk Ratio (M‐H, Random, 95% CI) | 0.89 [0.69, 1.14] |
| 4.1 Up to 3 months' follow‐up after randomisation | 15 | 1861 | Risk Ratio (M‐H, Random, 95% CI) | 0.89 [0.69, 1.14] |
| 5 Any complication Show forest plot | 15 | 1861 | Risk Ratio (M‐H, Random, 95% CI) | 1.04 [0.86, 1.27] |
| 5.1 Number of participants with complications up to 3 months' follow‐up after randomisation | 15 | 1861 | Risk Ratio (M‐H, Random, 95% CI) | 1.04 [0.86, 1.27] |
| 6 Number of participants with non‐serious adverse events up to 3 months' follow‐up after randomisation Show forest plot | 4 | 160 | Risk Ratio (M‐H, Fixed, 95% CI) | 1.99 [0.72, 5.48] |
| Outcome or subgroup title | No. of studies | No. of participants | Statistical method | Effect size |
| 1 Severity of alcoholic hepatitis Show forest plot | 15 | Risk Ratio (M‐H, Random, 95% CI) | Subtotals only | |
| 1.1 Mild alcoholic hepatitis | 4 | 182 | Risk Ratio (M‐H, Random, 95% CI) | 1.02 [0.58, 1.80] |
| 1.2 Severe alcoholic hepatitis | 14 | 1679 | Risk Ratio (M‐H, Random, 95% CI) | 0.92 [0.73, 1.16] |
| 2 Glucocorticosteroid (prednisolone) dose Show forest plot | 15 | Risk Ratio (M‐H, Random, 95% CI) | Subtotals only | |
| 2.1 Less than or equal to 40 mg | 10 | 1547 | Risk Ratio (M‐H, Random, 95% CI) | 0.75 [0.50, 1.14] |
| 2.2 More than 40 mg | 5 | 314 | Risk Ratio (M‐H, Random, 95% CI) | 1.02 [0.79, 1.30] |
| 3 Alcoholic hepatitis without cirrhosis and with cirrhosis Show forest plot | 15 | Risk Ratio (M‐H, Random, 95% CI) | Subtotals only | |
| 3.1 Alcoholic hepatitis | 3 | 123 | Risk Ratio (M‐H, Random, 95% CI) | 0.79 [0.18, 3.48] |
| 3.2 Alcoholic hepatitis with cirrhosis | 12 | 1738 | Risk Ratio (M‐H, Random, 95% CI) | 0.92 [0.74, 1.16] |
| 4 Hepatorenal syndrome Show forest plot | 10 | Risk Ratio (M‐H, Random, 95% CI) | Subtotals only | |
| 4.1 With hepatorenal syndrome | 8 | 1382 | Risk Ratio (M‐H, Random, 95% CI) | 1.00 [0.85, 1.17] |
| 4.2 Without hepatorenal syndrome | 2 | 129 | Risk Ratio (M‐H, Random, 95% CI) | 0.56 [0.05, 6.49] |
| 5 Ascites Show forest plot | 13 | Risk Ratio (M‐H, Random, 95% CI) | Subtotals only | |
| 5.1 With ascites | 13 | 729 | Risk Ratio (M‐H, Random, 95% CI) | 0.82 [0.60, 1.12] |
| Outcome or subgroup title | No. of studies | No. of participants | Statistical method | Effect size |
| 1 Best‐worst scenario all‐cause mortality to 3 months follow‐up Show forest plot | 15 | Risk Ratio (M‐H, Random, 95% CI) | Subtotals only | |
| 1.1 Up to 3 months | 15 | 1861 | Risk Ratio (M‐H, Random, 95% CI) | 0.82 [0.64, 1.05] |
| 2 Worst‐best scenario all‐cause mortality to 3 months follow‐up Show forest plot | 15 | Risk Ratio (M‐H, Fixed, 95% CI) | Subtotals only | |
| 2.1 Up to 3 months | 15 | 1861 | Risk Ratio (M‐H, Fixed, 95% CI) | 1.21 [1.06, 1.37] |
| Outcome or subgroup title | No. of studies | No. of participants | Statistical method | Effect size |
| 1 Best‐worse scenario of serious adverse events during treatment Show forest plot | 15 | 1861 | Risk Ratio (M‐H, Random, 95% CI) | 1.00 [0.83, 1.21] |
| 2 Worst‐best scenario of serious adverse events during treatment Show forest plot | 15 | 1861 | Risk Ratio (M‐H, Fixed, 95% CI) | 1.18 [1.05, 1.31] |