Glucocorticosteroides para pacientes con hepatitis alcohólica
Resumen
Antecedentes
La hepatitis alcohólica es una forma de hepatopatía alcohólica, caracterizada por esteatosis, necroinflamación, fibrosis y posibles complicaciones de la hepatopatía. Habitualmente, la hepatitis alcohólica se presenta en pacientes de entre 40 y 50 años de edad. La hepatitis alcohólica puede resolverse si los pacientes se abstienen del consumo de alcohol, aunque el riesgo de muerte dependerá de la gravedad del daño hepático y la abstinencia del alcohol. Los glucocorticosteroides se usan como fármacos antiinflamatorios para los pacientes con hepatitis alcohólica. Los glucocorticosteroides se han estudiado ampliamente en los ensayos clínicos aleatorios para evaluar sus efectos beneficiosos y perjudiciales. Sin embargo, los resultados han sido contradictorios.
Objetivos
Evaluar los efectos beneficiosos y perjudiciales de los glucocorticosteroides en pacientes con hepatitis alcohólica.
Métodos de búsqueda
Se identificaron ensayos mediante búsquedas electrónicas en el Registro de Ensayos Controlados del Grupo Cochrane Hepatobiliar (Cochrane Hepato‐Biliary's (CHB) Controlled Trials Register), CENTRAL, MEDLINE, Embase, LILACS y en el Science Citation Index Expanded. Se buscaron ensayos en curso o no publicados en registros de ensayos clínicos y fuentes de compañías farmacéuticas. También se escanearon las listas de referencias de los estudios recuperados. La última búsqueda fue 20 octubre 2016.
Criterios de selección
Ensayos clínicos aleatorios que evaluaran los glucocorticosteroides versus placebo o ninguna intervención en pacientes con hepatitis alcohólica, de forma independiente del año, el idioma de la publicación o el formato. Se consideraron los ensayos con participantes adultos con diagnóstico de hepatitis alcohólica, que se pudiese haber establecido a través de criterios diagnósticos clínicos o bioquímicos, o ambos. La hepatitis alcohólica se definió como leve (puntuación de Maddrey menor que 32) y como grave (puntuación de Maddrey de 32 o más). Se permitieron las cointervenciones en los grupos de ensayo, siempre que fueran similares.
Obtención y análisis de los datos
Se respetó la metodología Cochrane y CHB, mediante la realización de metanálisis con Review Manager 5 y el Análisis Secuencial de Ensayos. Los hallazgos de los resultados dicotómicos se presentaron como cocientes de riesgos (CR) y los de los resultados continuos como diferencias de medias (DM). Se aplicaron metanálisis tanto con el modelo de efectos fijos como con el modelo de efectos aleatorios. Cuando hubo discrepancias significativas en los resultados, se informó la estimación puntual más conservadora de los dos. Un valor de p de 0,01 o menos, de dos colas, se consideró estadísticamente significativo cuando se alcanzó el tamaño de información necesario debido a los tres resultados primarios (mortalidad por todas las causas, calidad de vida relacionada con la salud y eventos adversos graves durante el tratamiento) y la decisión post hoc de incluir análisis de la mortalidad en más puntos temporales. Se presentó la heterogeneidad con la estadística de I². Cuando los investigadores usaron el análisis de intención de tratar para considerar los datos faltantes, dichos datos se utilizaron en el análisis primario; de lo contrario, se utilizaron los datos disponibles. El riesgo de sesgo de los ensayos se evaluó mediante los dominios del riesgo de sesgo, y la calidad de la evidencia con el uso de GRADE.
Resultados principales
Dieciséis ensayos cumplieron los criterios de inclusión. Todos los ensayos presentaron un alto riesgo de sesgo. Quince ensayos aportaron datos para el análisis (927 participantes recibieron glucocorticosteroides, y 934, placebo o ninguna intervención). Los glucocorticosteroides fueron administrados por vía oral o parenteral durante una mediana de 28 días (intervalo de tres días a 12 semanas). Los participantes tenían entre 25 y 70 años de edad, presentaban diferentes estadios de la hepatopatía alcohólica y un 65% eran hombres. El seguimiento de los participantes del ensayo, cuando se informó, fue hasta el momento del alta del hospital, hasta la muerte (una mediana de 63 días), o durante al menos un año. No hubo evidencia del efecto de los glucocorticosteroides sobre la mortalidad por todas las causas hasta tres meses después de la asignación al azar ni con el metanálisis tradicional (CR de efectos aleatorios 0,90; IC del 95%: 0,70 a 1,15; participantes = 1861; ensayos = 15; I² = 45% [heterogeneidad moderada]) ni con el Análisis Secuencial de Ensayos. El metanálisis no mostró evidencia de efectos sobre la calidad de vida relacionada con la salud hasta los tres meses (DM ‐0,04 puntos; IC del 95%: ‐0,11 a 0,03; participantes = 377; ensayo = 1; evidencia de baja calidad), medido con la escala European Quality of Life ‐ 5 Dimensions‐3 Levels (EQ‐ 5D‐3L). No hubo evidencia de efectos sobre los eventos adversos graves durante el tratamiento ni con el metanálisis tradicional (CR de efectos aleatorios 1,05; IC del 95%: 0,85 a 1,29; participantes = 1861; ensayos = 15; I² = 36% [heterogeneidad moderada]), la mortalidad relacionada con la hepatopatía hasta tres meses después de la asignación al azar (CR de efectos aleatorios 0,89; IC del 95%: 0,69 a 1,14; participantes = 1861; ensayos = 15; I² = 46% [heterogeneidad moderada]), la frecuencia de cualquier complicación hasta tres meses después de la asignación al azar (CR de efectos aleatorios 1,04; IC del 95%: 0,86 a 1,27; participantes = 1861; I² = 42% [heterogeneidad moderada]) y la frecuencia de eventos adversos no graves hasta los tres meses de seguimiento después del final del tratamiento (CR de efectos aleatorios 1,99; IC del 95%: 0,72 a 5,48; participantes = 160; ensayos = 4; I² = 0% [ninguna heterogeneidad]) ni con el Análisis Secuencial de Ensayos. Nueve de los ensayos fueron patrocinados por la industria.
Conclusiones de los autores
No se halló evidencia de una diferencia entre los glucocorticosteroides y el placebo o ninguna intervención en la mortalidad por todas las causas, la calidad de vida relacionada con la salud y los eventos adversos graves durante el tratamiento. El riesgo de sesgo fue alto y la calidad de la evidencia fue muy baja o baja. Por lo tanto, no existe mucha seguridad acerca de este cálculo del efecto. Dado el informe insuficiente, no puede excluirse el aumento de los eventos adversos. Debido a la amplitud de los intervalos de confianza, no se pueden descartar efectos beneficiosos y perjudiciales significativos de los glucocorticosteroides. Por lo tanto, se necesitan ensayos clínicos aleatorios controlados con placebo, diseñados según las guías SPIRIT e informados según las guías CONSORT. Los ensayos futuros deben informar datos despersonalizados de los participantes individuales, para que puedan realizarse metanálisis adecuados de los datos de los participantes individuales en cuanto a los efectos de los glucocorticosteroides en los subgrupos.
PICO
Resumen en términos sencillos
Glucocorticosteroides para pacientes con hepatitis alcohólica
Pregunta de la revisión
Evaluar los efectos beneficiosos y perjudiciales de los glucocorticosteroides administrados por cualquier vía, en cualquier dosis y duración versus placebo o ninguna intervención en pacientes con hepatitis alcohólica en cuanto a la muerte, la calidad de vida relacionada con la salud y las complicaciones.
Antecedentes
El consumo excesivo de alcohol puede dañar el hígado y causar hepatitis alcohólica. El primer estadio del daño hepático en la hepatitis alcohólica generalmente es reversible si el paciente se abstiene del consumo de alcohol, aunque el riesgo de desarrollo adicional de la enfermedad y de más complicaciones aumenta al reanudar el consumo. Un bebedor empedernido se considera un paciente que consume más de 60 g a 80 g (para los hombres) o más de 20 g de alcohol (para las mujeres) por día. Es muy probable que sólo 10 a 35 pacientes de 100 bebedores empedernidos con evidencia de grasa excesiva en el hígado desarrollen hepatitis alcohólica. Con el tiempo, la hepatitis alcohólica causará fibrosis hepática (cicatrización del hígado) o cirrosis hepática con complicaciones (hemorragia, infecciones, cáncer de hígado, etc.).
Se considera que los glucocorticosteroides tienen efectos antiinflamatorios (alivio del dolor, el edema, la fiebre). Son administrados a los pacientes con hepatitis alcohólica para reparar el daño hepático. Sin embargo, los efectos beneficiosos y perjudiciales de los glucocorticosteroides no se han estudiado de forma adecuada en los ensayos clínicos aleatorios, y por lo tanto, no se conoce si deben usarse en la práctica clínica para los pacientes con hepatopatía alcohólica.
Fecha de la búsqueda
La fecha de la última búsqueda fue 20 octubre 2016.
Características de los estudios
Dieciséis ensayos clínicos aleatorios compararon los glucocorticosteroides con placebo o ninguna intervención en pacientes con hepatitis alcohólica. Quince ensayos aportaron datos para el análisis (927 participantes recibieron glucocorticosteroides, y 934, placebo o ninguna intervención). Los glucocorticosteroides fueron administrados por vía oral o parenteral durante una mediana de 28 días (intervalo de tres días a 12 semanas). Los participantes del ensayo tenían entre 25 y 70 años (hombres: 65%) y presentaban diferentes estadios de la hepatopatía alcohólica. El seguimiento de los participantes del ensayo se realizó hasta el momento del alta del hospital, o hasta la muerte (una mediana de 63 días), o durante al menos un año. No todos los ensayos informaron el seguimiento de los participantes. Los ensayos se realizaron en Francia, India, Reino Unido y Estados Unidos. Dos ensayos administraron pentoxifilina tanto a los grupos de intervención de glucocorticosteroides como de placebo.
Financiación
Nueve de los ensayos fueron patrocinados por la industria.
Calidad de la evidencia
La calidad general de la evidencia fue muy baja, baja o moderada, y todos los ensayos presentaban un riesgo alto de sesgo, lo cual significa que existe la posibilidad de establecer conclusiones equivocadas que sobrestimen los beneficios o subestimen los efectos perjudiciales de los glucocorticosteroides por la forma en que se realizaron y analizaron los ensayos.
Resultados clave
Los glucocorticosteroides no presentan beneficios en los resultados clínicos de importancia para los pacientes con hepatopatía alcohólica, como la mortalidad, sin importar la causa, y la calidad de vida relacionada con la salud. Además, los glucocorticosteroides pueden aumentar el número de eventos adversos. No es posible excluir los efectos beneficiosos y perjudiciales de los glucocorticosteroides aunque los investigadores deben estudiar de forma adicional los efectos en ensayos clínicos aleatorios de alta calidad, controlados con placebo. Dichos ensayos deben registrarse antes de ser realizados y deben informar abiertamente los datos despersonalizados de los participantes individuales para que pueda realizarse el metanálisis de los datos de los participantes individuales.
Conclusiones de los autores
Summary of findings
| Glucocorticosteroids for people with alcoholic hepatitis | ||||||
| Patient or population: participants with alcoholic hepatitis at high risk of mortality and morbidity Settings: hospitals and clinics Intervention: glucocorticosteroids Comparison: placebo or no intervention | ||||||
| Outcomes | Illustrative comparative risks* (95% CI) | Relative effect | No of participants | Quality of the evidence | Comments | |
| Assumed risk | Corresponding risk | |||||
| Placebo or no intervention | Glucocorticosteroids | |||||
| All‐cause mortality: 3 months following randomisation | 298 per 1000 | 278 per 1000 | RR 0.90 (0.70 to 1.15) | 1861 (15 RCTs) | ⊕⊝⊝⊝1 | The Trial Sequential Analysis‐adjusted CI was 0.36 to 2.32 |
| Health‐related quality of life: up to 3 months (measured withEuropean Quality of Life ‐ 5 Dimensions‐3 Levels (EQ‐ 5D‐3L) scale) | The mean value is 0.592 | The mean value is 0.553 | MD ‐0.04; (‐0.11 to 0.03) | 377 (1 RCT) | ⊕⊕⊝⊝2 low | We did not perform Trial Sequential Analysis |
| Serious adverse events during treatment | 361 per 1000 | 389 per 1000 | RR 1.05 (0.85 to 1.29) | 1861 (15 RCTs) | ⊕⊕⊝⊝3 | The Trial Sequential Analysis‐adjusted CI was 0.60 to 1.82 |
| Liver‐related mortality: up to 3 months following randomisation | 298 per 1000 | 277 per 1000 | RR 0.89 (0.69 to 1.14) | 1861 (15 RCTs) | ⊕⊕⊝⊝4 | The Trial Sequential Analysis‐adjusted CI was 0.32 to 2.45 |
| Any complication: up to 3 months following randomisation | 443 per 1000 | 474 per 1000 | RR 1.04 (0.86 to 1.27) | 1861 (15 RCTs) | ⊕⊕⊝⊝5 | The Trial Sequential Analysis‐adjusted CI was 0.67 to 1.63 |
| Number of participants with non‐serious adverse events: up to 3 months' follow‐up after end of treatment | 51 per 1000 | 120 per 1000 | RR 1.99 (0.72 to 5.48) | 160 (4 RCTs) | ⊕⊝⊝⊝6 | The Trial Sequential Analysis‐adjusted CI was 0.01 to 249.60 |
| *The basis for the assumed risk (e.g. the median control group risk across studies) is provided in footnotes. The corresponding risk (and its 95% confidence interval) is based on the assumed risk in the comparison group and the relative effect of the intervention (and its 95% CI). | ||||||
| GRADE Working Group grades of evidence | ||||||
| 1Downgraded 3 levels: 1 level due to within‐study risk of bias (high overall risk of bias in all the trials); 1 level due to inconsistency of the data (there is wide variation in the effect estimates across studies; there is little overlap of confidence intervals associated with the effect estimates; presence of moderate heterogeneity: I² = 45%; heterogeneity could be explained with selection bias); 1 level due to imprecision of effect estimates (the trial sequential analysis showed that additional evidence is needed and that we have not yet reached the required information size). | ||||||
Antecedentes
Descripción de la afección
El término “hepatitis alcohólica” se usó por primera vez en un documento de Beckett y colegas en 1961(Beckett 1961), aunque la ictericia clínica después del consumo excesivo de etanol se informó en la bibliografía mucho tiempo antes(Gerber 1973). Muy probablemente estos informes representaron a los pacientes con hepatitis alcohólica(Mendenhall 1984; Jensen 1994).
La hepatitis alcohólica es una forma grave de hepatopatía alcohólica (daño en el hígado debido al consumo excesivo de alcohol) (WHO 2010).
El primer estadio del daño hepático en la hepatitis alcohólica generalmente es reversible si los pacientes se abstienen de consumir alcohol, aunque el riesgo de progresión a la fibrosis y a la cirrosis aumenta al reanudar el consumo (Ellis 2012). La acumulación de grasa en los hepatocitos causa la interrupción de la beta‐oxidación mitocondrial de los ácidos grasos, la acumulación de metabolitos lipotóxicos y la liberación de especies de oxígeno reactivo (Lieber 1999; Wu 1999; Petrasek 2013). Los metabolitos lipotóxicos y las especies de oxígeno reactivo dan lugar a la muerte de las células y a la inflamación del hígado (Wu 1999; Petrasek 2013; WHO 2013). La hepatitis alcohólica es una forma histológica de hepatopatía alcohólica, caracterizada por esteatosis (el estadio más temprano del daño del hígado alcohólico) y necroinflamación(EASL 2012b). La hepatitis alcohólica puede resolverse si los pacientes se abstienen de beber, aunque el riesgo de muerte dependerá de la gravedad del daño hepático y los modelos de consumo de alcohol. En un 20% a un 40% de los bebedores empedernidos persistentes (definido como consumo de alcohol por día de más de 60 g a 80 g en los hombres y más de 20 g en las mujeres), puede presentarse hepatitis alcohólica y otras complicaciones (WHO 2013).
La hepatitis alcohólica grave puede caracterizarse por signos clínicamente claros de ictericia, coagulopatía, descompensación hepática con ascitis, hipertensión portal, hemorragia de las várices, síndrome hepatorrenal, encefalopatía hepática, síndrome de respuesta inflamatoria sistémica o septicemia (Becker 1996; EASL 2012b). Habitualmente, la hepatitis alcohólica se presenta en pacientes de entre 40 y 50 años de edad. Entre los factores de riesgo de desarrollar hepatitis alcohólica grave se encuentran ser mujer, el grupo étnico hispano, diversos tipos de alcohol, beber en forma compulsiva, la nutrición deficiente, la obesidad, etc.(WHO 2010). Existen varias puntuaciones pronósticas compuestas para distinguir a los pacientes con un pronóstico deficiente de los que pueden volverse abstinentes, con atención de apoyo hasta que se logre la recuperación. Algunas de estas puntuaciones, diseñadas para predecir la mortalidad, son la Maddrey's Discriminant Function (Maddrey 1978), la puntuación del modelo de hepatopatía terminal (MELD, por sus siglas en inglés) (Dunn 2005), la puntuación de Glasgow de la hepatitis alcohólica (Forrest 2005), y la puntuación de la edad, la bilirrubina, el cociente normalizado internacional, la creatinina (ABIC, por sus siglas en inglés) (Dominguez 2008).
La Maddrey Discriminant Function es la puntuación utilizada con mayor frecuencia en la hepatitis alcohólica grave para identificar a los pacientes con una posible necesidad de glucocorticosteroides (también conocidos como glucocorticosteroides, corticosteroides, o esteroides). La supervivencia a un mes de los pacientes con hepatitis alcohólica y con una puntuación de Maddrey mayor que 32 varió entre un 50% y un 65% (Carithers 1989; Phillips 2006). El Lille Model (www.lillemodel.com) es el único modelo validado hasta el presente para evaluar la respuesta a los glucocorticosteroides y es altamente predictivo de la muerte a los seis meses (valor de p < 0,000001) en los pacientes con hepatitis alcohólica grave (Louvet 2007). Una puntuación del Lille Model mayor que 0,45; calculada después de siete días de tratamiento con prednisolona, significa el fracaso en la respuesta al tratamiento y predice una mortalidad a los seis meses de alrededor del 75% (Lefkowitch 2005).
Descripción de la intervención
Los glucocorticosteroides se usan como antiinflamatorios. Los agentes glucocorticosteroides imitan al glucocorticoide de producción endógena (cortisol)(Rhen 2005). Se considera que los glucocorticosteroides, principalmente regulados por la corticotrofina, tienen efectos antiinflamatorios así como efectos metabólicos e inmunogénicos en el cuerpo (Rhen 2005). Se acepta que los efectos antiinflamatorios de los glucocorticosteroides están mediados principalmente por la represión de la transcripción de genes (Schäcke 2002).
De qué manera podría funcionar la intervención
Los glucocorticosteroides administrados a los pacientes con hepatitis alcohólica reparan el daño hepático mediante la disminución de los infiltrados del neutrófilo polimorfonuclear (NPM) del hígado (células efectoras) y el nivel de los mediadores proinflamatorios como el factor de necrosis tumoral alfa (FNT‐alfa), la molécula de adhesión intercelular 1 y la interleucina (IL)‐6 e IL‐8 en el tejido hepático(Taïeb 2000; Spahr 2001). Los beneficios de los corticosteroides resultan de los cambios vasculares a corto plazo (Schäcke 2002). Sin embargo, los eventos adversos aún han sido informados de manera deficiente (Christensen 1995; Rambaldi 2008).
Por qué es importante realizar esta revisión
Con el transcurso de los años, varios ensayos clínicos aleatorios han estudiado los efectos beneficiosos y perjudiciales de los corticosteroides para los pacientes con hepatitis alcohólica, para determinar la mejor vía de administración, dosis y duración. Sin embargo, los resultados han sido contradictorios. Algunas revisiones sistemáticas(Christensen 1995; Rambaldi 2008)y metanálisis de ensayos clínicos aleatorios (Reynolds 1989; Imperiale 1990; Daures 1991; Christensen 1999; Mathurin 2011)han sido publicados. Los autores de las revisiones explicaron las diversas conclusiones con respecto a los resultados orientados a los pacientes como debidas a las diferencias en los regímenes de glucocorticosteroides, la calidad del ensayo, las características de los participantes y el espectro clínico de la enfermedad. Reynolds 1989 concluyó que el tratamiento con corticosteroides sólo podría ayudar a los pacientes con hepatitis alcohólica grave que presentaran una mayor gravedad de la enfermedad y caracterizada por niveles altos de bilirrubina en suero, tiempo de protrombina prolongado y desarrollo de encefalopatía hepática. Imperiale 1990 concluyó que los glucocorticosteroides redujeron la mortalidad a corto plazo en los pacientes con hepatitis alcohólica grave, siempre que también presentaran encefalopatía hepática pero no hemorragia gastrointestinal grave. Daures 1991 concluyó que se necesitaban ensayos clínicos aleatorios adicionales para confirmar los efectos beneficiosos y perjudiciales de los glucocorticosteroides, especialmente en los pacientes con hepatitis alcohólica grave. Christensen 1995,Christensen 1999,y Rambaldi 2006 no pudieron encontrar evidencia suficiente para apoyar el uso sistemático de glucocorticosteroides en los pacientes con hepatitis alcohólica, incluidos los que presentan encefalopatía hepática. Rambaldi 2008 concluyó que los glucocorticosteroides no mejoraron la supervivencia general en los pacientes con hepatitis alcohólica. Basado en el Análisis Secuencial de Ensayos del subgrupo de pacientes con una puntuación de Maddrey de al menos 32 o encefalopatía hepática espontánea, no pudo lograrse el tamaño necesario de información de 2420 personas para el resultado de la mortalidad; sólo hubo 249 participantes asignados al azar en los seis ensayos aleatorios(Rambaldi 2008). Mediante el modelo Lille, Mathurin 2011 concluyó que los glucocorticosteroides mejoraron significativamente la supervivencia a 28 días en los pacientes con hepatitis alcohólica grave. El metanálisis de Mathurin 2011 se basó en los datos individuales de cinco ensayos clínicos aleatorios seleccionados y en consecuencia está en riesgo de sesgo de selección. Por esta razón se decidió realizar esta revisión sistemática Cochrane para evaluar la eficacia de los glucocorticosteroides en los pacientes con hepatitis alcohólica grave con o sin complicaciones.
Objetivos
Evaluar los efectos beneficiosos y perjudiciales de los glucocorticosteroides en pacientes con hepatitis alcohólica.
Métodos
Criterios de inclusión de estudios para esta revisión
Tipos de estudios
Se incluyeron ensayos clínicos aleatorios en los cuales se evaluaron los glucocorticosteroides en los pacientes con hepatitis alcohólica, independientemente del año o el idioma de la publicación o el formato.
No se encontró ningún informe de los estudios cuasialeatorios u observacionales recuperados con las búsquedas de ensayos clínicos aleatorios, para extraer los datos sobre los efectos perjudiciales.
Tipos de participantes
Se incluyeron participantes adultos con hepatitis alcohólica, diagnosticados según la revisión de diagnóstico usada en el ensayo clínico aleatorio individual. La hepatitis alcohólica podía haberse establecido a través de los criterios diagnósticos clínicos o bioquímicos o ambos.
La hepatitis alcohólica se consideró leve si el participante asignado al azar tenía una puntuación de Maddrey menor que 32 (puntuación de Maddrey = 4,6 x [tiempo de protrombina ‐ tiempo de control][s] + bilirrubina en suero [mg por dl])(Maddrey 1978). Generalmente, los pacientes con hepatitis alcohólica leve no presentan hemorragia gastrointestinal concomitante.
La hepatitis alcohólica se consideró grave en cualquier estadio de la hepatopatía alcohólica con la presencia de encefalopatía hepática espontánea; o una puntuación de Maddrey igual a o mayor que 32. También se examinó si había una diferencia en cuanto al inicio del tratamiento con glucocorticosteroides en los ensayos que utilizaron la puntuación del Maddrey, en que la hepatitis alcohólica grave se definió como igual o mayor que 32.
Los participantes de los ensayos incluidos con diagnóstico de hepatitis alcohólica grave también podían manifestar encefalopatía hepática, hemorragia gastrointestinal, cirrosis (p.ej. clasificada con la puntuación Child‐Pugh ‐ Child‐Pugh tipo C [Pugh 1973]), ascitis, síndrome hepatorrenal, hiponatremia o peritonitis bacteriana espontánea.
Para los estudios que no informan la puntuación de Maddrey, se utilizaron las clasificaciones para la hepatitis alcohólica leve y grave según lo estipulado por los investigadores.
Tipos de intervenciones
Glucocorticosteroides administrados por cualquier vía, en cualquier dosis y duración versus placebo o ninguna intervención.
Se permitieron las cointervenciones en los grupos del ensayo, siempre que fueran las mismas.
Tipos de medida de resultado
Resultados primarios
-
Mortalidad por todas las causas: hasta tres meses de seguimiento después de la asignación al azar (el punto temporal primario para establecer la conclusión principal); al final del tratamiento (análisis post hoc); y un año después de la asignación al azar (análisis post hoc)
-
Calidad de vida relacionada con la salud, según la definieron los autores de los ensayos
-
Eventos adversos graves durante el tratamiento. Se utilizó la definición de las International Conference on Harmonisation (ICH) Guidelines for Good Clinical Practice de un evento adverso grave (ICH‐GCP 1997), o sea, cualquier ocurrencia médica adversa que resulta en la muerte, es potencialmente mortal, requiere hospitalización o la prolongación de la hospitalización existente, da lugar a discapacidad o incapacidad persistente o significativa o es una malformación congénita o un defecto de nacimiento. Se consideró que todos los demás eventos adversos eran no graves (ver a continuación).
Resultados secundarios
-
Mortalidad relacionada con la hepatopatía hasta los tres meses de seguimiento después de la asignación al azar
-
Participantes con cualquier complicación hasta los tres meses de seguimiento después de la asignación al azar (es decir ascitis, síndrome hepatorrenal, peritonitis bacteriana espontánea, hemorragia gastrointestinal, encefalopatía hepática, ictericia sin obstrucción, síndrome de respuesta inflamatoria sistémica, septicemia, o carcinoma hepatocelular, o una combinación de cualquiera de las mismas)
-
Participantes con eventos adversos no graves hasta los tres meses de seguimiento después de la asignación al azar
Análisis exploratorio
-
Participantes con un aumento de las enzimas hepáticas tal como lo definieron los investigadores
-
Participantes con una disminución del índice de protrombina tal como lo definieron los investigadores
-
Participantes con una disminución de la albúmina sérica tal como lo definieron los investigadores
Results
Description of studies
See: Characteristics of included studies; Characteristics of excluded studies.
Results of the search
We identified 932 potentially relevant records through the electronic searches (Figure 1). Of these, 37 records that referred to 16 randomised clinical trials fulfilled our inclusion criteria. We found two trials published in abstract form (Mendenhall 1977; Richardet 1993), and fourteen trials described in full paper articles (Helman 1971; Porter 1971; Campra 1973; Blitzer 1977; Maddrey 1978; Shumaker 1978; Depew 1980; Theodossi 1982; Mendenhall 1984; Bories 1987; Carithers 1989; Ramond 1992; De 2014; Thursz 2015). Our searches retrieved no quasi‐randomised trials or observational studies. We identified no additional references by handsearching the reference lists of articles, retrieved through the computerised databases.
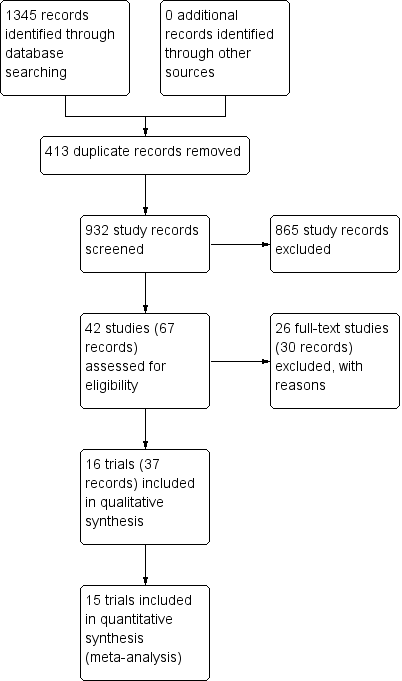
Study flow diagram
Included studies
Sixteen randomised clinical trials fulfilled our review protocol inclusion criteria (Helman 1971; Porter 1971; Campra 1973; Blitzer 1977; Mendenhall 1977; Maddrey 1978; Shumaker 1978; Depew 1980; Theodossi 1982; Mendenhall 1984; Bories 1987; Carithers 1989; Ramond 1992; Richardet 1993; De 2014; Thursz 2015). Two were three‐armed trials (Mendenhall 1977; Mendenhall 1984), one trial was a randomised trial with a two‐by‐two factorial design (Thursz 2015), one trial was a cross‐over trial (Richardet 1993), and the remaining were parallel, two‐group design trials. There were 1884 participants randomised in all trials. Some participants from Mendenhall 1977 (pilot trial or feasibility trial) continued participation in Mendenhall 1984. The trials were conducted in France (n = 3), India (n = 1), UK (n = 2), and USA (n = 10) (Characteristics of included studies). All the trials reported the sex (65% of the participants were men) and age of the participants (range 25 years to 70 years). Four trials excluded women (Blitzer 1977; Mendenhall 1977; Mendenhall 1984; De 2014). Eleven trials reported to have included trial participants at different stages of alcoholic liver disease due to hepatitis, fibrosis, or cirrhosis (Helman 1971; Porter 1971; Campra 1973; Blitzer 1977; Maddrey 1978; Depew 1980; Theodossi 1982; Mendenhall 1984Bories 1987; Ramond 1992; Thursz 2015). Most trials established diagnosis primarily through liver biopsy. One trial included only participants with liver cirrhosis in addition to alcoholic hepatitis (De 2014). The remaining trials did not provide information on the stage of disease. All the trials included participants with recent history of alcohol consumption, increase of serum bilirubin, liver enzymes, prolonged prothrombin time, and participants without previous treatment with glucocorticosteroids within the last three months before the start of the trial. Ten trials performed liver biopsy whenever possible (Helman 1971; Porter 1971; Campra 1973; Blitzer 1977; Maddrey 1978; Shumaker 1978; Depew 1980; Bories 1987; Ramond 1992; Thursz 2015); however, it was an inclusion criterion in only one trial, performed at the admission and after treatment (Helman 1971).
Ten trials reported the period of trial enrolment (range of one year to five years, with the median of three years) (Campra 1973; Blitzer 1977; Mendenhall 1977; Maddrey 1978; Depew 1980; Mendenhall 1984; Bories 1987; Carithers 1989; De 2014; Thursz 2015). The earliest trial began participant recruitment in 1966 (Campra 1973), and the most recently published trial began recruitment in 2011 and completed it in 2014 (Thursz 2015).
Three trials followed participants up to one year Mendenhall 1984, De 2014 and Thursz 2015. The remaining trials followed their participants to the moment of discharge from the hospital or until death occurred, with a median duration of follow‐up of 63 days (range 28 to 120).
We could extract data for analysis from all 16 trials but one (Richardet 1993). We contacted Richardet in 2006, but we did not receive a reply. In the remaining 15 trials, 182 participants had mild alcoholic hepatitis and 1679 had severe alcoholic hepatitis. The analyses of the 15 trials accounted for 927 participants randomised to glucocorticosteroids, and 934 participants randomised to placebo or no intervention.
Experimental interventions
Glucocorticosteroids (prednisolone or 6‐methylprednisolone in equivalent dose of prednisolone) were administered orally or parenterally at different dose regimens and different durations. Twelve trials assessed oral glucocorticosteroids at a dose equal to or more than 40 mg prednisolone (Helman 1971; Mendenhall 1977; Maddrey 1978; Shumaker 1978; Depew 1980; Mendenhall 1984; Bories 1987; Carithers 1989; Ramond 1992; Richardet 1993; De 2014; Thursz 2015), but three trials also allowed parenteral administration to participants who were not able to swallow (Shumaker 1978; Carithers 1989; Ramond 1992). Two trials assessed oral glucocorticosteroids at a dose less than 40 mg prednisolone (Campra 1973; Blitzer 1977), and in one trial the initial therapy was parenteral and then it was administered orally (Porter 1971). One trial used only parenteral (intravenous) glucocorticosteroids (Theodossi 1982).
The median duration of glucocorticosteroid administration was 28 days with a range of three days (Theodossi 1982) to 11 weeks (De 2014): one week (Richardet 1993), three weeks (Mendenhall 1977), four weeks (Ramond 1992; Thursz 2015), 26 days (Blitzer 1977), one month (Maddrey 1978; Mendenhall 1984; Bories 1987), five weeks (Shumaker 1978; Carithers 1989), six weeks (Helman 1971;Campra 1973; Depew 1980), 45 days (Porter 1971). The dose of prednisolone was tapered until it was stopped in Helman 1971; Porter 1971; Campra 1973; Blitzer 1977; Mendenhall 1977; Shumaker 1978; Depew 1980; Mendenhall 1984; Carithers 1989; and De 2014.
Control interventions
Twelve trials used identical placebos (Helman 1971; Porter 1971; Blitzer 1977; Mendenhall 1977; Maddrey 1978; Shumaker 1978; Depew 1980; Mendenhall 1984; Carithers 1989; Ramond 1992; De 2014; Thursz 2015) and four trials used no intervention (Campra 1973; Theodossi 1982; Bories 1987; Richardet 1993).
Co‐interventions
Two trials administered pentoxifylline to both glucocorticosteroids and placebo intervention groups (De 2014; Thursz 2015). There seemed to be no interaction between the intervention effects of pentoxifylline and glucocorticosteroids (De 2014; Thursz 2015).
Outcomes
The Characteristics of included studies tables detail the outcomes reported in the individual trials. Five trials reported on outcomes with a follow‐up period up to three months after randomisation (Helman 1971; Mendenhall 1977; Bories 1987; De 2014; Thursz 2015). Twelve trials reported on outcomes at the end of treatment or at the moment of discharge from the hospital (Helman 1971; Porter 1971; Campra 1973; Blitzer 1977; Maddrey 1978; Shumaker 1978; Depew 1980; Theodossi 1982; Bories 1987; Carithers 1989; Ramond 1992; Richardet 1993). Three trials exceeded the 12‐month follow‐up period (Mendenhall 1984; De 2014; Thursz 2015).
Only one trial reported health‐related quality of life, using the European quality of life‐5 dimensions (EQ‐5D) score registered to Eudra CT 2009‐ 013897‐42 and ISRCTN 88782125 and it was reported in all the groups at three months' follow‐up after randomisation, and at one year (Thursz 2015; see Notes in Characteristics of included studies).
None of the trials provided usable data for meta‐analyses of our exploratory outcomes.
For further details on trial characteristics, please see Characteristics of included studies.
Excluded studies
We excluded 26 trials from the final assessment with the reasons for their exclusion provided in Characteristics of excluded studies.
Among the excluded trials are two trials that used a nutritional intervention in the control group (Lesesne 1978; Cabré 2000). Although nutritional intervention as an overall intervention does not seem to influence mortality or serious adverse events (Feinberg 2017), including the Cabré 2000 and Lesesne 1978 trials in our review would not have affected our results noticeably because these trials were small and had very few events.
Risk of bias in included studies
Allocation
Allocation sequence generation
Based on the information that we collected from the published reports and information from study authors, we assessed the allocation sequence generation as low risk of bias in eight trials (Porter 1971; Campra 1973; Blitzer 1977; Maddrey 1978; Carithers 1989; Ramond 1992; De 2014; Thursz 2015) and as unclear in the remaining trials (Helman 1971; Mendenhall 1977; Shumaker 1978; Depew 1980; Theodossi 1982; Mendenhall 1984; Bories 1987; Richardet 1993).
Allocation concealment
Based on the information that we collected from the published reports and information from study authors, we assessed the allocation concealment as low risk of bias in ten trials (Helman 1971; Porter 1971; Campra 1973; Blitzer 1977; Shumaker 1978; Theodossi 1982; Mendenhall 1984; Carithers 1989; Ramond 1992; Thursz 2015) and as unclear in the remaining trials (Mendenhall 1977; Maddrey 1978; Depew 1980; Bories 1987; Richardet 1993; De 2014).
Blinding
Three trials were at high risk of performance bias as they were open‐label trials, without blinding of participants or investigators (Campra 1973; Bories 1987; Theodossi 1982) and placebo was used in the Richardet 1993 trial, but there was no description of it and we judged the risk of bias as unclear. Twelve trials were blinded, using identical placebo (Helman 1971; Porter 1971; Blitzer 1977; Mendenhall 1977; Maddrey 1978; Shumaker 1978; Depew 1980; Mendenhall 1984b: Carithers 1989; Ramond 1992; De 2014; Thursz 2015), and hence, at low risk of bias.
We assessed five trials at low risk of detection bias (Porter 1971; Shumaker 1978; Carithers 1989; De 2014; Thursz 2015), and the remaining eleven trials as unclear risk of detection bias (Helman 1971; Campra 1973; Blitzer 1977; Mendenhall 1977; Maddrey 1978; Depew 1980; Theodossi 1982; Mendenhall 1984; Bories 1987; Ramond 1992; Richardet 1993).
Incomplete outcome data
We classed four trials at high risk of attrition bias because they did not account for participants with missing outcomes (Porter 1971; Blitzer 1977; Theodossi 1982; Thursz 2015). Eleven trials were assessed as having low risk of attrition bias (Helman 1971; Campra 1973; Mendenhall 1977; Maddrey 1978; Shumaker 1978; Depew 1980; Mendenhall 1984; Bories 1987; Carithers 1989; Ramond 1992; De 2014). We judged the risk of bias as unclear in Richardet 1993.
Selective reporting
All trials but Richardet 1993 reported pre‐defined outcomes in our review. We assessed the remaining 15 trials at low risk of reporting bias.
For‐profit bias
Based on the information that we collected from the published reports, we judged two trials to be at low risk of for‐profit bias (Porter 1971; Thursz 2015). We assessed the profit‐bias as unclear in the remaining trials (Helman 1971; Campra 1973; Blitzer 1977; Mendenhall 1977; Maddrey 1978; Shumaker 1978; Depew 1980; Theodossi 1982; Mendenhall 1984; Bories 1987; Carithers 1989; Ramond 1992; Richardet 1993; De 2014).
Other potential sources of bias
We did not identify other biases for any of the included trials.
We judged all trials as high risk‐of‐bias trials. Figure 2 and Figure 3 show our assessment of risk of bias of the published trial reports (Characteristics of included studies).

Risk of bias graph: review authors' judgements about each risk of bias domain presented as percentages across all included studies
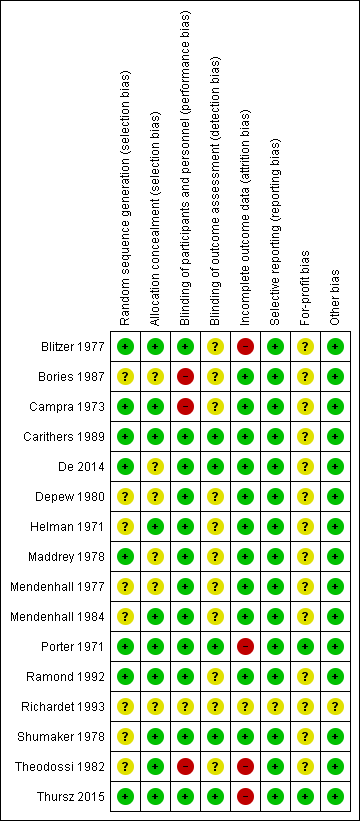
Risk of bias summary: review authors' judgements about each risk of bias domain for each included study
Effects of interventions
See: Summary of findings for the main comparison Glucocorticosteroids for people with alcoholic hepatitis
Primary outcomes
All‐cause mortality
Up to three months following randomisation
In total, 258 of 927 (27.8%) participants in the group treated with glucocorticosteroids died versus 279 of 934 (29.9%) participants in the control group. There was no evidence of effect of glucocorticosteroids on all‐cause mortality (random‐effects RR 0.90, 95% CI 0.70 to 1.15; participants = 1861; trials = 15; I² = 45% (moderate heterogeneity; Analysis 1.1). We observed a similar result with the Trial Sequential Analysis showing that the cumulative Z‐curve did not cross the trial sequential monitoring boundaries for benefit or harm, nor enter the trial sequential monitoring area for futility in order to include an intervention effect of 20% risk ratio reduction (RRR) (Figure 4). The Trial Sequential analysis‐adjusted CI was 0.36 to 2.32. We rated the quality of the evidence as very low (summary of findings Table for the main comparison).
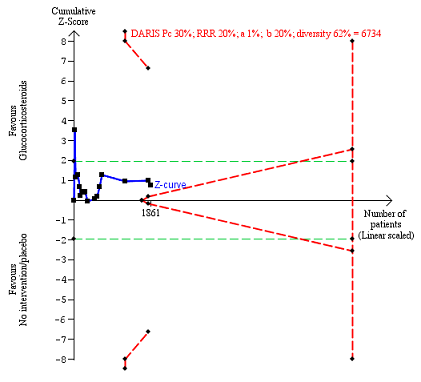
All‐cause mortality up to three months after randomisation. Fifteen trials provided data. The diversity‐adjusted required information size (DARIS) was calculated based on all‐cause mortality of 30% in the control group; risk ratio reduction in the glucocorticosteroid group of 20%; type I error of 1%; and type II error of 20% (80% power). Trial diversity was 62%. The required information size was 6734 participants. The cumulative Z‐curve (blue line) did not cross the trial sequential monitoring boundaries for benefit or harm (red inward sloping lines) and did not enter the trial sequential monitoring area for futility (inner‐wedge with red outward sloping lines). The green dotted lines show the conventional boundaries of the naive alpha of 5% equal to Z‐scores of +1.96 and ‐1.96.
We constructed a funnel plot for publication bias, and using the Harbord 2006 test, we found no evidence of reporting bias (P = 0.31) (Figure 5).
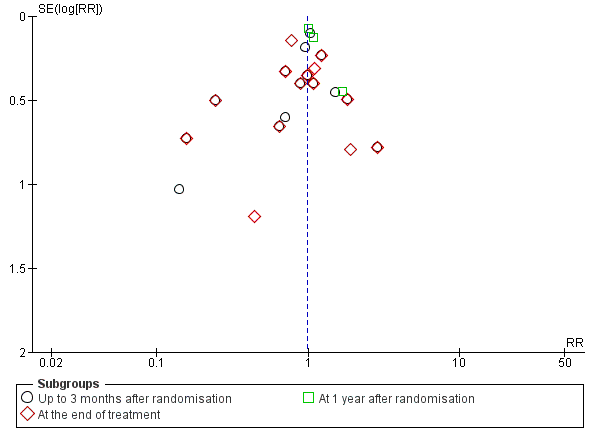
Funnel plot of comparison 1. Glucocorticosteroids versus no intervention/placebo, outcome 1.1 all‐cause mortality
'Best‐worst' case scenario analysis
The 'best‐worst' case scenario analysis on mortality up to three months after randomisation produced two different results. While there was no evidence of effect of glucocorticosteroids with the random‐effects model (RR 0.82, 95% CI 0.64 to 1.05; I² = 47%), there was evidence of beneficial effect with the fixed‐effect model (RR 0.74, 95% CI 0.65 to 0.84; participants = 1861; trials = 15; I² = 47%; Analysis 3.1). The heterogeneity in both analyses was moderate.
'Worst‐best' case scenario analysis
The 'worst‐best' case scenario analysis on mortality up to three months after randomisation produced two different results. While there was no evidence of effect of glucocorticosteroids with the random‐effects model (RR 0.97, 95% CI 0.73 to 1.29; I² = 62%), there was evidence of harmful effect with the fixed‐effect model (RR 1.21, 95% CI 1.06 to 1.37; I² = 62%); Analysis 3.2).
At the end of treatment (post hoc analysis)
The treatment lasted for a median of 28 days (range 3 days to 12 weeks). In total, 162 of 907 (17%) participants in the group treated with glucocorticosteroids died versus 202 of 917 (22%) participants in the control group. There was no evidence of effect of glucocorticosteroids on all‐cause mortality (random‐effects (RR 0.87, 95% CI 0.66 to 1.15; participants = 1824; trials = 14; I² = 42% (moderate heterogeneity); Analysis 1.1.1). We observed a similar result with the Trial Sequential Analysis showing that the cumulative Z‐curve did not cross the trial sequential monitoring boundaries for benefit or harm, and did not enter the trial sequential monitoring area for futility in order to exclude an intervention effect of 20% RRR (Figure 6). The Trial Sequential Analysis‐adjusted CI was CI 0.29 to 2.68. We rated the quality of the evidence as very low (summary of findings Table for the main comparison).

All‐cause mortality at the end of treatment (median 28 days (range 3 days to 12 weeks) (post hoc analysis). Fourteen trials provided data. The diversity‐adjusted required information size (DARIS) was calculated based on all‐cause mortality of 22% in the control group; risk ratio reduction in the glucocorticosteroid group of 20%; type I error of 1%; and type II error of 20% (80% power). Trial diversity was 59%. The required information size was 9242 participants. The cumulative Z‐curve (blue line) did not cross the trial sequential monitoring boundaries for benefit or harm (red inward sloping lines) and did not enter the trial sequential monitoring area for futility (inner‐wedge with red outward sloping lines). The green dotted lines show the conventional boundaries of the naive alpha of 5% equal to Z‐scores of +1.96 and ‐1.96.
We constructed a funnel plot for publication bias, and using the Harbord 2006 test, we found no evidence of reporting bias (P = 0.84) (Figure 5).
At one year following randomisation (post hoc analysis)
Three of the included trials provided data on all‐cause mortality one year following randomisation (Mendenhall 1984; De 2014; Thursz 2015). In total, 274 of 668 (41%) participants in the group treated with glucocorticosteroids died versus 265 of 664 (40%) participants in the control group. There was no evidence of effect of glucocorticosteroids on all‐cause mortality (random‐effects RR 1.03, 95% CI 0.91 to 1.17; participants = 1343; trials = 3; I² = 0% (no heterogeneity among the trials); Analysis 1.1.3). We observed a similar result with the Trial Sequential Analysis showing that the cumulative Z‐curve entered the area of futility, which excludes an intervention effect of 20% RRR (Figure 7). The Trial Sequential analysis‐adjusted CI was CI 0.85 to 1.25. We rated the quality of the evidence as moderate (summary of findings Table for the main comparison).
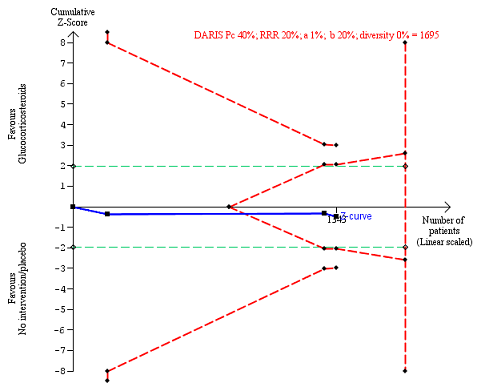
All‐cause mortality up to 1 year (post hoc analysis). Three trials provided data. The diversity‐adjusted required information size (DARIS) was calculated based on mortality in the control group of 40%; risk ratio reduction of 20% in the glucocorticosteroid group; type I error of 1%; and type II error of 20% (80% power). Trial diversity was 0%. The required information size was 1695 participants. The cumulative Z‐curve (blue line) did not cross the trial sequential monitoring boundaries for benefit or harm (red inward sloping lines). The cumulative Z‐curve crossed the inner‐wedge futility line (red outward sloping lines). The green dotted lines show the conventional boundaries of the naive alpha of 5% equal to Z‐scores of +1.96 and ‐1.96.
Subgroup analysis and investigation of heterogeneity: all‐cause mortality up to three months after randomisation
Trials at low risk of bias compared to trials at high risk of bias
As all the trials were at high risk of bias, we could not perform subgroup analysis on risk of bias.
Trials with people with mild alcoholic hepatitis compared to trials with severe alcoholic hepatitis, following Maddrey's score lower than or equal to or higher than 32, or presence of hepatic encephalopathy; or as provided by the trialists
There was no significant difference (P = 0.75) between the subgroups (mild alcoholic hepatitis RR 1.02, 95% CI 0.58 to 1.80; participants = 182; trials = 4; I² = 0%; Analysis 2.1.1) and severe alcoholic hepatitis (RR 0.92, 95% CI 0.73 to 1.16; participants = 1679; trials = 14; I² = 37%; Analysis 2.1.2).
Trials with glucocorticosteroid dose equal to or less than 40 mg compared to trials with glucocorticosteroid dose more than 40 mg
There was no significant difference (P = 0.22) between the subgroups of the trials with glucocorticosteroid dose less than or equal to 40 mg (RR 0.75, 95% CI 0.50 to 1.14; participants = 1547; trials = 10; I² = 58%; Analysis 2.2.1) and trials with glucocorticosteroid dose more than 40 mg (RR 1.02, 95% CI 0.79 to 1.30; participants = 314; trials = 5; I² = 0%; Analysis 2.2.2).
Trials with people with severe alcoholic hepatitis without cirrhosis compared to trials with people with severe alcoholic hepatitis with cirrhosis
There was no significant difference (P = 0.83) between the subgroups of the trials with severe alcoholic hepatitis without cirrhosis (RR 0.79, 95% CI 0.18 to 3.48; participants = 123; trials = 3; I² = 77%; Analysis 2.3.1) and trials with people with severe alcoholic hepatitis with cirrhosis (RR 0.92, 95% CI 0.74 to 1.16; participants = 1738; studies = 12; I2 = 35%; ; Analysis 2.3.2).
As only two trials classified cirrhosis by Child‐Pugh score (Bories 1987; De 2014) and we did not know what classification system the remaining trials had used, we could not perform a subgroup analysis in order to adjust for the clinical spectrum of the disease.
Trials with people with severe alcoholic hepatitis without hepatorenal syndrome compared to trials with people with severe alcoholic hepatitis with hepatorenal syndrome
There was no significant difference (P = 0.64) between the subgroups of the trials with people with severe alcoholic hepatitis without hepatorenal syndrome (RR 1.00, 95% CI 0.85 to 1.17; participants = 1382; studies = 8; I2 = 0%; Analysis 2.4.1) compared to trials with people with severe alcoholic hepatitis with hepatorenal syndrome (RR 0.56, 95% CI 0.05 to 6.49; participants = 129; studies = 2; I2 = 88%; Analysis 2.4.2). The presence of hepatorenal syndrome was not clearly described in five trials (Blitzer 1977; Bories 1987; Mendenhall 1977; Mendenhall 1984; Ramond 1992).
Trials with people with severe alcoholic hepatitis without ascites compared to trials with people with severe alcoholic hepatitis with ascites
As we did not have data on trials with participants not having ascites, we could analyse only the subgroup of trials including participants with ascites (RR 0.82, 95% CI 0.60 to 1.12; participants = 729; trials = 13; I² = 48%) (Analysis 2.5.1). In addition, the presence of ascites was not clearly described in two trials (Mendenhall 1977; Thursz 2015).
Health‐related quality of life
Up to three months
Only one trial reported on quality of life at follow‐up period of up to three months, using responses to the European Quality of Life ‐ 5 Dimensions‐3 Levels (EQ‐5D‐3L) (Thursz 2015). We applied the Student's t‐test for the glucocorticosteroids versus the placebo group. We observed no difference between the two groups (MD ‐0.04 points; 95% CI ‐0.11 to 0.03; Analysis 1.2). We rated the quality of the evidence as low (summary of findings Table for the main comparison). We did not perform Trial Sequential Analysis.
Up to one year
Only one trial reported on quality of life at follow‐up period of up to one year, using responses to the European Quality of Life ‐ 5 Dimensions‐3 Levels (EQ‐5D‐3L) (Thursz 2015). We applied the Student's t‐test for the glucocorticosteroids versus the placebo group. We observed no difference between the two groups (MD 0.00 points; 95% CI ‐0.11 to 0.10; Analysis 1.2). We rated the quality of the evidence as very low (summary of findings Table for the main comparison). We did not perform Trial Sequential Analysis.
Serious adverse events during treatment
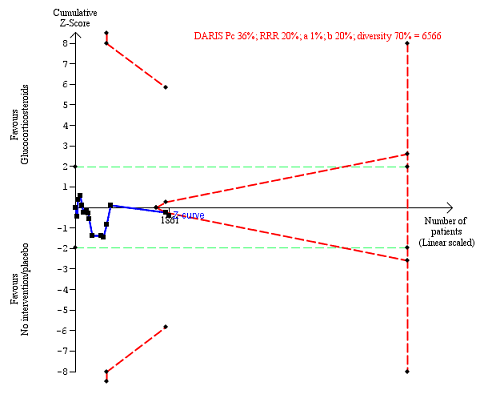
Fifteen trials reported number of participants with serious adverse events during treatment. In total, 361 of 927 (38%) participants in the group treated with glucocorticosteroids had serious adverse events during treatment versus 338 of 934 (36%) participants in the control group. There was no evidence of effect of glucocorticosteroids on the occurrence of serious adverse events (random‐effects RR 1.05, 95% CI 0.85 to 1.29; participants = 1861; trials = 15; I² = 36% (moderate heterogeneity); Analysis 1.3). We observed a similar result with the Trial Sequential Analysis showing that the cumulative Z‐curve entered the area of futility which excludes an intervention effect of 20% RRR (Figure 8). The Trial Sequential analysis‐adjusted CI was 0.60 to 1.82. We rated the quality of the evidence as low (summary of findings Table for the main comparison).

Serious adverse events during treatment. There are 15 trials providing data. The diversity‐adjusted required information size (DARIS) was calculated based on an incidence rate of serious adverse events in the control group of 36%; risk ratio reduction of 20% in the glucocorticosteroid group; type I error of 1%; and type II error of 20% (80% power). Trial diversity was 70%. The required information size was 6566 participants. The cumulative Z‐curve (blue line) did not cross the trial sequential monitoring boundaries for benefit or harm (red inward sloping lines), but it entered the trial sequential monitoring area for futility (inner‐wedge futility line red outward sloping lines) indicating that sufficient information was provided. The green dotted lines show the conventional boundaries of the naive alpha of 5% equal to Z‐scores of +1.96 and ‐1.96.
Table 1 shows the number of participants with the most often occurring serious adverse events in 14 included trials; mortality is not included. Table 2 presents the most often occurring serious adverse events in Thursz 2015 because this trial did not specify the individual number of participants with a serious adverse event.
| Trial | Gastrointestinal haemorrhage | Hepatorenal syndrome (with or without hepatic failure) | Septicaemia | Hepatocellular carcinoma | ||||
| Prednisolone | Placebo | Prednisolone | Placebo | Prednisolone | Placebo | Prednisolone | Placebo | |
| 3 | ||||||||
| 4 | 2 | |||||||
| 3 | 5 | 4 | ||||||
| 3 | 2 | 2 | 2 fungal | 1 | ||||
| Not reported | ||||||||
| 1 | 1 | 3 | 6 | |||||
| 3 | 3 | 2 | ||||||
| 2 | 1 | 2 | 1 | |||||
| 11 | 6 | 7 | 6 | |||||
| 3 | 3 | 2 | ||||||
| 2 | 4 | 1 | ||||||
| 2 | ||||||||
| 1 | 2 | 1 | 1 | |||||
| 2 | 3 | 3 | 3 | 1 | ||||
| Type of adverse event | Prednisolone group | Placebo group |
| Gastrointestinal haemorrhage plus variceal bleeding | 40 | 28 |
| Infections | 74 | 43 |
| ‐ lung | 38 | 17 |
| ‐ sepsis | 14 | 14 |
We constructed a funnel plot for publication bias, and using the Harbord 2006 test, we found no evidence of reporting bias (P = 0.63).
'Best‐worst' case scenario analysis
There was no evidence of effect of glucocorticosteroids on serious adverse events during treatment, with neither of the models (random‐effects model (RR 1.00, 95% CI 0.83 to 1.21; participants = 1861; studies = 15; I2 = 28%) (not important heterogeneity) and fixed‐effect model RR 0.99, 95% CI 0.89 to 1.11; participants = 1861; I² = 28% (not important heterogeneity); Analysis 4.1).
'Worst‐best' case scenario analysis
While there was evidence of harmful effect of glucocorticosteroids with the fixed‐effect model (RR 1.18, 95% CI 1.05 to 1.31; participants = 1861; I² = 38%), there was no evidence of effect of glucocorticosteroids with the random‐effects model (RR 1.11, 95% CI 0.91 to 1.36; I² = 38%; Analysis 4.2).
Secondary outcomes
Liver‐related mortality up to three months following randomisation
In total, 257 of 927 (27.7%) participants in the group treated with glucocorticosteroids died versus 279 of 934 (29.9%) participants in the control group.
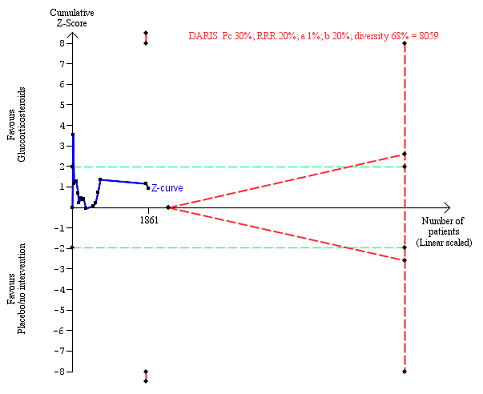
There was no evidence of effect of glucocorticosteroids on liver‐related mortality (random‐effects RR 0.89, 95% CI 0.69 to 1.14; participants = 1861; trials = 15; I² = 46% (moderate heterogeneity); Analysis 1.4). The heterogeneity among the trials was moderate. We observed a similar result with the Trial Sequential Analysis showing that the cumulative Z‐curve did not cross the trial sequential monitoring boundaries for benefit or harm, nor enter the trial sequential monitoring area for futility in order to include an intervention effect of 20% RRR (Figure 9). The Trial Sequential analysis‐adjusted CI was 0.32 to 2.45. We rated the quality of the evidence as low (summary of findings Table for the main comparison).

Liver‐related mortality up to three months after randomisation. Fifteen trials provided data. The diversity‐adjusted required information size (DARIS) was calculated based on liver‐ related mortality of 30% in the control group; risk ratio reduction in the glucocorticosteroid group of 20%; type I error of 1%; and type II error of 20% (80% power). Trial diversity was 68%. The required information size was 8059 participants. The cumulative Z‐curve (blue line) did not cross the trial sequential monitoring boundaries for benefit or harm (red inward sloping lines) and did not enter the trial sequential monitoring area for futility (inner‐wedge with red outward sloping lines). The green dotted lines show the conventional boundaries of the naive alpha of 5% equal to Z‐scores of +1.96 and ‐1.96.
Number of participants with any complication up to three months' follow‐up after randomisation
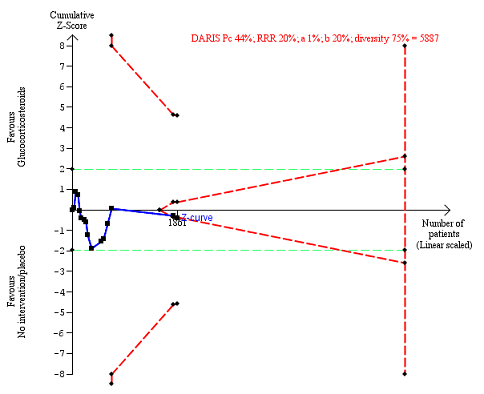
In total, 440 of 927 (47%) participants in the group treated with glucocorticosteroids had one or more complications versus 414 of 934 (44%) participants in the control group. There was no evidence of effect of glucocorticosteroids on frequency of any complications (random‐effects RR 1.04, 95% CI 0.86 to 1.27; participants = 1861; I² = 42% (moderate heterogeneity); Analysis 1.5). We observed a similar result with the Trial Sequential Analysis showing that the cumulative Z‐curve did not cross the trial sequential monitoring boundaries for benefit or harm, nor enter the trial sequential monitoring area for futility in order to include an intervention effect of 20% RRR (Figure 10). The Trial Sequential analysis‐adjusted CI was 0.67 to 1.63. We rated the quality of the evidence as very low, mainly due to within‐study bias, inconsistency, and imprecision (summary of findings Table for the main comparison).

Any complications up to three months after randomisation. Fifteen trials provided data. The diversity‐adjusted required information size (DARIS) was calculated based on any complications of 44% in the control group; risk ratio reduction in the glucocorticosteroid group of 20%; type I error of 1%; and type II error of 20% (80% power). Trial diversity was 75%. The required information size was 5887 participants. The cumulative Z‐curve (blue line) did not cross the trial sequential monitoring boundaries for benefit or harm (red inward sloping lines). The cumulative Z‐curve crossed the inner‐wedge futility line (red outward sloping lines). The green dotted lines show the conventional boundaries of the naive alpha of 5% equal to Z‐scores of +1.96 and ‐1.96.
Number of people with non‐serious adverse events up to three months following randomisation
Only four trials reported non‐serious adverse events such as Cushingoid symptoms, vertigo, and fungal lesions. There was no evidence of effect of glucocorticosteroids on frequency of non‐serious adverse events (random‐effects RR 1.99, 95% CI 0.72 to 5.48; participants = 160; trials = 4; I² = 0% (no heterogeneity); Analysis 1.6). We observed a similar result with the Trial Sequential Analysis showing that the cumulative Z‐curve did not cross the trial sequential monitoring boundaries for benefit or harm, nor enter the trial sequential monitoring area for futility in order to include an intervention effect of 50% RRR (Figure 11). The Trial Sequential Analysis‐adjusted CI was 0.01 to 249.60. We rated the quality of the evidence as very low (summary of findings Table for the main comparison).

Non‐serious adverse events up to three months after randomisation. Four trials provided data. The diversity‐adjusted required information size (DARIS) was calculated based on non‐serious adverse events of 5% in the control group; risk ratio reduction in the glucocorticosteroid group of 50%; type I error of 1%; and type II error of 20% (80% power). Trial diversity was 0%. The required information size was 2698 participants. The cumulative Z‐curve (blue line) did not cross the trial sequential monitoring boundaries for benefit or harm (red inward sloping lines) and did not enter the trial sequential monitoring area for futility (inner‐wedge with red outward sloping lines). The green dotted lines show the conventional boundaries of the naive alpha of 5% equal to Z‐scores of +1.96 and ‐1.96.
Exploratory outcomes at the end of treatment
No trial reported on number of participants with change of level of liver enzymes, prothrombin index, or serum albumin at the end of treatment. This is why we could not perform the planned exploratory analyses. Instead, post hoc, we decided to present in a tabular way the extracted information on level of liver enzymes reported in the trials by Campra 1973; Maddrey 1978; Theodossi 1982; and Carithers 1989 (Appendix 2); prothrombin index or international normalised ratio reported in the trials by Campra 1973; Maddrey 1978; Theodossi 1982; Carithers 1989; Ramond 1992 (Appendix 3); and level of serum albumin (and bilirubin ‐ post hoc again) reported in the trials by Campra 1973; Maddrey 1978; Depew 1980; Theodossi 1982; Carithers 1989; and Ramond 1992 ( Appendix 4; Appendix 5).
'Summary of findings' table
We have presented the key results on the outcomes mortality, health‐related quality of life, serious adverse events, liver‐related mortality, all complications, and non‐serious adverse events in summary of findings Table for the main comparison. We assessed the evidence as being very low to low.
Discusión
Resumen de los resultados principales
Se incluyeron 16 ensayos clínicos aleatorios que comparaban los glucocorticosteroides versus placebo o ninguna intervención en pacientes con hepatitis alcohólica. Quince de los ensayos proporcionaron datos para los análisis. Los metanálisis tradicionales no mostraron ningún efecto beneficioso ni perjudicial de los glucocorticosteroides sobre ninguno de los resultados. En general, los eventos adversos graves y no graves así como las complicaciones se informaron de manera deficiente o la información fue poco clara, y en consecuencia, estos análisis pueden estar sujetos a sesgo de informe de resultado (Ioannidis 2009). Los Análisis Secuenciales de Ensayos demostraron resultados similares. Basado en las inquietudes metodológicas, la solidez de la evidencia se clasificó como muy baja a moderada. Debido a que los ensayos estuvieron en alto riesgo de sesgo, es más probable que se sobrestimen los beneficios y se pasen por alto los efectos perjudiciales.
Compleción y aplicabilidad general de las pruebas
Los participantes del ensayo variaron de acuerdo a la gravedad de la hepatitis alcohólica, y los ensayos se publicaron entre 1971 y 2014. Sin embargo, solo se incluyeron 1861 participantes. Durante este período, las intervenciones con glucocorticosteroides variaron con respecto a la dosis y la duración. El número pequeño de ensayos y de participantes en el ensayo, excepto por el ensayo de Thursz 2015; el diseño y el informe deficiente de los ensayos, dan lugar a que los resultados de la revisión sean no concluyentes. El alto riesgo de sesgo de los ensayos afecta la precisión de los resultados de los metanálisis.
No fue posible evaluar si el grupo étnico tuvo una influencia en los resultados, debido a que hubo datos faltantes o insuficientes. Lo mismo aplicó para el estado nutricional de los participantes, debido a que sólo un ensayo informó sobre este tema (Mendenhall 1984). Mathurin y colegas han propuesto que los pacientes con hepatitis alcohólica con una puntuación de Maddrey de al menos 32 probablemente deben beneficiarse con los glucocorticosteroides (Mathurin 2011). Sin embargo, no se encontró un efecto significativo de los glucocorticosteroides en este subgrupo de participantes del ensayo.
Esta revisión es aplicable a los pacientes con hepatitis alcohólica en diferentes estadios de la enfermedad. Los metanálisis y el Análisis Secuencial de Ensayos parecen no aportar evidencia del beneficio de los glucocorticosteroides en la mortalidad por todas las causas al año de seguimiento después de la asignación al azar. También es improbable que los glucocorticosteroides puedan tener un efecto beneficioso sobre la mortalidad al final del tratamiento y tres meses después de la asignación al azar; sin embargo, debido principalmente a la imprecisión (el intervalo de confianza cruzó el umbral de decisión clínica entre recomendar y no recomendar el tratamiento y no logró alcanzarse el número necesario de participantes), no fue posible excluir la posibilidad de un efecto beneficioso o perjudicial a corto plazo. No es posible afirmar si los glucocorticosteroides pueden influir en la infección y la hemorragia gastrointestinal porque no hubo datos para el metanálisis. Sin embargo, el análisis de Thursz 2015 y colegas demuestra un aumento en el número de dichas complicaciones en los participantes tratados.
Calidad de la evidencia
La calidad de la evidencia refleja sólo la calidad de los ensayos incluidos por lo cual no es posible tener seguridad en cuanto a las conclusiones. La calidad general de la evidencia se consideró muy baja a baja para todos los resultados excepto por la mortalidad por todas las causas un año después de la asignación al azar, para la cual la calidad de la evidencia fue moderada. Todos los ensayos estuvieron en riesgo alto de sesgo, principalmente debido a que los procedimientos de asignación al azar se informaron de manera insuficiente. Además de disminuir la calidad de los ensayos debido al riesgo de sesgo en los estudios, también se disminuyó la calidad de los ensayos a causa de la imprecisión de los cálculos del efecto debido al número de participantes incluidos en los ensayos (todos menos uno de los 14 ensayos tuvieron menos de 400 participantes) y debido a la inconsistencia de los resultados (hubo una variación amplia en los cálculos del efecto entre los ensayos; hubo poca superposición de los intervalos de confianza asociados con los cálculos del efecto; y la heterogeneidad de los datos se evaluó como moderada con I² de un 36% a un 46%, que pudo explicarse mediante el sesgo de selección). También se encontró alguna evidencia de sesgo de publicación o de sesgo de estudio pequeño.
A pesar de la calidad de la evidencia que principalmente fue baja a muy baja, existe bastante seguridad en cuanto a las recomendaciones con respecto a las implicaciones para la práctica y para la investigación. Este hecho se deriva de los resultados del análisis y se basa en el conocimiento de que los ensayos en alto riesgo de sesgo sobrestiman los efectos beneficiosos y subestiman los efectos perjudiciales. Por lo tanto, no se encontró evidencia de apoyo sobre el uso de los glucocorticosteroides en la práctica clínica. Definitivamente hay una necesidad de un informe más transparente de los datos de los participantes individuales (NTAWG 2015; Garattini 2016).
Sesgos potenciales en el proceso de revisión
Los puntos fuertes de la revisión son que la misma se ha realizado siguiendo las recomendaciones del Grupo Cochrane Hepatobiliar y del Manual Cochrane para las Revisiones Sistemáticas de Intervenciones (Cochrane Handbook for Systematic Reviews of Interventions) (Higgins 2011; Gluud 2017). Solo se incluyeron ensayos clínicos aleatorios en la revisión. Lo anterior crea un sesgo hacia los beneficios debido a que los ensayos aleatorios a corto plazo a menudo pasan por alto los efectos perjudiciales. Se intentó minimizar los posibles sesgos de selección mediante el uso de una estrategia de búsqueda integral. Se combinaron búsquedas en bases de datos electrónicas con búsquedas manuales exhaustivas. Además, también se buscaron actas de congresos y libros de resúmenes, independientemente del idioma. Se considera poco probable que se hayan omitodo ensayos publicados, pero no se puede excluir la posibilidad de que se hayan omitido ensayos no publicados. En realidad, la inspección visual de los gráficos en embudo indica sesgo de publicación o sesgo de ensayo pequeño en los resultados de la mortalidad al final del tratamiento y luego de tres meses de la asignación al azar (Figura 5). Se escribió a las compañías farmacéuticas así como a las autoridades reguladoras. Se realizaron intentos extensivos para evitar el riesgo de errores sistemáticos y aleatorios. Se evaluó la evidencia con el enfoque GRADE.
Las limitaciones de la revisión fueron el pequeño número de ensayos y el reducido número total de participantes. Teniendo en cuento que la hepatitis C viral se descubrió recién en 1989; puede existir el riesgo de que los ensayos incluidos iniciados antes de 1989 no incluyeran a participantes sólo con hepatitis alcohólica (Houghton 2009). Además, los resultados son perjudicados por la calidad de los ensayos incluidos así como por la imprecisión y la inconsistencia grave. Aunque todos los ensayos proporcionaron datos sobre la mortalidad, los datos sobre otros eventos adversos graves y complicaciones se informaron con poca frecuencia, lo cual pone en duda la confiabilidad de los dos últimos análisis. Además, al incluir principalmente ensayos clínicos aleatorios el interés se centró en los posibles efectos beneficiosos y se pasaron por alto muchos efectos perjudiciales conocidos conectados con la administración de glucocorticosteroides. Nuevamente, estas fallas en la revisión dan lugar a la sospecha de que los beneficios son sobrestimados y los efectos perjudiciales son subestimados.
Cuando se realizaron los Análisis Secuenciales de Ensayos, se utilizaron parámetros verosímiles para calcular los tamaños de información necesarios. Sin embargo, sólo se utilizó un poder estadístico del 80% (beta = 20%). Si se hubiese utilizado un poder estadístico del 90% (beta = 10%) o menor, que es relevante en los metanálisis en los que no se desea descartar una intervención potencialmente relevante, luego se habrían obtenido tamaños necesarios de información más grandes e Intervalos de Confianza más amplios ajustados al Análisis Secuencial de Ensayos (Garattini 2016; Castellini 2017). En consecuencia, la imprecisión puede ser peor que la señalada por los análisis.
Acuerdos y desacuerdos con otros estudios o revisiones
El metanálisis de Christensen 1995 y colegas no encontró ningún efecto de los glucocorticosteroides versus placebo sobre la mortalidad. Esta revisión incluyó datos de 13 ensayos con 659 participantes aleatorios. Rambaldi 2008 y colegas actualizaron el metanálisis de Christensen 1995 y agregaron dos ensayos más con 62 participantes asignados al azar. Por lo tanto, Rambaldi 2008 y colegas concluyeron que según la estimación de la cantidad de información, la revisión carecía de otros 1000 a 2000 participantes asignados al azar a los glucocorticosteroides versus placebo para poder demostrar o rechazar una reducción de la mortalidad del 20% clínicamente relevante.
Se encontraron dos nuevos ensayos para su inclusión en la revisión (De 2014; Thursz 2015). Sin embargo, se excluyeron dos de los ensayos de la revisión de Rambaldi y colegas (Rambaldi 2008) debido a que evaluaban los glucocorticosteroides versus nutrición (Lesesne 1978; Cabré 2000). Además, dos informes de ensayos resultaron ser del mismo ensayo (Shumaker 1978; Galambos 1984), y por lo tanto, se los consideró como un ensayo.
La revisión sistemática de los ensayos clínicos aleatorios de la comparación por pares está de acuerdo con el metanálisis reciente de Buzzetti 2017. En dicho metanálisis en red, los autores no encontraron ningún efecto significativo de los glucocorticosteroides sobre la mortalidad al momento del seguimiento máximo y hasta los 90 días de seguimiento.
Debido a la inclusión de los dos nuevos ensayos, la revisión ahora incluye 1861 participantes. El ensayo Thursz 2015 incluyó a 1103 participantes y encontró "una reducción de la mortalidad a 28 días en el grupo tratado con prednisolona en el análisis del modelo de regresión logística, aunque no hubo evidencia clara de un beneficio, mantenido más allá de este punto". Mathurin 2011 realizó un "análisis de los datos individuales de cinco ensayos clínicos aleatorios que indicó que los corticosteroides mejoraron significativamente la supervivencia a 28 días en los pacientes con hepatitis alcohólica grave". En el presente metanálisis global, no es posible observar un efecto de los glucocorticosteroides en la mortalidad al “final del tratamiento”, el cual está muy cerca de los 28 días.
Las guías clínicas modernas recomiendan la prescripción de glucocorticosteroides: "Los pacientes con enfermedades graves (puntuación de la Maddrey's Discriminant Function [MDF] de 32; con o sin encefalopatía hepática) y que carecen de contraindicaciones al uso de esteroides deben considerarse para un ciclo de cuatro semanas de prednisolona (40 mg/día durante 28 días, habitualmente seguido de la interrupción o una disminución progresiva de 2 semanas) (Clase I, nivel A)" (AASLD 2010); y "El tratamiento de primera línea en los pacientes con hepatitis alcohólica grave incluye corticosteroides o, en caso de septicemia en curso, pentoxifilina (Recomendación B1) (ver publicación original para la Figura 2)" (EASL 2012). En el presente metanálisis global, no es posible encontrar un efecto beneficioso de los glucocorticosteroides en los pacientes con hepatitis alcohólica grave.

Study flow diagram

Risk of bias graph: review authors' judgements about each risk of bias domain presented as percentages across all included studies

Risk of bias summary: review authors' judgements about each risk of bias domain for each included study

All‐cause mortality up to three months after randomisation. Fifteen trials provided data. The diversity‐adjusted required information size (DARIS) was calculated based on all‐cause mortality of 30% in the control group; risk ratio reduction in the glucocorticosteroid group of 20%; type I error of 1%; and type II error of 20% (80% power). Trial diversity was 62%. The required information size was 6734 participants. The cumulative Z‐curve (blue line) did not cross the trial sequential monitoring boundaries for benefit or harm (red inward sloping lines) and did not enter the trial sequential monitoring area for futility (inner‐wedge with red outward sloping lines). The green dotted lines show the conventional boundaries of the naive alpha of 5% equal to Z‐scores of +1.96 and ‐1.96.

Funnel plot of comparison 1. Glucocorticosteroids versus no intervention/placebo, outcome 1.1 all‐cause mortality

All‐cause mortality at the end of treatment (median 28 days (range 3 days to 12 weeks) (post hoc analysis). Fourteen trials provided data. The diversity‐adjusted required information size (DARIS) was calculated based on all‐cause mortality of 22% in the control group; risk ratio reduction in the glucocorticosteroid group of 20%; type I error of 1%; and type II error of 20% (80% power). Trial diversity was 59%. The required information size was 9242 participants. The cumulative Z‐curve (blue line) did not cross the trial sequential monitoring boundaries for benefit or harm (red inward sloping lines) and did not enter the trial sequential monitoring area for futility (inner‐wedge with red outward sloping lines). The green dotted lines show the conventional boundaries of the naive alpha of 5% equal to Z‐scores of +1.96 and ‐1.96.

All‐cause mortality up to 1 year (post hoc analysis). Three trials provided data. The diversity‐adjusted required information size (DARIS) was calculated based on mortality in the control group of 40%; risk ratio reduction of 20% in the glucocorticosteroid group; type I error of 1%; and type II error of 20% (80% power). Trial diversity was 0%. The required information size was 1695 participants. The cumulative Z‐curve (blue line) did not cross the trial sequential monitoring boundaries for benefit or harm (red inward sloping lines). The cumulative Z‐curve crossed the inner‐wedge futility line (red outward sloping lines). The green dotted lines show the conventional boundaries of the naive alpha of 5% equal to Z‐scores of +1.96 and ‐1.96.
Serious adverse events during treatment. There are 15 trials providing data. The diversity‐adjusted required information size (DARIS) was calculated based on an incidence rate of serious adverse events in the control group of 36%; risk ratio reduction of 20% in the glucocorticosteroid group; type I error of 1%; and type II error of 20% (80% power). Trial diversity was 70%. The required information size was 6566 participants. The cumulative Z‐curve (blue line) did not cross the trial sequential monitoring boundaries for benefit or harm (red inward sloping lines), but it entered the trial sequential monitoring area for futility (inner‐wedge futility line red outward sloping lines) indicating that sufficient information was provided. The green dotted lines show the conventional boundaries of the naive alpha of 5% equal to Z‐scores of +1.96 and ‐1.96.
Liver‐related mortality up to three months after randomisation. Fifteen trials provided data. The diversity‐adjusted required information size (DARIS) was calculated based on liver‐ related mortality of 30% in the control group; risk ratio reduction in the glucocorticosteroid group of 20%; type I error of 1%; and type II error of 20% (80% power). Trial diversity was 68%. The required information size was 8059 participants. The cumulative Z‐curve (blue line) did not cross the trial sequential monitoring boundaries for benefit or harm (red inward sloping lines) and did not enter the trial sequential monitoring area for futility (inner‐wedge with red outward sloping lines). The green dotted lines show the conventional boundaries of the naive alpha of 5% equal to Z‐scores of +1.96 and ‐1.96.
Any complications up to three months after randomisation. Fifteen trials provided data. The diversity‐adjusted required information size (DARIS) was calculated based on any complications of 44% in the control group; risk ratio reduction in the glucocorticosteroid group of 20%; type I error of 1%; and type II error of 20% (80% power). Trial diversity was 75%. The required information size was 5887 participants. The cumulative Z‐curve (blue line) did not cross the trial sequential monitoring boundaries for benefit or harm (red inward sloping lines). The cumulative Z‐curve crossed the inner‐wedge futility line (red outward sloping lines). The green dotted lines show the conventional boundaries of the naive alpha of 5% equal to Z‐scores of +1.96 and ‐1.96.
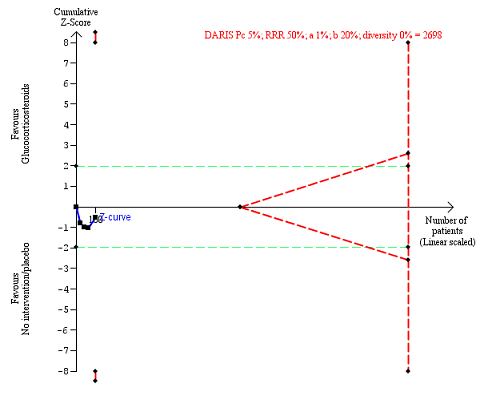
Non‐serious adverse events up to three months after randomisation. Four trials provided data. The diversity‐adjusted required information size (DARIS) was calculated based on non‐serious adverse events of 5% in the control group; risk ratio reduction in the glucocorticosteroid group of 50%; type I error of 1%; and type II error of 20% (80% power). Trial diversity was 0%. The required information size was 2698 participants. The cumulative Z‐curve (blue line) did not cross the trial sequential monitoring boundaries for benefit or harm (red inward sloping lines) and did not enter the trial sequential monitoring area for futility (inner‐wedge with red outward sloping lines). The green dotted lines show the conventional boundaries of the naive alpha of 5% equal to Z‐scores of +1.96 and ‐1.96.

Comparison 1 Glucocorticosteroids versus no intervention/placebo, Outcome 1 All‐cause mortality.

Comparison 1 Glucocorticosteroids versus no intervention/placebo, Outcome 2 Health‐related quality of life.

Comparison 1 Glucocorticosteroids versus no intervention/placebo, Outcome 3 Number of participants with serious adverse events during treatment.

Comparison 1 Glucocorticosteroids versus no intervention/placebo, Outcome 4 Liver‐related mortality.
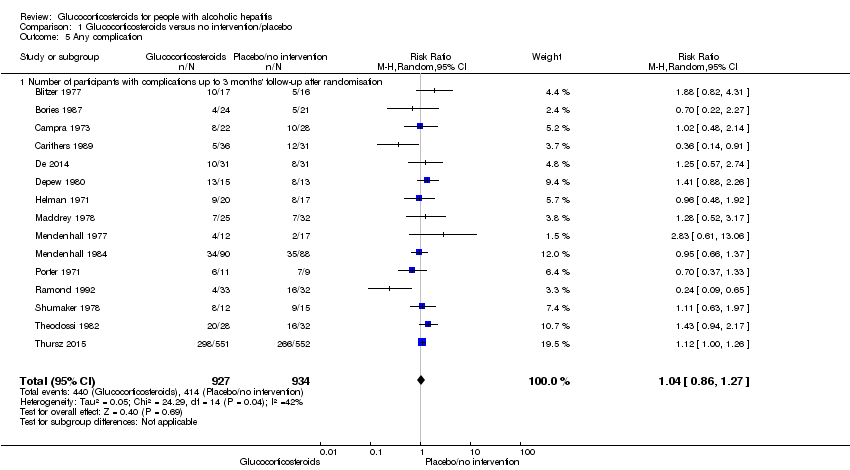
Comparison 1 Glucocorticosteroids versus no intervention/placebo, Outcome 5 Any complication.

Comparison 1 Glucocorticosteroids versus no intervention/placebo, Outcome 6 Number of participants with non‐serious adverse events up to 3 months' follow‐up after randomisation.

Comparison 2 Subgroup analysis: all‐cause mortality up to 3 months after randomisation, Outcome 1 Severity of alcoholic hepatitis.

Comparison 2 Subgroup analysis: all‐cause mortality up to 3 months after randomisation, Outcome 2 Glucocorticosteroid (prednisolone) dose.
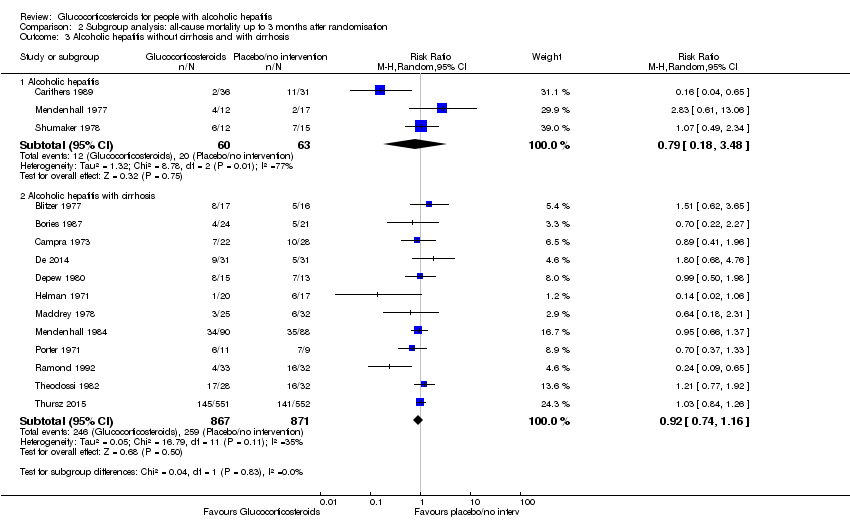
Comparison 2 Subgroup analysis: all‐cause mortality up to 3 months after randomisation, Outcome 3 Alcoholic hepatitis without cirrhosis and with cirrhosis.

Comparison 2 Subgroup analysis: all‐cause mortality up to 3 months after randomisation, Outcome 4 Hepatorenal syndrome.

Comparison 2 Subgroup analysis: all‐cause mortality up to 3 months after randomisation, Outcome 5 Ascites.

Comparison 3 Sensitivity analysis: all‐cause mortality, Outcome 1 Best‐worst scenario all‐cause mortality to 3 months follow‐up.

Comparison 3 Sensitivity analysis: all‐cause mortality, Outcome 2 Worst‐best scenario all‐cause mortality to 3 months follow‐up.

Comparison 4 Sensitivity analysis: serious adverse events, Outcome 1 Best‐worse scenario of serious adverse events during treatment.

Comparison 4 Sensitivity analysis: serious adverse events, Outcome 2 Worst‐best scenario of serious adverse events during treatment.
| Glucocorticosteroids for people with alcoholic hepatitis | ||||||
| Patient or population: participants with alcoholic hepatitis at high risk of mortality and morbidity Settings: hospitals and clinics Intervention: glucocorticosteroids Comparison: placebo or no intervention | ||||||
| Outcomes | Illustrative comparative risks* (95% CI) | Relative effect | No of participants | Quality of the evidence | Comments | |
| Assumed risk | Corresponding risk | |||||
| Placebo or no intervention | Glucocorticosteroids | |||||
| All‐cause mortality: 3 months following randomisation | 298 per 1000 | 278 per 1000 | RR 0.90 (0.70 to 1.15) | 1861 (15 RCTs) | ⊕⊝⊝⊝1 | The Trial Sequential Analysis‐adjusted CI was 0.36 to 2.32 |
| Health‐related quality of life: up to 3 months (measured withEuropean Quality of Life ‐ 5 Dimensions‐3 Levels (EQ‐ 5D‐3L) scale) | The mean value is 0.592 | The mean value is 0.553 | MD ‐0.04; (‐0.11 to 0.03) | 377 (1 RCT) | ⊕⊕⊝⊝2 low | We did not perform Trial Sequential Analysis |
| Serious adverse events during treatment | 361 per 1000 | 389 per 1000 | RR 1.05 (0.85 to 1.29) | 1861 (15 RCTs) | ⊕⊕⊝⊝3 | The Trial Sequential Analysis‐adjusted CI was 0.60 to 1.82 |
| Liver‐related mortality: up to 3 months following randomisation | 298 per 1000 | 277 per 1000 | RR 0.89 (0.69 to 1.14) | 1861 (15 RCTs) | ⊕⊕⊝⊝4 | The Trial Sequential Analysis‐adjusted CI was 0.32 to 2.45 |
| Any complication: up to 3 months following randomisation | 443 per 1000 | 474 per 1000 | RR 1.04 (0.86 to 1.27) | 1861 (15 RCTs) | ⊕⊕⊝⊝5 | The Trial Sequential Analysis‐adjusted CI was 0.67 to 1.63 |
| Number of participants with non‐serious adverse events: up to 3 months' follow‐up after end of treatment | 51 per 1000 | 120 per 1000 | RR 1.99 (0.72 to 5.48) | 160 (4 RCTs) | ⊕⊝⊝⊝6 | The Trial Sequential Analysis‐adjusted CI was 0.01 to 249.60 |
| *The basis for the assumed risk (e.g. the median control group risk across studies) is provided in footnotes. The corresponding risk (and its 95% confidence interval) is based on the assumed risk in the comparison group and the relative effect of the intervention (and its 95% CI). | ||||||
| GRADE Working Group grades of evidence | ||||||
| 1Downgraded 3 levels: 1 level due to within‐study risk of bias (high overall risk of bias in all the trials); 1 level due to inconsistency of the data (there is wide variation in the effect estimates across studies; there is little overlap of confidence intervals associated with the effect estimates; presence of moderate heterogeneity: I² = 45%; heterogeneity could be explained with selection bias); 1 level due to imprecision of effect estimates (the trial sequential analysis showed that additional evidence is needed and that we have not yet reached the required information size). | ||||||
| Trial | Gastrointestinal haemorrhage | Hepatorenal syndrome (with or without hepatic failure) | Septicaemia | Hepatocellular carcinoma | ||||
| Prednisolone | Placebo | Prednisolone | Placebo | Prednisolone | Placebo | Prednisolone | Placebo | |
| 3 | ||||||||
| 4 | 2 | |||||||
| 3 | 5 | 4 | ||||||
| 3 | 2 | 2 | 2 fungal | 1 | ||||
| Not reported | ||||||||
| 1 | 1 | 3 | 6 | |||||
| 3 | 3 | 2 | ||||||
| 2 | 1 | 2 | 1 | |||||
| 11 | 6 | 7 | 6 | |||||
| 3 | 3 | 2 | ||||||
| 2 | 4 | 1 | ||||||
| 2 | ||||||||
| 1 | 2 | 1 | 1 | |||||
| 2 | 3 | 3 | 3 | 1 | ||||
| Type of adverse event | Prednisolone group | Placebo group |
| Gastrointestinal haemorrhage plus variceal bleeding | 40 | 28 |
| Infections | 74 | 43 |
| ‐ lung | 38 | 17 |
| ‐ sepsis | 14 | 14 |
| Outcome or subgroup title | No. of studies | No. of participants | Statistical method | Effect size |
| 1 All‐cause mortality Show forest plot | 15 | Risk Ratio (M‐H, Random, 95% CI) | Subtotals only | |
| 1.1 Up to 3 months after randomisation | 15 | 1861 | Risk Ratio (M‐H, Random, 95% CI) | 0.90 [0.70, 1.15] |
| 1.2 At the end of treatment | 14 | 1824 | Risk Ratio (M‐H, Random, 95% CI) | 0.87 [0.66, 1.15] |
| 1.3 At 1 year after randomisation | 3 | 1343 | Risk Ratio (M‐H, Random, 95% CI) | 1.03 [0.91, 1.17] |
| 2 Health‐related quality of life Show forest plot | 1 | Mean Difference (IV, Random, 95% CI) | Totals not selected | |
| 2.1 Up to three months | 1 | Mean Difference (IV, Random, 95% CI) | 0.0 [0.0, 0.0] | |
| 2.2 Up to one year | 1 | Mean Difference (IV, Random, 95% CI) | 0.0 [0.0, 0.0] | |
| 3 Number of participants with serious adverse events during treatment Show forest plot | 15 | 1861 | Risk Ratio (M‐H, Random, 95% CI) | 1.05 [0.85, 1.29] |
| 4 Liver‐related mortality Show forest plot | 15 | 1861 | Risk Ratio (M‐H, Random, 95% CI) | 0.89 [0.69, 1.14] |
| 4.1 Up to 3 months' follow‐up after randomisation | 15 | 1861 | Risk Ratio (M‐H, Random, 95% CI) | 0.89 [0.69, 1.14] |
| 5 Any complication Show forest plot | 15 | 1861 | Risk Ratio (M‐H, Random, 95% CI) | 1.04 [0.86, 1.27] |
| 5.1 Number of participants with complications up to 3 months' follow‐up after randomisation | 15 | 1861 | Risk Ratio (M‐H, Random, 95% CI) | 1.04 [0.86, 1.27] |
| 6 Number of participants with non‐serious adverse events up to 3 months' follow‐up after randomisation Show forest plot | 4 | 160 | Risk Ratio (M‐H, Fixed, 95% CI) | 1.99 [0.72, 5.48] |
| Outcome or subgroup title | No. of studies | No. of participants | Statistical method | Effect size |
| 1 Severity of alcoholic hepatitis Show forest plot | 15 | Risk Ratio (M‐H, Random, 95% CI) | Subtotals only | |
| 1.1 Mild alcoholic hepatitis | 4 | 182 | Risk Ratio (M‐H, Random, 95% CI) | 1.02 [0.58, 1.80] |
| 1.2 Severe alcoholic hepatitis | 14 | 1679 | Risk Ratio (M‐H, Random, 95% CI) | 0.92 [0.73, 1.16] |
| 2 Glucocorticosteroid (prednisolone) dose Show forest plot | 15 | Risk Ratio (M‐H, Random, 95% CI) | Subtotals only | |
| 2.1 Less than or equal to 40 mg | 10 | 1547 | Risk Ratio (M‐H, Random, 95% CI) | 0.75 [0.50, 1.14] |
| 2.2 More than 40 mg | 5 | 314 | Risk Ratio (M‐H, Random, 95% CI) | 1.02 [0.79, 1.30] |
| 3 Alcoholic hepatitis without cirrhosis and with cirrhosis Show forest plot | 15 | Risk Ratio (M‐H, Random, 95% CI) | Subtotals only | |
| 3.1 Alcoholic hepatitis | 3 | 123 | Risk Ratio (M‐H, Random, 95% CI) | 0.79 [0.18, 3.48] |
| 3.2 Alcoholic hepatitis with cirrhosis | 12 | 1738 | Risk Ratio (M‐H, Random, 95% CI) | 0.92 [0.74, 1.16] |
| 4 Hepatorenal syndrome Show forest plot | 10 | Risk Ratio (M‐H, Random, 95% CI) | Subtotals only | |
| 4.1 With hepatorenal syndrome | 8 | 1382 | Risk Ratio (M‐H, Random, 95% CI) | 1.00 [0.85, 1.17] |
| 4.2 Without hepatorenal syndrome | 2 | 129 | Risk Ratio (M‐H, Random, 95% CI) | 0.56 [0.05, 6.49] |
| 5 Ascites Show forest plot | 13 | Risk Ratio (M‐H, Random, 95% CI) | Subtotals only | |
| 5.1 With ascites | 13 | 729 | Risk Ratio (M‐H, Random, 95% CI) | 0.82 [0.60, 1.12] |
| Outcome or subgroup title | No. of studies | No. of participants | Statistical method | Effect size |
| 1 Best‐worst scenario all‐cause mortality to 3 months follow‐up Show forest plot | 15 | Risk Ratio (M‐H, Random, 95% CI) | Subtotals only | |
| 1.1 Up to 3 months | 15 | 1861 | Risk Ratio (M‐H, Random, 95% CI) | 0.82 [0.64, 1.05] |
| 2 Worst‐best scenario all‐cause mortality to 3 months follow‐up Show forest plot | 15 | Risk Ratio (M‐H, Fixed, 95% CI) | Subtotals only | |
| 2.1 Up to 3 months | 15 | 1861 | Risk Ratio (M‐H, Fixed, 95% CI) | 1.21 [1.06, 1.37] |
| Outcome or subgroup title | No. of studies | No. of participants | Statistical method | Effect size |
| 1 Best‐worse scenario of serious adverse events during treatment Show forest plot | 15 | 1861 | Risk Ratio (M‐H, Random, 95% CI) | 1.00 [0.83, 1.21] |
| 2 Worst‐best scenario of serious adverse events during treatment Show forest plot | 15 | 1861 | Risk Ratio (M‐H, Fixed, 95% CI) | 1.18 [1.05, 1.31] |