Glukokortikosteroid untuk orang dengan hepatitis alkoholik
Abstract
Background
Alcoholic hepatitis is a form of alcoholic liver disease, characterised by steatosis, necroinflammation, fibrosis, and potential complications to the liver disease. Typically, alcoholic hepatitis presents in people between 40 and 50 years of age. Alcoholic hepatitis can be resolved if people abstain from drinking, but the risk of death will depend on the severity of the liver damage and abstinence from alcohol. Glucocorticosteroids are used as anti‐inflammatory drugs for people with alcoholic hepatitis. Glucocorticosteroids have been studied extensively in randomised clinical trials in order to assess their benefits and harms. However, the results have been contradictory.
Objectives
To assess the benefits and harms of glucocorticosteroids in people with alcoholic hepatitis.
Search methods
We identified trials through electronic searches in Cochrane Hepato‐Biliary's (CHB) Controlled Trials Register, CENTRAL, MEDLINE, Embase, LILACS, and Science Citation Index Expanded. We looked for ongoing or unpublished trials in clinical trials registers and pharmaceutical company sources. We also scanned reference lists of the studies retrieved. The last search was 20 October 2016.
Selection criteria
Randomised clinical trials assessing glucocorticosteroids versus placebo or no intervention in people with alcoholic hepatitis, irrespective of year, language of publication, or format. We considered trials with adult participants diagnosed with alcoholic hepatitis, which could have been established through clinical or biochemical diagnostic criteria or both. We defined alcoholic hepatitis as mild (Maddrey's score less than 32) and severe (Maddrey's score 32 or more). We allowed co‐interventions in the trial groups, provided they were similar.
Data collection and analysis
We followed Cochrane and CHB methodology, performing the meta‐analyses using Review Manager 5 and Trial Sequential Analysis. We presented the results of dichotomous outcomes as risk ratios (RR) and those of the continuous outcomes as mean difference (MD). We applied both the fixed‐effect model and the random‐effects model meta‐analyses. Whenever there were significant discrepancies in the results, we reported the more conservative point estimate of the two. We considered a P value of 0.01 or less, two‐tailed, as statistically significant if the required information size was reached due to our three primary outcomes (all‐cause mortality, health‐related quality of life, and serious adverse events during treatment) and our post hoc decision to include analyses of mortality at more time points. We presented heterogeneity using the I² statistic. If trialists used intention‐to‐treat analysis to deal with missing data, we used these data in our primary analysis; otherwise, we used the available data. We assessed the bias risk of the trials using bias risk domains and the quality of the evidence using GRADE.
Main results
Sixteen trials fulfilled the inclusion criteria. All trials were at high risk of bias. Fifteen trials provided data for analysis (927 participants received glucocorticosteroids and 934 participants received placebo or no intervention). The glucocorticosteroids were administered orally or parenterally for a median of 28 days (range 3 days to 12 weeks). The participants were between 25 and 70 years old, had different stages of alcoholic liver disease, and 65% were men. The follow‐up of trial participants, when it was reported, was up to the moment of discharge from the hospital, until they died (a median of 63 days), or for at least a year. There was no evidence of effect of glucocorticosteroids on all‐cause mortality up to three months following randomisation neither with traditional meta‐analysis (random‐effects RR 0.90, 95% CI 0.70 to 1.15; participants = 1861; trials = 15; I² = 45% (moderate heterogeneity) nor with Trial Sequential Analysis. Meta‐analysis showed no evidence of effect on health‐related quality of life up to three months (MD ‐0.04 points; 95% CI ‐0.11 to 0.03; participants = 377; trial = 1; low‐quality evidence), measured with the European Quality of Life ‐ 5 Dimensions‐3 Levels (EQ‐ 5D‐3L) scale. There was no evidence of effect on the occurrence of serious adverse events during treatment, neither with traditional meta‐analysis (random‐effects RR 1.05, 95% CI 0.85 to 1.29; participants = 1861; trials = 15; I² = 36% (moderate heterogeneity), liver‐related mortality up to three months following randomisation (random‐effects RR 0.89, 95% CI 0.69 to 1.14; participants = 1861; trials = 15; I² = 46% (moderate heterogeneity), frequency of any complications up to three months following randomisation (random‐effects RR 1.04, 95% CI 0.86 to 1.27; participants = 1861; I² = 42% (moderate heterogeneity), and frequency of non‐serious adverse events up to three months' follow‐up after end of treatment (random‐effects RR 1.99, 95% CI 0.72 to 5.48; participants = 160; trials = 4; I² = 0% (no heterogeneity) nor with Trial Sequential Analysis. Nine of the trials were industry‐funded.
Authors' conclusions
We found no evidence of a difference between glucocorticosteroids and placebo or no intervention on all‐cause mortality, health‐related quality of life, and serious adverse events during treatment. The risk of bias was high and the quality of evidence was very low or low. Therefore, we are very uncertain about this effect estimate. Due to inadequate reporting, we cannot exclude increases in adverse events. As the confidence intervals were wide, we cannot rule out significant benefits and harms of glucocorticosteroids. Therefore, we need placebo‐controlled, randomised clinical trials, designed according to the SPIRIT guidelines and reported according to the CONSORT guidelines. Future trials ought to report depersonalised individual participant data, so that proper individual participant data meta‐analyses of the effects of glucocorticosteroids in subgroups can be conducted.
PICO
Ringkasan bahasa mudah
Glukokortikosteroid untuk orang dengan hepatitis alkoholik
Soalan Ulasan
Untuk menilai manfaat dan mudarat glukokortikosteroid yang diberi melalui sebarang laluan, dos, dan tempoh berbanding plasebo atau tanpa intervensi dalam kalangan orang dengan hepatitis alkoholik dari segi kematian, kualiti hidup yang berkaitan dengan kesihatan, dan komplikasi.
Latar belakang
Pengambilan alkohol yang berlebihan mungkin merosakkan hati, menyebabkan hepatitis alkoholik. Tahap pertama kerosakan hati dalam hepatitis alkoholik biasanya boleh berbalik jika orang menahan diri dari meminum alkohol, tetapi risiko penyakit itu terus berkembang dan mendapat semakin banyak komplikasi meningkat dengan meminum semula. Peminum tegar adalah orang yang meminum lebih daripada 60 g hingga 80 g (untuk lelaki) atau lebih daripada 20 g (untuk wanita) alkohol setiap hari. Hanya 10 hingga 35 orang daripada 100 peminum tegar dengan lemak berlebihan di hati paling mungkin membentuk hepatitis alkoholik. Lama‐kelamaan, hepatitis alkoholik akan menyebabkan fibrosis hati (parut di hati) atau sirosis hati dengan komplikasi (perdarahan, jangkitan, kanser hati, dll).
Glukokortikosteroid dianggap mempunyai kesan anti‐radang (melegakan sakit, edema, demam). Ia diberi kepada orang dengan hepatitis alkoholik untuk membaiki kecederaan hati mereka. Walau bagaimanapun, manfaat dan mudarat glukokortikosteroid masih belum dikaji dengan meluas dalam kajian rawak klinikal, oleh itu, adalah tidak dapat pasti jika ia patut diguna dalam amalan klinikal untuk orang dengan penyakit hati alkoholik.
Tarikh carian
Tarikh carian terakhir adalah 20 Oktober 2016.
Ciri‐ciri kajian
Enam belas kajian rawak klinikal membandingkan glukokortikosteroid dengan plasebo atau tanpa intervensi dalam kalangan orang dengan hepatitis alkoholik. Lima belas kajian menyediakan data untuk analisis (927 peserta menerima glukokortikosteroid dan 934 peserta menerima plasebo atau tanpa intervensi). Glukokortikosteroid diberi melalui oral atau suntikan untuk median 28 hari (julat dari 3 hari hingga 12 minggu). Peserta kajian berumur di antara 25 dan 70 tahun (lelaki: 65%) dan mempunyai pelbagai tahap penyakit hati alkoholik. Peserta kajian disusuli sehingga masa discaj dari hospital, atau sehingga mereka meninggal dunia (median 63 hari), atau sekurang‐kurangnya setahun. Tidak semua kajian melaporkan susulan peserta. Kajian dilakukan di Perancis, India, UK, dan AS. Dua kajian memberi pentoxifylline kepada kedua‐dua kumpulan glukokortikosteroid dan kumpulan intervensi plasebo.
Pembiayaan
Sembilan kajian dibiaya oleh industri.
Kualiti bukti
Kualiti bukti keseluruhan adalah sangat rendah, rendah, atau sederhana, dan semua kajian adalah berisiko bias tinggi, yang bermaksud terdapat kemungkinan untuk membuat kesimpulan yang salah, membesar‐besarkan manfaat atau menganggar kurang mudarat glukokortikosteroid kerana cara kajian dijalankan dan dianalisis.
Keputusan utama
Glukokortikosteroid tidak memberi manfaat hasil klinikal yang penting kepada orang dengan penyakit hati alkoholik, misalnya kematian, tanpa mengira punca, dan kualiti hidup yang berkaitan dengan kesihatan. Tambahan pula, glukokortikosteroid mungkin meningkatkan bilangan kesan buruk. Kami tidak boleh mengecualikan manfaat dan mudarat glukokortikosteroid tetapi penyelidik perlu mengkaji kesan lanjutan dalam kajian rawak klinikal, kajian terkawal plasebo yang berkualiti tinggi. Kajian sedemikian perlu didaftar sebelum dilancarkan dan melaporkan secara terbuka data peserta individu yang 'depersonalized' supaya meta‐analisis data peserta individu boleh dijalankan.
Authors' conclusions
Summary of findings
| Glucocorticosteroids for people with alcoholic hepatitis | ||||||
| Patient or population: participants with alcoholic hepatitis at high risk of mortality and morbidity Settings: hospitals and clinics Intervention: glucocorticosteroids Comparison: placebo or no intervention | ||||||
| Outcomes | Illustrative comparative risks* (95% CI) | Relative effect | No of participants | Quality of the evidence | Comments | |
| Assumed risk | Corresponding risk | |||||
| Placebo or no intervention | Glucocorticosteroids | |||||
| All‐cause mortality: 3 months following randomisation | 298 per 1000 | 278 per 1000 | RR 0.90 (0.70 to 1.15) | 1861 (15 RCTs) | ⊕⊝⊝⊝1 | The Trial Sequential Analysis‐adjusted CI was 0.36 to 2.32 |
| Health‐related quality of life: up to 3 months (measured withEuropean Quality of Life ‐ 5 Dimensions‐3 Levels (EQ‐ 5D‐3L) scale) | The mean value is 0.592 | The mean value is 0.553 | MD ‐0.04; (‐0.11 to 0.03) | 377 (1 RCT) | ⊕⊕⊝⊝2 low | We did not perform Trial Sequential Analysis |
| Serious adverse events during treatment | 361 per 1000 | 389 per 1000 | RR 1.05 (0.85 to 1.29) | 1861 (15 RCTs) | ⊕⊕⊝⊝3 | The Trial Sequential Analysis‐adjusted CI was 0.60 to 1.82 |
| Liver‐related mortality: up to 3 months following randomisation | 298 per 1000 | 277 per 1000 | RR 0.89 (0.69 to 1.14) | 1861 (15 RCTs) | ⊕⊕⊝⊝4 | The Trial Sequential Analysis‐adjusted CI was 0.32 to 2.45 |
| Any complication: up to 3 months following randomisation | 443 per 1000 | 474 per 1000 | RR 1.04 (0.86 to 1.27) | 1861 (15 RCTs) | ⊕⊕⊝⊝5 | The Trial Sequential Analysis‐adjusted CI was 0.67 to 1.63 |
| Number of participants with non‐serious adverse events: up to 3 months' follow‐up after end of treatment | 51 per 1000 | 120 per 1000 | RR 1.99 (0.72 to 5.48) | 160 (4 RCTs) | ⊕⊝⊝⊝6 | The Trial Sequential Analysis‐adjusted CI was 0.01 to 249.60 |
| *The basis for the assumed risk (e.g. the median control group risk across studies) is provided in footnotes. The corresponding risk (and its 95% confidence interval) is based on the assumed risk in the comparison group and the relative effect of the intervention (and its 95% CI). | ||||||
| GRADE Working Group grades of evidence | ||||||
| 1Downgraded 3 levels: 1 level due to within‐study risk of bias (high overall risk of bias in all the trials); 1 level due to inconsistency of the data (there is wide variation in the effect estimates across studies; there is little overlap of confidence intervals associated with the effect estimates; presence of moderate heterogeneity: I² = 45%; heterogeneity could be explained with selection bias); 1 level due to imprecision of effect estimates (the trial sequential analysis showed that additional evidence is needed and that we have not yet reached the required information size). | ||||||
Background
Description of the condition
The term 'alcoholic hepatitis' was used for the first time in a paper by Beckett and colleagues in 1961 (Beckett 1961), but clinical jaundice after excessive ethanol consumption was reported in the literature long before that (Gerber 1973). Most probably, these reports represented people with alcoholic hepatitis (Mendenhall 1984; Jensen 1994).
Alcoholic hepatitis is a serious form of alcoholic liver disease (injury of the liver due to excessive alcohol consumption) (WHO 2010).
The first stage of liver damage in alcoholic hepatitis is usually reversible if people abstain from drinking, but the risk of progression to fibrosis and cirrhosis increases with resumed drinking (Ellis 2012). The accumulation of fat in the hepatocytes causes disruption of the mitochondrial beta‐oxidation of fatty acids, accumulation of lipotoxic metabolites, and release of reactive oxygen species (Lieber 1999; Wu 1999; Petrasek 2013). Lipotoxic metabolites and reactive oxygen species lead to cell death and liver inflammation (Wu 1999; Petrasek 2013;WHO 2013). Alcoholic hepatitis is a histological form of alcoholic liver disease, characterised by steatosis (the earliest stage of alcoholic liver damage) and necroinflammation (EASL 2012b). Alcoholic hepatitis can be resolved if people abstain from drinking, but the risk of death will depend on the severity of the liver damage and drinking patterns. In 20% to 40% of persistent heavy drinkers (defined as alcohol consumption per day of more than 60 g to 80 g in men and more than 20 g in women), alcoholic hepatitis and other complications may develop (WHO 2013).
Severe alcoholic hepatitis may be characterised by clinically clear signs of jaundice, coagulopathy, liver decompensation with ascites, portal hypertension, variceal bleeding, hepatorenal syndrome, hepatic encephalopathy, systemic inflammatory response syndrome, or sepsis (Becker 1996; EASL 2012b). Typically, alcoholic hepatitis presents in people aged between 40 and 50 years. Among the risk factors of developing severe alcoholic hepatitis are being female, Hispanic ethnicity, various types of alcohol, binge drinking, poor nutrition, obesity, etc (WHO 2010). Several composite prognostic scores exist to distinguish people with poor prognosis from those who can become abstinent, instituting supportive care, until recovery is achieved. Some of these scores, designed to predict mortality, are Maddrey's discriminant function (Maddrey 1978), the model of end‐stage liver disease (MELD) score (Dunn 2005), the Glasgow alcoholic hepatitis score (Forrest 2005), and the age, bilirubin, international normalised ratio, creatinine (ABIC) score (Dominguez 2008).
The Maddrey Discriminant Function is the most often used score in severe alcoholic hepatitis to identify people in potential need of glucocorticosteroids (also known as glucocorticosteroids, corticosteroids, or steroids). The one‐month survival of people with alcoholic hepatitis and with Maddrey's score higher than 32 varied between 50% and 65% (Carithers 1989; Phillips 2006). The Lille Model (www.lillemodel.com) is the only validated model so far to assess glucocorticosteroid response and is highly predictive of death at six months (P value < 0.000001) in people with severe alcoholic hepatitis (Louvet 2007). A Lille Model score greater than 0.45, calculated after seven days of treatment with prednisolone, means failure to respond to treatment and predicts a six‐month mortality of about 75% (Lefkowitch 2005).
Description of the intervention
Glucocorticosteroids are used as anti‐inflammatory drugs. Glucocorticosteroid agents mimic the endogenous‐produced glucocorticoid (cortisol) (Rhen 2005). Glucocorticosteroids, primarily regulated by corticotropin, are considered to have anti‐inflammatory effects as well as metabolic and immunogenic effects in our body (Rhen 2005). It is agreed that the anti‐inflammatory effects of glucocorticosteroids are mediated primarily through repression of gene transcription (Schäcke 2002).
How the intervention might work
Glucocorticosteroids administered to people with alcoholic hepatitis repair the liver injury by decreasing the liver polymorphonuclear neutrophil (PMN) (effector cells) infiltrates and the level of pro‐inflammatory mediators such as tumour necrosis factor‐alpha (TNF‐alpha), intercellular adhesion molecule 1, and interleukin (IL)‐6 and IL‐8 in the liver tissue (Taïeb 2000; Spahr 2001). The benefits of corticosteroids ensue from short‐term vascular changes (Schäcke 2002). However, adverse events have still been poorly reported (Christensen 1995; Rambaldi 2008).
Why it is important to do this review
Over the years, a number of randomised clinical trials have studied the benefits and harms of corticosteroids for people with alcoholic hepatitis, in order to determine the best route of administration, dose, and duration. However, results have been contradictory. Some systematic reviews (Christensen 1995; Rambaldi 2008) and meta‐analyses of randomised clinical trials (Reynolds 1989; Imperiale 1990; Daures 1991; Christensen 1999; Mathurin 2011) have been published. The review authors explained their various conclusions regarding patient‐orientated outcomes as being due to differences in glucocorticosteroid regimens, trial quality, participants' characteristics, and clinical spectrum of the disease. Reynolds 1989 concluded that corticosteroid treatment could help only the most severely ill people with severe alcoholic hepatitis characterised by high levels of serum bilirubin, prolonged prothrombin times, and development of hepatic encephalopathy. Imperiale 1990 concluded that glucocorticosteroids reduced short‐term mortality in people with severe alcoholic hepatitis, provided that they also had hepatic encephalopathy but did not have severe gastrointestinal bleeding. Daures 1991 concluded that further randomised clinical trials were needed to confirm the benefits and harms of glucocorticosteroids, especially in people with severe alcoholic hepatitis. Christensen 1995,Christensen 1999, and Rambaldi 2006 could not find sufficient proof supporting the routine use of glucocorticosteroids in people with alcoholic hepatitis, including those with hepatic encephalopathy. Rambaldi 2008 concluded that glucocorticosteroids did not improve overall survival in people with alcoholic hepatitis. Based on the Trial Sequential Analysis of the subgroup of people with Maddrey's score of at least 32 or spontaneous hepatic encephalopathy, the required information size of 2420 people for the outcome mortality was far from reached, with only 249 participants randomised in the six randomised trials (Rambaldi 2008). Using the Lille model, Mathurin 2011 concluded that glucocorticosteroids significantly improved 28‐day survival in people with severe alcoholic hepatitis. The Mathurin 2011 meta‐analysis was based on individual data from five selected randomised clinical trials and is accordingly at risk of 'cherry picking'. This is why we decided to conduct this Cochrane systematic review in order to assess the efficacy of glucocorticosteroids in people with severe alcoholic hepatitis with or without complications.
Objectives
To assess the benefits and harms of glucocorticosteroids in people with alcoholic hepatitis.
Methods
Criteria for considering studies for this review
Types of studies
We included randomised clinical trials in which glucocorticosteroids were assessed in people with alcoholic hepatitis, irrespective of year or language of publication or format.
We found no reports of quasi‐randomised or observational studies retrieved with our searches for randomised clinical trials, in order to extract data on harm.
Types of participants
We included adult participants with alcoholic hepatitis, diagnosed according to the diagnostic work‐up used in the individual randomised clinical trial. Alcoholic hepatitis could have been established through clinical or biochemical diagnostic criteria or both.
We considered alcoholic hepatitis as mild if a randomised participant had Maddrey's score less than 32 (Maddrey's score = 4.6 x (prothrombin time ‐ control time)(s) + serum bilirubin (mg per dL)) (Maddrey 1978). Usually, people with mild alcoholic hepatitis do not have concomitant gastrointestinal bleeding.
We considered alcoholic hepatitis as severe at any stage of the alcoholic liver disease with the presence of spontaneous hepatic encephalopathy; or Maddrey's score equal to or higher than 32. We also examined whether there was a difference in terms of initiation of treatment with glucocorticosteroids in trials using the Maddrey's score where severe alcoholic hepatitis was defined as equal to or higher than 32.
Included trial participants diagnosed with severe alcoholic hepatitis could also manifest with hepatic encephalopathy, gastro‐intestinal bleeding, cirrhosis (e.g. classified with Child‐Pugh score ‐ Child‐Pugh type C (Pugh 1973)), ascites, hepatorenal syndrome, hyponatraemia, or spontaneous bacterial peritonitis.
For studies not reporting the Maddrey's score, we used the classifications for mild and severe alcoholic hepatitis as provided by the trialists.
Types of interventions
Glucocorticosteroids administered in any route, dose, and duration versus placebo or no intervention.
We allowed co‐interventions in the trial groups, provided they were the same.
Types of outcome measures
Primary outcomes
-
All‐cause mortality: up to three months' follow‐up after randomisation (the primary time point for drawing our main conclusion); at the end of treatment (post hoc analysis); and one year following randomisation (post hoc analysis)
-
Health‐related quality of life as defined by the trial authors
-
Serious adverse events during treatment. We used the International Conference on Harmonisation (ICH) Guidelines for Good Clinical Practice's definition of a serious adverse event (ICH‐GCP 1997), that is, any untoward medical occurrence that results in death, is life threatening, requires hospitalisation or prolongation of existing hospitalisation, results in persistent or significant disability or incapacity, or is a congenital anomaly or birth defect. We considered all other adverse events as non‐serious (see below).
Secondary outcomes
-
Liver‐related mortality up to three months' follow‐up after randomisation
-
Participants with any complication up to three months' follow‐up after randomisation (i.e. ascites, hepatorenal syndrome, spontaneous bacterial peritonitis, gastrointestinal bleeding, hepatic encephalopathy, nonobstructive jaundice, systemic inflammatory response syndrome, sepsis, or hepatocellular carcinoma, or a combination of any of these)
-
Participants with non‐serious adverse events up to three months' follow‐up after randomisation
Exploratory analysis
-
Participants with an increase of liver enzymes as defined by the trialists
-
Participants with a decrease of prothrombin index as defined by the trialists
-
Participants with a decrease of serum albumin as defined by the trialists
Search methods for identification of studies
Electronic searches
We searched Cochrane Hepato‐Biliary's Controlled Trials Register (Gluud 2017; September 2016), Cochrane Central Register of Controlled Trials (CENTRAL; 2016, Issue 8) in the Cochrane Library, MEDLINE Ovid (1946 to September 2016), Embase Ovid (1974 to September 2016), LILACS, and Science Citation Index Expanded (Web of Science; 1900 to September 2016) (Royle 2003). We applied no language or document‐type restrictions. Appendix 1 shows the search strategies with the time spans of the searches.
Searching other resources
We searched online trials registries such as ClinicalTrials.gov (clinicaltrials.gov), European Medicines Agency (EMA; www.ema.europa.eu), WHO International Clinical Trial Registry Platform www.who.int/ictrp), the Food and Drug Administration (FDA; www.fda.gov), and pharmaceutical company sources for ongoing or unpublished trials (last search 20 October 2016).
Data collection and analysis
We followed the available guidelines provided in the Cochrane Handbook for Systematic Reviews of Interventions (Higgins 2011a), and the Cochrane Hepato‐Biliary Module (Gluud 2017). We performed the analyses using Review Manager 5 (RevMan 2014) and Trial Sequential Analysis (Thorlund 2011; TSA 2011; Wetterslev 2017). We assessed the evidence according to Jakobsen and colleagues (Jakobsen 2014).
Selection of studies
We retrieved the publications that we considered as potentially eligible for inclusion, after reading their titles and abstracts. Three review authors (CP, DV, GC) independently reviewed the full‐text publications for eligibility. The review authors assessed each publication to determine if trial participants and the interventions administered met the inclusion criteria. We included abstracts if sufficient data were provided for analysis. We resolved disagreements by discussion or consulting any of the remaining review authors for arbitration.
Data extraction and management
Three review authors (CP, DV, GC) independently completed a data extraction form for all included trials. Authors extracted general information on the trial, such as publication title; place and year of publication; trial design; inclusion and exclusion criteria; preliminary sample size calculation reached or not; number of participants randomised in each trial and following treatment allocation; diagnostic work‐up; age (mean or median); sex or sex ratio; race; co‐infection; type, dose, and route of administration of glucocorticosteroids and their possible link with adverse events; concurrent medications used; length of trial; and length of follow‐up. CP, DV and GC also extracted data on malnutrition whenever it was clearly defined by the trial authors.
The review authors resolved disagreements by discussion or asking the advice of the review arbitrator, CG.
Assessment of risk of bias in included studies
Three review authors (CP, DV, and GC) independently assessed the risk of bias of each included trial according to the recommendations in the Cochrane Handbook for Systematic Reviews of Interventions (Higgins 2011b), the Cochrane Hepato‐Biliary Module (Gluud 2017), and methodological studies (Schulz 1995; Moher 1998; Kjaergard 2001; Wood 2008; Savović 2012a; Savović 2012b; Lundh 2017). We used the following definitions in the assessment of risk of bias.
Allocation sequence generation
-
Low risk of bias: the study performed sequence generation using computer random number generation or a random number table. Drawing lots, tossing a coin, shuffling cards, and throwing dice were adequate if an independent person not otherwise involved in the study performed them.
-
Unclear risk of bias: the study authors did not specify the method of sequence generation.
-
High risk of bias: the sequence generation method was not random. We will only include such studies for assessment of harms.
Allocation concealment
-
Low risk of bias: the participant allocations could not have been foreseen in advance of, or during, enrolment. A central and independent randomisation unit controlled allocation. The investigators were unaware of the allocation sequence (e.g. if the allocation sequence was hidden in sequentially numbered, opaque, and sealed envelopes).
-
Unclear risk of bias: the study authors did not describe the method used to conceal the allocation so the intervention allocations may have been foreseen before, or during, enrolment.
-
High risk of bias: it is likely that the investigators who assigned the participants knew the allocation sequence. We will only include such studies for assessment of harms.
Blinding of participants and personnel
-
Low risk of bias: any of the following: no blinding or incomplete blinding, but the review authors judge that the outcome is not likely to be influenced by lack of blinding; or blinding of participants and key study personnel ensured, and it is unlikely that the blinding could have been broken.
-
Unclear risk of bias: any of the following: insufficient information to permit judgement of ‘low risk’ or ‘high risk’; or the trial did not address this outcome.
-
High risk of bias: any of the following: no blinding or incomplete blinding, and the outcome is likely to be influenced by lack of blinding; or blinding of key study participants and personnel attempted, but likely that the blinding could have been broken, and the outcome is likely to be influenced by lack of blinding.
Blinded outcome assessment
-
Low risk of bias: any of the following: no blinding of outcome assessment, but the review authors judge that the outcome measurement is not likely to be influenced by lack of blinding; or blinding of outcome assessment ensured, and unlikely that the blinding could have been broken.
-
Unclear risk of bias: any of the following: insufficient information to permit judgement of ‘low risk’ or ‘high risk’; or the trial did not address this outcome.
-
High risk of bias: any of the following: no blinding of outcome assessment, and the outcome measurement is likely to be influenced by lack of blinding; or blinding of outcome assessment, but likely that the blinding could have been broken, and the outcome measurement is likely to be influenced by lack of blinding.
Incomplete outcome data
-
Low risk of bias: missing data were unlikely to make treatment effects depart from plausible values. The study used sufficient methods, such as multiple imputation, to handle missing data.
-
Unclear risk of bias: there was insufficient information to assess whether missing data in combination with the method used to handle missing data were likely to induce bias on the results.
-
High risk of bias: the results were likely to be biased due to missing data.
Selective outcome reporting
-
Low risk: the trial reported the following pre‐defined outcomes: all‐cause mortality, serious adverse events, and liver‐related mortality. If the original trial protocol was available, the outcomes should be those called for in that protocol. If the trial protocol was obtained from a trials registry (e.g. www.clinicaltrials.gov), the outcomes sought should have been those enumerated in the original protocol if the trial protocol was registered before or at the time that the trial was begun. If the trial protocol was registered after the trial was begun, those outcomes will not be considered to be reliable.
-
Unclear risk: not all pre‐defined outcomes were reported fully, or it was unclear whether data on these outcomes were recorded or not.
-
High risk: one or more pre‐defined outcomes were not reported.
For‐profit bias
-
Low risk of bias: the trial appeared to be free of industry sponsorship or other type of for‐profit support that may manipulate the trial design, conduct, or analyses of results of the trial.
-
Unclear risk of bias: the trial may or may not be free of for‐profit bias as no information on clinical trial support or sponsorship was provided.
-
High risk of bias: the trial was sponsored by industry or received other type of for‐profit support.
Other bias
-
Low risk of bias: the trial appeared to be free of other factors that could put it at risk of bias.
-
Unclear risk of bias: the trial may or may not have been free of other factors that could put it at risk of bias.
-
High risk of bias: there were other factors in the trial that could put it at risk of bias.
We judged each trial as having a low, uncertain, or high risk of bias based on the definitions described above. We included a bias risk assessment combining all domains and judged the trials to be at low risk of bias if none of the trial domains was assessed as being with high or unclear risk of bias. Moreover, we considered trials with one or more domains with unclear or high risk of bias as trials at high risks of bias.
Measures of treatment effect
Dichotomous outcomes
We used risk ratio (RR) with 95% confidence interval (CI) and Trial Sequential Analysis‐adjusted CI for dichotomous outcomes.
Continuous outcomes
We used mean difference (MD) with 95% CI and Trial Sequential Analysis‐adjusted CI for health‐related quality of life. We planned to use the standardised mean difference (SMD) with 95% CI if trials used different measures for health‐related quality of life.
Unit of analysis issues
Trial participants as randomised per intervention group. In case of multiple treatment groups, we considered only the trial group to which glucocorticosteroids were administered versus the group that received placebo or no intervention. If a trial consisted of more than two groups (either parallel or factorial design), we compared the participants from all the glucocorticosteroid groups versus all participants from the placebo group(s). Had we been able to include a cross‐over trial from which we could extract data for analyses, we would have used the data from the first treatment period of the cross‐over trial.
Dealing with missing data
If dichotomous or continuous data were missing in a published report, we, whenever possible, contacted the original investigators to request the missing data.
If trialists used intention‐to‐treat analysis to deal with missing data, we used these data in our primary analysis. Otherwise, we used the data that were available to us.
Dealing with missing data using sensitivity analysis
As some trials reported only per‐protocol analysis results, we included missing data by considering participants as treatment failures or treatment successes by imputing them according to the following two scenarios:
-
extreme case analysis favouring the experimental intervention ('best‐worse' case scenario): none of the participants who dropped out from the experimental trial group experienced the outcome, but all of the participants who dropped out from the control trial group experienced the outcome; including all randomised participants in the denominator.
-
extreme case analysis favouring the control ('worst‐best' case scenario): all participants who dropped out from the experimental trial group, but none from the control trial group experienced the outcome; including all randomised participants in the denominator.
For continuous outcomes, as in our case health‐related quality of life, we planned to perform a ‘best‐worst’ case scenario analysis assuming that all participants lost to follow‐up in the experimental group had an improved outcome (the group mean plus 1 standard deviation (SD)); and all those with missing outcomes in the control group had a worsened outcome (the group mean minus 1 SD) (Jakobsen 2014). We also planned to perform 'worst‐best' case scenario analysis assuming that all participants lost to follow‐up in the experimental group had a worsened outcome (the group mean minus 1 SD); and all those with missing outcomes in the control group had an improved outcome (the group mean plus 1 SD) (Jakobsen 2014).
We performed the two sensitivity scenario analyses only for our primary outcomes.
Assessment of heterogeneity
We addressed the presence of heterogeneity in both clinical and statistical ways.
To assess heterogeneity between the trials, we specifically examined the degree of heterogeneity observed in the results using the I² statistic (Higgins 2002). As thresholds for the interpretation of the I² statistic could be misleading, we used the following rough guide for interpretation of heterogeneity provided in the Cochrane Handbook for Systematic Reviews of Interventions (Deeks 2011):
-
0% to 40%: might not be important;
-
30% to 60%: may represent moderate heterogeneity*;
-
50% to 90%: may represent substantial heterogeneity*;
-
75% to 100%: considerable heterogeneity*.
*The importance of the observed value of the I² statistic depends on (i) the magnitude and direction of effects and (ii) the strength of evidence for heterogeneity (e.g. P value from the Chi² test, or a CI for I² statistic).
For the heterogeneity adjustment of the required information size in the Trial Sequential Analysis, we used diversity (D²) because the I² statistics used for this purpose underestimates the required information size (Wetterslev 2009).
Depending on the number of eligible trials, we planned to add covariates to a meta‐regression model to adjust for heterogeneity.
Assessment of reporting biases
We drew funnel plots to assess reporting biases from the individual trials by plotting the RR on a logarithmic scale against its standard error (Egger 1997; Sterne 2011).
For dichotomous outcomes, we tested asymmetry using the Harbord test in cases where Tau² was less than 0.1 (Harbord 2006), and we planned to use Rücker 2008 in cases where Tau² was more than 0.1. For continuous outcomes, we planned to use the regression asymmetry test (Egger 1997), and the adjusted rank correlation (Begg 1994).
Data synthesis
Meta‐analysis
We performed the meta‐analyses using Review Manager 5 (RevMan 2014) and according to the recommendations stated in the Cochrane Handbook for Systematic Reviews of Interventions (Deeks 2011).
We presented the results of dichotomous outcomes of individual trials as risk ratios (RR) with 95% CI and the results of the continuous outcomes as mean difference (MD) with 95% CI and Trial Sequential Analysis‐adjusted CI. We applied both the fixed‐effect model (DeMets 1987) and the random‐effects model (DerSimonian 1986) meta‐analyses. If there were statistically significant discrepancies in the results (e.g. one giving a significant intervention effect and the other no significant intervention effect), we reported the more conservative point estimate of the two (Jakobsen 2014). The more conservative point estimate is the estimate closest to zero effect. If the two point estimates were equal, we used the estimate with the widest CI as our main result of the two analyses. We considered a P value of 0.025 or less, two‐tailed, as statistically significant if the required information size was reached due to the three primary outcomes (Jakobsen 2014). Due to us expanding the number of analyses conducted, we post hoc made the alpha level even lower. We used the eight‐step procedure to assess if the thresholds for significance were crossed (Jakobsen 2014). We presented heterogeneity using the I2 statistic (Higgins 2002). We presented the results of the individual trials and meta‐analyses in the form of forest plots.
Where data were only available from one trial (in our case continuous data on health‐related quality of life), we used Student's t‐test (Student 1908). We planned to use Fisher's exact test for dichotomous data in a single trial (Fisher 1922).
Trial Sequential Analysis
We applied Trial Sequential Analysis for both dichotomous and continuous outcomes (Thorlund 2011; TSA 2011; Wetterslev 2017), as cumulative meta‐analyses are at risk of producing random errors due to sparse data and repetitive testing of the accumulating data (Wetterslev 2008; Wetterslev 2017). To control random errors, we calculated the diversity‐adjusted required information size (DARIS) (i.e. the number of participants needed in a meta‐analysis to detect or reject a certain intervention effect) (Brok 2008; Wetterslev 2008; Brok 2009; Thorlund 2009, Wetterslev 2009; Thorlund 2010).
In our meta‐analysis, we based the DARIS for dichotomous outcomes on the event proportion in the control group; assumption of a plausible risk ratio reduction of 20% of the risk observed in the included trials; a risk of type I error of 1% due to more than three outcomes, as we decided to perform post hoc analyses on mortality at end of treatment and at one year following randomisation, a risk of type II error of 20%, and the diversity of the included trials in the meta‐analysis. For health‐related quality of life, we planned to: estimate DARIS using a minimal relevant difference of 10% of the mean response observed in the control group; the standard deviation; alpha of 1% (Jakobsen 2014); beta of 20%; and the diversity as estimated from the trials in the meta‐analysis (Wetterslev 2009). However, we did not conduct Trial Sequential Analysis because only one trial provided data on health‐related quality of life. We also calculated and reported the Trial Sequential Analysis‐adjusted CI (Thorlund 2011).
The underlying assumption of Trial Sequential Analysis is that testing for statistical significance may be performed each time a new trial is added to the meta‐analysis. We added the trials according to the year of publication, and, if more than one trial was published in a year, we added trials alphabetically according to the last name of the first author. On the basis of the DARIS, we constructed the trial sequential monitoring boundaries for benefit, harm, and futility (Wetterslev 2008; Thorlund 2011). These boundaries determine the statistical inference one may draw regarding the cumulative meta‐analysis that has not reached the DARIS; if the trial sequential monitoring boundary for benefit or harm is crossed before the DARIS is reached, firm evidence may be established and further trials may be superfluous. However, if the boundaries are not crossed, it is most probably necessary to continue doing trials in order to detect or reject a certain intervention effect. However, if the cumulative Z‐curve crosses the trial sequential monitoring boundaries for futility, no more trials may be needed.
A more detailed description of Trial Sequential Analysis can be found at www.ctu.dk/tsa/ (Thorlund 2011).
Subgroup analysis and investigation of heterogeneity
Whenever possible, we performed the following subgroup analyses for all‐cause mortality up to three months after randomisation.
-
Trials at low risk of bias compared to trials at high risk of bias.
-
Trials with people with mild alcoholic hepatitis compared to trials with severe alcoholic hepatitis, following Maddrey's score lower than 32 or equal to or higher than 32 or presence of hepatic encephalopathy; or as provided by the trialists.
-
Trials with glucocorticosteroid dose equal to or less than 40 mg compared to trials with glucocorticosteroid dose more than 40 mg.
-
Trials with people with severe alcoholic hepatitis without cirrhosis compared to trials with people with severe alcoholic hepatitis with cirrhosis. If cirrhosis is classified by Child‐Pugh score, then we may be able to perform additional subgroup analyses in order to adjust for the clinical spectrum of the disease.
-
Trials with people with severe alcoholic hepatitis without hepatorenal syndrome compared to trials with people with severe alcoholic hepatitis with hepatorenal syndrome.
-
Trials with people with severe alcoholic hepatitis without ascites compared to trials with people with severe alcoholic hepatitis with ascites.
We did not perform any additional subgroup analyses to those planned in advance.
Sensitivity analysis
We planned to undertake additional sensitivity analyses to those specified under Dealing with missing data should we have considered it necessary (e.g. trials published as full‐paper articles, abstracts, and unpublished trials).
Summary of findings' tables
We created 'Summary of findings' tables on all review outcomes using GRADEpro GDT 2015. The GRADE approach appraises the quality of a body of evidence based on the extent to which one can be confident that an estimate of effect or association reflects the item being assessed. The quality of a body of evidence considers within‐study risk of bias, indirectness of the evidence (population, intervention, control, outcomes), unexplained inconsistency (heterogeneity) of results (including problems with subgroup analyses); imprecision of results (wide CIs as evaluated with our Trial Sequential Analyses) (Jakobsen 2014), and risk of publication bias (Balshem 2011; Guyatt 2011a; Guyatt 2011b; Guyatt 2011c; Guyatt 2011d; Guyatt 2011e; Guyatt 2011f; Guyatt 2011g; Guyatt 2011h; Guyatt 2013a; Guyatt 2013b; Guyatt 2013c; Mustafa 2013; Guyatt 2017).
We defined the levels of evidence as 'high', 'moderate', 'low', or 'very low'. These grades are defined as follows:
-
High quality: this research provides a very good indication of the likely effect; the likelihood that the effect will be substantially different is low.
-
Moderate quality: this research provides a good indication of the likely effect; the likelihood that the effect will be substantially different is moderate.
-
Low quality: this research provides some indication of the likely effect; however, the likelihood that it will be substantially different is high.
-
Very low quality: this research does not provide a reliable indication of the likely effect; the likelihood that the effect will be substantially different is very high.
Results
Description of studies
See: Characteristics of included studies; Characteristics of excluded studies.
Results of the search
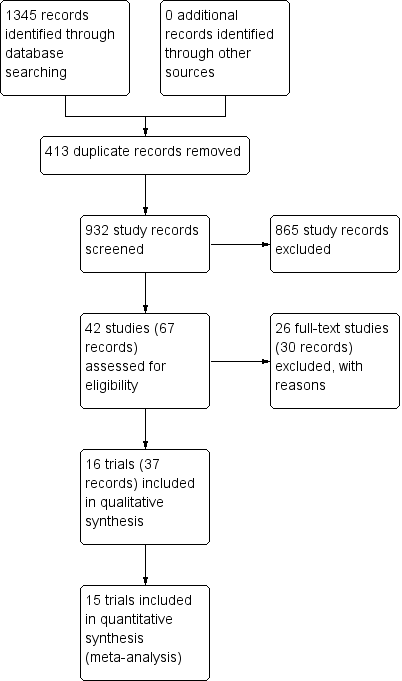
We identified 932 potentially relevant records through the electronic searches (Figure 1). Of these, 37 records that referred to 16 randomised clinical trials fulfilled our inclusion criteria. We found two trials published in abstract form (Mendenhall 1977; Richardet 1993), and fourteen trials described in full paper articles (Helman 1971; Porter 1971; Campra 1973; Blitzer 1977; Maddrey 1978; Shumaker 1978; Depew 1980; Theodossi 1982; Mendenhall 1984; Bories 1987; Carithers 1989; Ramond 1992; De 2014; Thursz 2015). Our searches retrieved no quasi‐randomised trials or observational studies. We identified no additional references by handsearching the reference lists of articles, retrieved through the computerised databases.
Study flow diagram
Included studies
Sixteen randomised clinical trials fulfilled our review protocol inclusion criteria (Helman 1971; Porter 1971; Campra 1973; Blitzer 1977; Mendenhall 1977; Maddrey 1978; Shumaker 1978; Depew 1980; Theodossi 1982; Mendenhall 1984; Bories 1987; Carithers 1989; Ramond 1992; Richardet 1993; De 2014; Thursz 2015). Two were three‐armed trials (Mendenhall 1977; Mendenhall 1984), one trial was a randomised trial with a two‐by‐two factorial design (Thursz 2015), one trial was a cross‐over trial (Richardet 1993), and the remaining were parallel, two‐group design trials. There were 1884 participants randomised in all trials. Some participants from Mendenhall 1977 (pilot trial or feasibility trial) continued participation in Mendenhall 1984. The trials were conducted in France (n = 3), India (n = 1), UK (n = 2), and USA (n = 10) (Characteristics of included studies). All the trials reported the sex (65% of the participants were men) and age of the participants (range 25 years to 70 years). Four trials excluded women (Blitzer 1977; Mendenhall 1977; Mendenhall 1984; De 2014). Eleven trials reported to have included trial participants at different stages of alcoholic liver disease due to hepatitis, fibrosis, or cirrhosis (Helman 1971; Porter 1971; Campra 1973; Blitzer 1977; Maddrey 1978; Depew 1980; Theodossi 1982; Mendenhall 1984Bories 1987; Ramond 1992; Thursz 2015). Most trials established diagnosis primarily through liver biopsy. One trial included only participants with liver cirrhosis in addition to alcoholic hepatitis (De 2014). The remaining trials did not provide information on the stage of disease. All the trials included participants with recent history of alcohol consumption, increase of serum bilirubin, liver enzymes, prolonged prothrombin time, and participants without previous treatment with glucocorticosteroids within the last three months before the start of the trial. Ten trials performed liver biopsy whenever possible (Helman 1971; Porter 1971; Campra 1973; Blitzer 1977; Maddrey 1978; Shumaker 1978; Depew 1980; Bories 1987; Ramond 1992; Thursz 2015); however, it was an inclusion criterion in only one trial, performed at the admission and after treatment (Helman 1971).
Ten trials reported the period of trial enrolment (range of one year to five years, with the median of three years) (Campra 1973; Blitzer 1977; Mendenhall 1977; Maddrey 1978; Depew 1980; Mendenhall 1984; Bories 1987; Carithers 1989; De 2014; Thursz 2015). The earliest trial began participant recruitment in 1966 (Campra 1973), and the most recently published trial began recruitment in 2011 and completed it in 2014 (Thursz 2015).
Three trials followed participants up to one year Mendenhall 1984, De 2014 and Thursz 2015. The remaining trials followed their participants to the moment of discharge from the hospital or until death occurred, with a median duration of follow‐up of 63 days (range 28 to 120).
We could extract data for analysis from all 16 trials but one (Richardet 1993). We contacted Richardet in 2006, but we did not receive a reply. In the remaining 15 trials, 182 participants had mild alcoholic hepatitis and 1679 had severe alcoholic hepatitis. The analyses of the 15 trials accounted for 927 participants randomised to glucocorticosteroids, and 934 participants randomised to placebo or no intervention.
Experimental interventions
Glucocorticosteroids (prednisolone or 6‐methylprednisolone in equivalent dose of prednisolone) were administered orally or parenterally at different dose regimens and different durations. Twelve trials assessed oral glucocorticosteroids at a dose equal to or more than 40 mg prednisolone (Helman 1971; Mendenhall 1977; Maddrey 1978; Shumaker 1978; Depew 1980; Mendenhall 1984; Bories 1987; Carithers 1989; Ramond 1992; Richardet 1993; De 2014; Thursz 2015), but three trials also allowed parenteral administration to participants who were not able to swallow (Shumaker 1978; Carithers 1989; Ramond 1992). Two trials assessed oral glucocorticosteroids at a dose less than 40 mg prednisolone (Campra 1973; Blitzer 1977), and in one trial the initial therapy was parenteral and then it was administered orally (Porter 1971). One trial used only parenteral (intravenous) glucocorticosteroids (Theodossi 1982).
The median duration of glucocorticosteroid administration was 28 days with a range of three days (Theodossi 1982) to 11 weeks (De 2014): one week (Richardet 1993), three weeks (Mendenhall 1977), four weeks (Ramond 1992; Thursz 2015), 26 days (Blitzer 1977), one month (Maddrey 1978; Mendenhall 1984; Bories 1987), five weeks (Shumaker 1978; Carithers 1989), six weeks (Helman 1971;Campra 1973; Depew 1980), 45 days (Porter 1971). The dose of prednisolone was tapered until it was stopped in Helman 1971; Porter 1971; Campra 1973; Blitzer 1977; Mendenhall 1977; Shumaker 1978; Depew 1980; Mendenhall 1984; Carithers 1989; and De 2014.
Control interventions
Twelve trials used identical placebos (Helman 1971; Porter 1971; Blitzer 1977; Mendenhall 1977; Maddrey 1978; Shumaker 1978; Depew 1980; Mendenhall 1984; Carithers 1989; Ramond 1992; De 2014; Thursz 2015) and four trials used no intervention (Campra 1973; Theodossi 1982; Bories 1987; Richardet 1993).
Co‐interventions
Two trials administered pentoxifylline to both glucocorticosteroids and placebo intervention groups (De 2014; Thursz 2015). There seemed to be no interaction between the intervention effects of pentoxifylline and glucocorticosteroids (De 2014; Thursz 2015).
Outcomes
The Characteristics of included studies tables detail the outcomes reported in the individual trials. Five trials reported on outcomes with a follow‐up period up to three months after randomisation (Helman 1971; Mendenhall 1977; Bories 1987; De 2014; Thursz 2015). Twelve trials reported on outcomes at the end of treatment or at the moment of discharge from the hospital (Helman 1971; Porter 1971; Campra 1973; Blitzer 1977; Maddrey 1978; Shumaker 1978; Depew 1980; Theodossi 1982; Bories 1987; Carithers 1989; Ramond 1992; Richardet 1993). Three trials exceeded the 12‐month follow‐up period (Mendenhall 1984; De 2014; Thursz 2015).
Only one trial reported health‐related quality of life, using the European quality of life‐5 dimensions (EQ‐5D) score registered to Eudra CT 2009‐ 013897‐42 and ISRCTN 88782125 and it was reported in all the groups at three months' follow‐up after randomisation, and at one year (Thursz 2015; see Notes in Characteristics of included studies).
None of the trials provided usable data for meta‐analyses of our exploratory outcomes.
For further details on trial characteristics, please see Characteristics of included studies.
Excluded studies
We excluded 26 trials from the final assessment with the reasons for their exclusion provided in Characteristics of excluded studies.
Among the excluded trials are two trials that used a nutritional intervention in the control group (Lesesne 1978; Cabré 2000). Although nutritional intervention as an overall intervention does not seem to influence mortality or serious adverse events (Feinberg 2017), including the Cabré 2000 and Lesesne 1978 trials in our review would not have affected our results noticeably because these trials were small and had very few events.
Risk of bias in included studies
Allocation
Allocation sequence generation
Based on the information that we collected from the published reports and information from study authors, we assessed the allocation sequence generation as low risk of bias in eight trials (Porter 1971; Campra 1973; Blitzer 1977; Maddrey 1978; Carithers 1989; Ramond 1992; De 2014; Thursz 2015) and as unclear in the remaining trials (Helman 1971; Mendenhall 1977; Shumaker 1978; Depew 1980; Theodossi 1982; Mendenhall 1984; Bories 1987; Richardet 1993).
Allocation concealment
Based on the information that we collected from the published reports and information from study authors, we assessed the allocation concealment as low risk of bias in ten trials (Helman 1971; Porter 1971; Campra 1973; Blitzer 1977; Shumaker 1978; Theodossi 1982; Mendenhall 1984; Carithers 1989; Ramond 1992; Thursz 2015) and as unclear in the remaining trials (Mendenhall 1977; Maddrey 1978; Depew 1980; Bories 1987; Richardet 1993; De 2014).
Blinding
Three trials were at high risk of performance bias as they were open‐label trials, without blinding of participants or investigators (Campra 1973; Bories 1987; Theodossi 1982) and placebo was used in the Richardet 1993 trial, but there was no description of it and we judged the risk of bias as unclear. Twelve trials were blinded, using identical placebo (Helman 1971; Porter 1971; Blitzer 1977; Mendenhall 1977; Maddrey 1978; Shumaker 1978; Depew 1980; Mendenhall 1984b: Carithers 1989; Ramond 1992; De 2014; Thursz 2015), and hence, at low risk of bias.
We assessed five trials at low risk of detection bias (Porter 1971; Shumaker 1978; Carithers 1989; De 2014; Thursz 2015), and the remaining eleven trials as unclear risk of detection bias (Helman 1971; Campra 1973; Blitzer 1977; Mendenhall 1977; Maddrey 1978; Depew 1980; Theodossi 1982; Mendenhall 1984; Bories 1987; Ramond 1992; Richardet 1993).
Incomplete outcome data
We classed four trials at high risk of attrition bias because they did not account for participants with missing outcomes (Porter 1971; Blitzer 1977; Theodossi 1982; Thursz 2015). Eleven trials were assessed as having low risk of attrition bias (Helman 1971; Campra 1973; Mendenhall 1977; Maddrey 1978; Shumaker 1978; Depew 1980; Mendenhall 1984; Bories 1987; Carithers 1989; Ramond 1992; De 2014). We judged the risk of bias as unclear in Richardet 1993.
Selective reporting
All trials but Richardet 1993 reported pre‐defined outcomes in our review. We assessed the remaining 15 trials at low risk of reporting bias.
For‐profit bias
Based on the information that we collected from the published reports, we judged two trials to be at low risk of for‐profit bias (Porter 1971; Thursz 2015). We assessed the profit‐bias as unclear in the remaining trials (Helman 1971; Campra 1973; Blitzer 1977; Mendenhall 1977; Maddrey 1978; Shumaker 1978; Depew 1980; Theodossi 1982; Mendenhall 1984; Bories 1987; Carithers 1989; Ramond 1992; Richardet 1993; De 2014).
Other potential sources of bias
We did not identify other biases for any of the included trials.
We judged all trials as high risk‐of‐bias trials. Figure 2 and Figure 3 show our assessment of risk of bias of the published trial reports (Characteristics of included studies).

Risk of bias graph: review authors' judgements about each risk of bias domain presented as percentages across all included studies
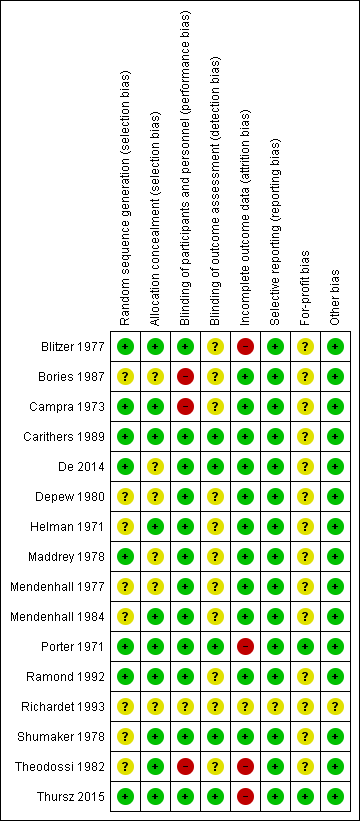
Risk of bias summary: review authors' judgements about each risk of bias domain for each included study
Effects of interventions
See: Summary of findings for the main comparison Glucocorticosteroids for people with alcoholic hepatitis
Primary outcomes
All‐cause mortality
Up to three months following randomisation
In total, 258 of 927 (27.8%) participants in the group treated with glucocorticosteroids died versus 279 of 934 (29.9%) participants in the control group. There was no evidence of effect of glucocorticosteroids on all‐cause mortality (random‐effects RR 0.90, 95% CI 0.70 to 1.15; participants = 1861; trials = 15; I² = 45% (moderate heterogeneity; Analysis 1.1). We observed a similar result with the Trial Sequential Analysis showing that the cumulative Z‐curve did not cross the trial sequential monitoring boundaries for benefit or harm, nor enter the trial sequential monitoring area for futility in order to include an intervention effect of 20% risk ratio reduction (RRR) (Figure 4). The Trial Sequential analysis‐adjusted CI was 0.36 to 2.32. We rated the quality of the evidence as very low (summary of findings Table for the main comparison).
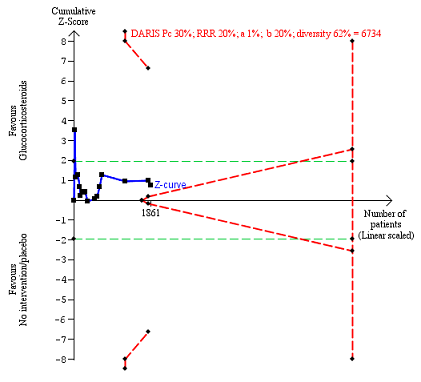
All‐cause mortality up to three months after randomisation. Fifteen trials provided data. The diversity‐adjusted required information size (DARIS) was calculated based on all‐cause mortality of 30% in the control group; risk ratio reduction in the glucocorticosteroid group of 20%; type I error of 1%; and type II error of 20% (80% power). Trial diversity was 62%. The required information size was 6734 participants. The cumulative Z‐curve (blue line) did not cross the trial sequential monitoring boundaries for benefit or harm (red inward sloping lines) and did not enter the trial sequential monitoring area for futility (inner‐wedge with red outward sloping lines). The green dotted lines show the conventional boundaries of the naive alpha of 5% equal to Z‐scores of +1.96 and ‐1.96.
We constructed a funnel plot for publication bias, and using the Harbord 2006 test, we found no evidence of reporting bias (P = 0.31) (Figure 5).
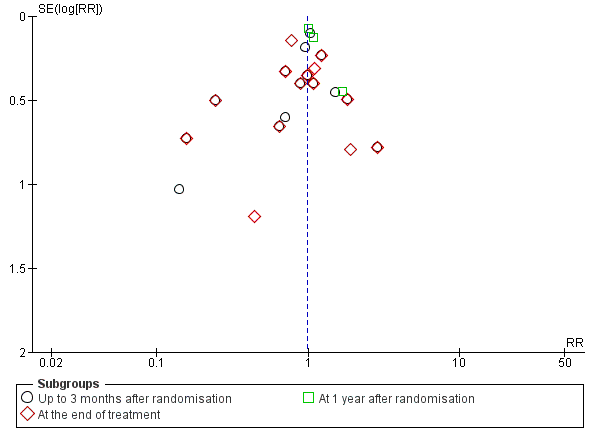
Funnel plot of comparison 1. Glucocorticosteroids versus no intervention/placebo, outcome 1.1 all‐cause mortality
'Best‐worst' case scenario analysis
The 'best‐worst' case scenario analysis on mortality up to three months after randomisation produced two different results. While there was no evidence of effect of glucocorticosteroids with the random‐effects model (RR 0.82, 95% CI 0.64 to 1.05; I² = 47%), there was evidence of beneficial effect with the fixed‐effect model (RR 0.74, 95% CI 0.65 to 0.84; participants = 1861; trials = 15; I² = 47%; Analysis 3.1). The heterogeneity in both analyses was moderate.
'Worst‐best' case scenario analysis
The 'worst‐best' case scenario analysis on mortality up to three months after randomisation produced two different results. While there was no evidence of effect of glucocorticosteroids with the random‐effects model (RR 0.97, 95% CI 0.73 to 1.29; I² = 62%), there was evidence of harmful effect with the fixed‐effect model (RR 1.21, 95% CI 1.06 to 1.37; I² = 62%); Analysis 3.2).
At the end of treatment (post hoc analysis)
The treatment lasted for a median of 28 days (range 3 days to 12 weeks). In total, 162 of 907 (17%) participants in the group treated with glucocorticosteroids died versus 202 of 917 (22%) participants in the control group. There was no evidence of effect of glucocorticosteroids on all‐cause mortality (random‐effects (RR 0.87, 95% CI 0.66 to 1.15; participants = 1824; trials = 14; I² = 42% (moderate heterogeneity); Analysis 1.1.1). We observed a similar result with the Trial Sequential Analysis showing that the cumulative Z‐curve did not cross the trial sequential monitoring boundaries for benefit or harm, and did not enter the trial sequential monitoring area for futility in order to exclude an intervention effect of 20% RRR (Figure 6). The Trial Sequential Analysis‐adjusted CI was CI 0.29 to 2.68. We rated the quality of the evidence as very low (summary of findings Table for the main comparison).

All‐cause mortality at the end of treatment (median 28 days (range 3 days to 12 weeks) (post hoc analysis). Fourteen trials provided data. The diversity‐adjusted required information size (DARIS) was calculated based on all‐cause mortality of 22% in the control group; risk ratio reduction in the glucocorticosteroid group of 20%; type I error of 1%; and type II error of 20% (80% power). Trial diversity was 59%. The required information size was 9242 participants. The cumulative Z‐curve (blue line) did not cross the trial sequential monitoring boundaries for benefit or harm (red inward sloping lines) and did not enter the trial sequential monitoring area for futility (inner‐wedge with red outward sloping lines). The green dotted lines show the conventional boundaries of the naive alpha of 5% equal to Z‐scores of +1.96 and ‐1.96.
We constructed a funnel plot for publication bias, and using the Harbord 2006 test, we found no evidence of reporting bias (P = 0.84) (Figure 5).
At one year following randomisation (post hoc analysis)
Three of the included trials provided data on all‐cause mortality one year following randomisation (Mendenhall 1984; De 2014; Thursz 2015). In total, 274 of 668 (41%) participants in the group treated with glucocorticosteroids died versus 265 of 664 (40%) participants in the control group. There was no evidence of effect of glucocorticosteroids on all‐cause mortality (random‐effects RR 1.03, 95% CI 0.91 to 1.17; participants = 1343; trials = 3; I² = 0% (no heterogeneity among the trials); Analysis 1.1.3). We observed a similar result with the Trial Sequential Analysis showing that the cumulative Z‐curve entered the area of futility, which excludes an intervention effect of 20% RRR (Figure 7). The Trial Sequential analysis‐adjusted CI was CI 0.85 to 1.25. We rated the quality of the evidence as moderate (summary of findings Table for the main comparison).
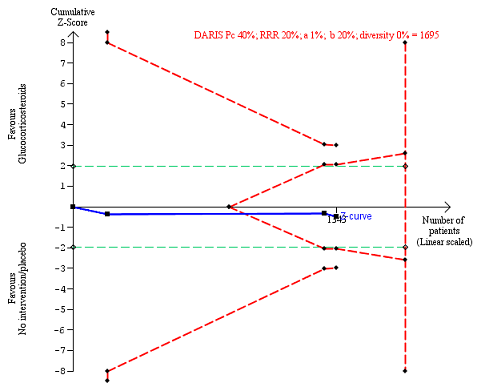
All‐cause mortality up to 1 year (post hoc analysis). Three trials provided data. The diversity‐adjusted required information size (DARIS) was calculated based on mortality in the control group of 40%; risk ratio reduction of 20% in the glucocorticosteroid group; type I error of 1%; and type II error of 20% (80% power). Trial diversity was 0%. The required information size was 1695 participants. The cumulative Z‐curve (blue line) did not cross the trial sequential monitoring boundaries for benefit or harm (red inward sloping lines). The cumulative Z‐curve crossed the inner‐wedge futility line (red outward sloping lines). The green dotted lines show the conventional boundaries of the naive alpha of 5% equal to Z‐scores of +1.96 and ‐1.96.
Subgroup analysis and investigation of heterogeneity: all‐cause mortality up to three months after randomisation
Trials at low risk of bias compared to trials at high risk of bias
As all the trials were at high risk of bias, we could not perform subgroup analysis on risk of bias.
Trials with people with mild alcoholic hepatitis compared to trials with severe alcoholic hepatitis, following Maddrey's score lower than or equal to or higher than 32, or presence of hepatic encephalopathy; or as provided by the trialists
There was no significant difference (P = 0.75) between the subgroups (mild alcoholic hepatitis RR 1.02, 95% CI 0.58 to 1.80; participants = 182; trials = 4; I² = 0%; Analysis 2.1.1) and severe alcoholic hepatitis (RR 0.92, 95% CI 0.73 to 1.16; participants = 1679; trials = 14; I² = 37%; Analysis 2.1.2).
Trials with glucocorticosteroid dose equal to or less than 40 mg compared to trials with glucocorticosteroid dose more than 40 mg
There was no significant difference (P = 0.22) between the subgroups of the trials with glucocorticosteroid dose less than or equal to 40 mg (RR 0.75, 95% CI 0.50 to 1.14; participants = 1547; trials = 10; I² = 58%; Analysis 2.2.1) and trials with glucocorticosteroid dose more than 40 mg (RR 1.02, 95% CI 0.79 to 1.30; participants = 314; trials = 5; I² = 0%; Analysis 2.2.2).
Trials with people with severe alcoholic hepatitis without cirrhosis compared to trials with people with severe alcoholic hepatitis with cirrhosis
There was no significant difference (P = 0.83) between the subgroups of the trials with severe alcoholic hepatitis without cirrhosis (RR 0.79, 95% CI 0.18 to 3.48; participants = 123; trials = 3; I² = 77%; Analysis 2.3.1) and trials with people with severe alcoholic hepatitis with cirrhosis (RR 0.92, 95% CI 0.74 to 1.16; participants = 1738; studies = 12; I2 = 35%; ; Analysis 2.3.2).
As only two trials classified cirrhosis by Child‐Pugh score (Bories 1987; De 2014) and we did not know what classification system the remaining trials had used, we could not perform a subgroup analysis in order to adjust for the clinical spectrum of the disease.
Trials with people with severe alcoholic hepatitis without hepatorenal syndrome compared to trials with people with severe alcoholic hepatitis with hepatorenal syndrome
There was no significant difference (P = 0.64) between the subgroups of the trials with people with severe alcoholic hepatitis without hepatorenal syndrome (RR 1.00, 95% CI 0.85 to 1.17; participants = 1382; studies = 8; I2 = 0%; Analysis 2.4.1) compared to trials with people with severe alcoholic hepatitis with hepatorenal syndrome (RR 0.56, 95% CI 0.05 to 6.49; participants = 129; studies = 2; I2 = 88%; Analysis 2.4.2). The presence of hepatorenal syndrome was not clearly described in five trials (Blitzer 1977; Bories 1987; Mendenhall 1977; Mendenhall 1984; Ramond 1992).
Trials with people with severe alcoholic hepatitis without ascites compared to trials with people with severe alcoholic hepatitis with ascites
As we did not have data on trials with participants not having ascites, we could analyse only the subgroup of trials including participants with ascites (RR 0.82, 95% CI 0.60 to 1.12; participants = 729; trials = 13; I² = 48%) (Analysis 2.5.1). In addition, the presence of ascites was not clearly described in two trials (Mendenhall 1977; Thursz 2015).
Health‐related quality of life
Up to three months
Only one trial reported on quality of life at follow‐up period of up to three months, using responses to the European Quality of Life ‐ 5 Dimensions‐3 Levels (EQ‐5D‐3L) (Thursz 2015). We applied the Student's t‐test for the glucocorticosteroids versus the placebo group. We observed no difference between the two groups (MD ‐0.04 points; 95% CI ‐0.11 to 0.03; Analysis 1.2). We rated the quality of the evidence as low (summary of findings Table for the main comparison). We did not perform Trial Sequential Analysis.
Up to one year
Only one trial reported on quality of life at follow‐up period of up to one year, using responses to the European Quality of Life ‐ 5 Dimensions‐3 Levels (EQ‐5D‐3L) (Thursz 2015). We applied the Student's t‐test for the glucocorticosteroids versus the placebo group. We observed no difference between the two groups (MD 0.00 points; 95% CI ‐0.11 to 0.10; Analysis 1.2). We rated the quality of the evidence as very low (summary of findings Table for the main comparison). We did not perform Trial Sequential Analysis.
Serious adverse events during treatment
Fifteen trials reported number of participants with serious adverse events during treatment. In total, 361 of 927 (38%) participants in the group treated with glucocorticosteroids had serious adverse events during treatment versus 338 of 934 (36%) participants in the control group. There was no evidence of effect of glucocorticosteroids on the occurrence of serious adverse events (random‐effects RR 1.05, 95% CI 0.85 to 1.29; participants = 1861; trials = 15; I² = 36% (moderate heterogeneity); Analysis 1.3). We observed a similar result with the Trial Sequential Analysis showing that the cumulative Z‐curve entered the area of futility which excludes an intervention effect of 20% RRR (Figure 8). The Trial Sequential analysis‐adjusted CI was 0.60 to 1.82. We rated the quality of the evidence as low (summary of findings Table for the main comparison).

Serious adverse events during treatment. There are 15 trials providing data. The diversity‐adjusted required information size (DARIS) was calculated based on an incidence rate of serious adverse events in the control group of 36%; risk ratio reduction of 20% in the glucocorticosteroid group; type I error of 1%; and type II error of 20% (80% power). Trial diversity was 70%. The required information size was 6566 participants. The cumulative Z‐curve (blue line) did not cross the trial sequential monitoring boundaries for benefit or harm (red inward sloping lines), but it entered the trial sequential monitoring area for futility (inner‐wedge futility line red outward sloping lines) indicating that sufficient information was provided. The green dotted lines show the conventional boundaries of the naive alpha of 5% equal to Z‐scores of +1.96 and ‐1.96.
Table 1 shows the number of participants with the most often occurring serious adverse events in 14 included trials; mortality is not included. Table 2 presents the most often occurring serious adverse events in Thursz 2015 because this trial did not specify the individual number of participants with a serious adverse event.
| Trial | Gastrointestinal haemorrhage | Hepatorenal syndrome (with or without hepatic failure) | Septicaemia | Hepatocellular carcinoma | ||||
| Prednisolone | Placebo | Prednisolone | Placebo | Prednisolone | Placebo | Prednisolone | Placebo | |
| 3 | ||||||||
| 4 | 2 | |||||||
| 3 | 5 | 4 | ||||||
| 3 | 2 | 2 | 2 fungal | 1 | ||||
| Not reported | ||||||||
| 1 | 1 | 3 | 6 | |||||
| 3 | 3 | 2 | ||||||
| 2 | 1 | 2 | 1 | |||||
| 11 | 6 | 7 | 6 | |||||
| 3 | 3 | 2 | ||||||
| 2 | 4 | 1 | ||||||
| 2 | ||||||||
| 1 | 2 | 1 | 1 | |||||
| 2 | 3 | 3 | 3 | 1 | ||||
| Type of adverse event | Prednisolone group | Placebo group |
| Gastrointestinal haemorrhage plus variceal bleeding | 40 | 28 |
| Infections | 74 | 43 |
| ‐ lung | 38 | 17 |
| ‐ sepsis | 14 | 14 |
We constructed a funnel plot for publication bias, and using the Harbord 2006 test, we found no evidence of reporting bias (P = 0.63).
'Best‐worst' case scenario analysis
There was no evidence of effect of glucocorticosteroids on serious adverse events during treatment, with neither of the models (random‐effects model (RR 1.00, 95% CI 0.83 to 1.21; participants = 1861; studies = 15; I2 = 28%) (not important heterogeneity) and fixed‐effect model RR 0.99, 95% CI 0.89 to 1.11; participants = 1861; I² = 28% (not important heterogeneity); Analysis 4.1).
'Worst‐best' case scenario analysis
While there was evidence of harmful effect of glucocorticosteroids with the fixed‐effect model (RR 1.18, 95% CI 1.05 to 1.31; participants = 1861; I² = 38%), there was no evidence of effect of glucocorticosteroids with the random‐effects model (RR 1.11, 95% CI 0.91 to 1.36; I² = 38%; Analysis 4.2).
Secondary outcomes
Liver‐related mortality up to three months following randomisation
In total, 257 of 927 (27.7%) participants in the group treated with glucocorticosteroids died versus 279 of 934 (29.9%) participants in the control group.
There was no evidence of effect of glucocorticosteroids on liver‐related mortality (random‐effects RR 0.89, 95% CI 0.69 to 1.14; participants = 1861; trials = 15; I² = 46% (moderate heterogeneity); Analysis 1.4). The heterogeneity among the trials was moderate. We observed a similar result with the Trial Sequential Analysis showing that the cumulative Z‐curve did not cross the trial sequential monitoring boundaries for benefit or harm, nor enter the trial sequential monitoring area for futility in order to include an intervention effect of 20% RRR (Figure 9). The Trial Sequential analysis‐adjusted CI was 0.32 to 2.45. We rated the quality of the evidence as low (summary of findings Table for the main comparison).

Liver‐related mortality up to three months after randomisation. Fifteen trials provided data. The diversity‐adjusted required information size (DARIS) was calculated based on liver‐ related mortality of 30% in the control group; risk ratio reduction in the glucocorticosteroid group of 20%; type I error of 1%; and type II error of 20% (80% power). Trial diversity was 68%. The required information size was 8059 participants. The cumulative Z‐curve (blue line) did not cross the trial sequential monitoring boundaries for benefit or harm (red inward sloping lines) and did not enter the trial sequential monitoring area for futility (inner‐wedge with red outward sloping lines). The green dotted lines show the conventional boundaries of the naive alpha of 5% equal to Z‐scores of +1.96 and ‐1.96.
Number of participants with any complication up to three months' follow‐up after randomisation
In total, 440 of 927 (47%) participants in the group treated with glucocorticosteroids had one or more complications versus 414 of 934 (44%) participants in the control group. There was no evidence of effect of glucocorticosteroids on frequency of any complications (random‐effects RR 1.04, 95% CI 0.86 to 1.27; participants = 1861; I² = 42% (moderate heterogeneity); Analysis 1.5). We observed a similar result with the Trial Sequential Analysis showing that the cumulative Z‐curve did not cross the trial sequential monitoring boundaries for benefit or harm, nor enter the trial sequential monitoring area for futility in order to include an intervention effect of 20% RRR (Figure 10). The Trial Sequential analysis‐adjusted CI was 0.67 to 1.63. We rated the quality of the evidence as very low, mainly due to within‐study bias, inconsistency, and imprecision (summary of findings Table for the main comparison).

Any complications up to three months after randomisation. Fifteen trials provided data. The diversity‐adjusted required information size (DARIS) was calculated based on any complications of 44% in the control group; risk ratio reduction in the glucocorticosteroid group of 20%; type I error of 1%; and type II error of 20% (80% power). Trial diversity was 75%. The required information size was 5887 participants. The cumulative Z‐curve (blue line) did not cross the trial sequential monitoring boundaries for benefit or harm (red inward sloping lines). The cumulative Z‐curve crossed the inner‐wedge futility line (red outward sloping lines). The green dotted lines show the conventional boundaries of the naive alpha of 5% equal to Z‐scores of +1.96 and ‐1.96.
Number of people with non‐serious adverse events up to three months following randomisation
Only four trials reported non‐serious adverse events such as Cushingoid symptoms, vertigo, and fungal lesions. There was no evidence of effect of glucocorticosteroids on frequency of non‐serious adverse events (random‐effects RR 1.99, 95% CI 0.72 to 5.48; participants = 160; trials = 4; I² = 0% (no heterogeneity); Analysis 1.6). We observed a similar result with the Trial Sequential Analysis showing that the cumulative Z‐curve did not cross the trial sequential monitoring boundaries for benefit or harm, nor enter the trial sequential monitoring area for futility in order to include an intervention effect of 50% RRR (Figure 11). The Trial Sequential Analysis‐adjusted CI was 0.01 to 249.60. We rated the quality of the evidence as very low (summary of findings Table for the main comparison).

Non‐serious adverse events up to three months after randomisation. Four trials provided data. The diversity‐adjusted required information size (DARIS) was calculated based on non‐serious adverse events of 5% in the control group; risk ratio reduction in the glucocorticosteroid group of 50%; type I error of 1%; and type II error of 20% (80% power). Trial diversity was 0%. The required information size was 2698 participants. The cumulative Z‐curve (blue line) did not cross the trial sequential monitoring boundaries for benefit or harm (red inward sloping lines) and did not enter the trial sequential monitoring area for futility (inner‐wedge with red outward sloping lines). The green dotted lines show the conventional boundaries of the naive alpha of 5% equal to Z‐scores of +1.96 and ‐1.96.
Exploratory outcomes at the end of treatment
No trial reported on number of participants with change of level of liver enzymes, prothrombin index, or serum albumin at the end of treatment. This is why we could not perform the planned exploratory analyses. Instead, post hoc, we decided to present in a tabular way the extracted information on level of liver enzymes reported in the trials by Campra 1973; Maddrey 1978; Theodossi 1982; and Carithers 1989 (Appendix 2); prothrombin index or international normalised ratio reported in the trials by Campra 1973; Maddrey 1978; Theodossi 1982; Carithers 1989; Ramond 1992 (Appendix 3); and level of serum albumin (and bilirubin ‐ post hoc again) reported in the trials by Campra 1973; Maddrey 1978; Depew 1980; Theodossi 1982; Carithers 1989; and Ramond 1992 ( Appendix 4; Appendix 5).
'Summary of findings' table
We have presented the key results on the outcomes mortality, health‐related quality of life, serious adverse events, liver‐related mortality, all complications, and non‐serious adverse events in summary of findings Table for the main comparison. We assessed the evidence as being very low to low.
Discussion
Summary of main results
We included 16 randomised clinical trials comparing glucocorticosteroids versus placebo or no intervention in people with alcoholic hepatitis. Fifteen of the trials provided data for analyses. Our traditional meta‐analyses showed no beneficial or detrimental effects of glucocorticosteroids on any of our outcomes. In general, serious and non‐serious adverse events as well as complications were poorly reported or the information was unclear, and hence, these analyses may be subject to outcome reporting bias (Ioannidis 2009). Trial Sequential Analyses showed similar results. Based on methodological concerns, we classified the strength of the evidence as very low to moderate. As the trials were at high risk of bias, it is more likely that we are overestimating benefits and overlooking harms.
Overall completeness and applicability of evidence
The trial participants varied according to severity of alcoholic hepatitis and the trials were published between 1971 and 2014. However, only 1861 participants were included. During this time period, glucocorticosteroid interventions varied regarding dose and duration. The small number of trials and trial participants, except for the Thursz 2015 trial, the poor trial design and reporting, make the results of our review inconclusive. The high risk of bias of the trials undermines the precision of our meta‐analyses results.
We were not able to assess if ethnicity had any influence on our results, as data were either lacking or insufficient. The same applied for the nutritional status of the participants, as only one trial reported on it (Mendenhall 1984). Mathurin and coworkers have proposed that people with alcoholic hepatitis with Madderey's score of at least 32 should likely benefit from glucocorticosteroids (Mathurin 2011). However, we did not find a significant effect of glucocorticosteroids in this subgroup of trial participants.
This review is applicable in people with alcoholic hepatitis at different stages of the disease. Our meta‐analyses and Trial Sequential Analyses seem to provide no evidence of benefit of glucocorticosteroids on all‐cause mortality at one‐year follow‐up after randomisation. It is also unlikely that glucocorticosteroids may have a beneficial effect on mortality at end of treatment and three months following randomisation; however, due to mainly imprecision (the confidence interval crossed the clinical decision threshold between recommending and not recommending treatment and the required number of participants is far from reached), we cannot exclude the possibility of a short‐term beneficial or harmful effect. We cannot say if glucocorticosteroids may influence infection and gastrointestinal bleeding as we had no data for meta‐analysis. However, Thursz 2015 and colleagues' analysis shows an increase in the number of these complications in treated participants.
Quality of the evidence
The quality of the evidence reflects only the quality of the included trials so we cannot be certain of our conclusions. We judged the overall quality of evidence as very low to low for all outcomes except for all‐cause mortality at one year after randomisation, for which the quality of the evidence was moderate. All trials were at high risk of bias, mainly because the randomisation procedures were insufficiently reported. In addition to downgrading the trials for within‐study risk of bias, we also downgraded the trials for imprecision of effect estimates due to the number of participants included in the trials (all but one of the 14 trials had fewer than 400 participants), and for inconsistency of our results (there was wide variation in the effect estimates across the trials; there was little overlap of confidence intervals associated with the effect estimates; and we assessed heterogeneity of the data as moderate with I² of 36% to 46%, which could be explained with selection bias). We also found some evidence of publication bias or small study bias.
In spite of the quality of the evidence being mostly low to very low, we are pretty confident in our recommendations regarding implications for practice and for research. This ensues from our analysis results and is based on the knowledge that trials at high risk of bias overestimate benefits and underestimate harms. Therefore, we do not find supporting evidence for using glucocorticosteroids in clinical practice. There is definitely a need for more transparent reporting of individual participant data (NTAWG 2015; Garattini 2016).
Potential biases in the review process
The strengths of our review are that we have conducted our review following the recommendations of Cochrane Hepato‐Biliary and the Cochrane Handbook for Systematic Reviews of Interventions (Higgins 2011; Gluud 2017). We included only randomised clinical trials in our review. This creates a bias towards benefits as short‐term randomised trials often overlook harms. We attempted to minimise possible selection biases by using a comprehensive search strategy. We combined searches in electronic databases with extensive manual searches. In addition, we also searched conference proceedings and abstract books, irrespective of language. We think it is unlikely that we have missed any published trials, but we cannot exclude the possibility that we have missed unpublished trials. In fact, visual inspection of the funnel plots suggests publication bias or small trial bias on the outcomes, mortality at end of treatment and following three months after randomisation (Figure 5). We wrote to pharmaceutical companies as well as to regulatory authorities. We made extensive attempts to avoid risk of system and random errors. We assessed the evidence with GRADE approach.
Limitations of our review were the small number of trials and the small total number of participants. Having in mind that hepatitis C viral disease was discovered as late as 1989, we might have run the risk that the included trials initiated before 1989 did not include participants with only alcoholic hepatitis (Houghton 2009). Furthermore, our results are hampered by the quality of the included trials as well as imprecision and severe inconsistency. Even though all trials provided data on mortality, data on other serious adverse events and complications were rarely reported, which calls into question the reliability of the two latter analyses. Moreover, by including primarily randomised clinical trials we have focused on potential beneficial effects and overlooked the many known harms connected with the administration of glucocorticosteroids. Again, these flaws in our review make us suspect that benefits are overestimated and harms are underestimated.
When conducting our Trial Sequential Analyses, we used plausible parameters to calculate our required information sizes. However, we only used 80% power (beta = 20%). Had we used 90% power (beta = 10%) or less, which is relevant in meta‐analyses where one does not want to discharge a potentially relevant intervention, then we would have obtained larger required information sizes and wider Trial Sequential Analyses‐adjusted Confidence Intervals (Garattini 2016; Castellini 2017). Accordingly, the imprecision may be worse than signalled by our analyses.
Agreements and disagreements with other studies or reviews
The meta‐analysis by Christensen 1995 and colleagues found no effect of glucocorticosteroids versus placebo on mortality. This review included data from 13 trials with 659 participants randomised. Rambaldi 2008 and colleagues updated the meta‐analysis by Christensen 1995, adding two more trials with 62 participants randomised. Hence, Rambaldi 2008 and colleagues concluded that depending on the estimation of the information size, their review lacked another 1000 to 2000 participants randomised to glucocorticosteroids versus placebo in order to be able to either demonstrate or reject a clinically relevant 20% mortality reduction.
We found two new trials for inclusion in our review (De 2014; Thursz 2015). However, we excluded two of the trials from the Rambaldi and colleagues review (Rambaldi 2008) as they assessed glucocorticosteroids versus nutrition (Lesesne 1978; Cabré 2000). In addition, two trial reports turned out to be the same trial (Shumaker 1978; Galambos 1984), and thus, we counted them as one trial.
Our systematic review of pair‐wise comparison randomised clinical trials is in agreement with the recent meta‐analysis by Buzzetti 2017. In this network meta‐analysis, the authors found no significant effects of glucocorticosteroids on mortality at maximal follow‐up and up to 90 days of follow‐up.
Due to the inclusion of the two new trials, our review now includes 1861 participants. The Thursz 2015 trial included 1103 participants and found "a reduction in the 28‐day mortality in the prednisolone‐treated group on logistic regression model analysis, but there was not clear evidence of benefit, sustained beyond this point". Mathurin 2011 performed "analysis of individual data from five randomised clinical trials which showed that corticosteroids significantly improved 28‐day survival in patients with severe alcoholic hepatitis". In our present aggregate meta‐analysis, we cannot see an effect of glucocorticosteroids on mortality at 'end of treatment', which is quite close to 28 days.
Modern clinical guidelines recommend prescribing glucocorticosteroids: "Patients with severe disease (Maddrey's Discriminant Function (MDF) score of > 32, with or without hepatic encephalopathy) and lacking contraindications to steroid use should be considered for a four‐week course of prednisolone (40 mg/day for 28 days, typically followed by discontinuation or a 2‐week taper) (Class I, level A)" (AASLD 2010); and "First‐line therapy in patients with severe alcoholic hepatitis includes corticosteroids or, in case of ongoing sepsis, pentoxifylline (Recommendation B1) (see original publication for Figure 2)" (EASL 2012). In our present aggregate meta‐analysis, we cannot find a beneficial effect of glucocorticosteroids in people with severe alcoholic hepatitis.

Study flow diagram

Risk of bias graph: review authors' judgements about each risk of bias domain presented as percentages across all included studies

Risk of bias summary: review authors' judgements about each risk of bias domain for each included study

All‐cause mortality up to three months after randomisation. Fifteen trials provided data. The diversity‐adjusted required information size (DARIS) was calculated based on all‐cause mortality of 30% in the control group; risk ratio reduction in the glucocorticosteroid group of 20%; type I error of 1%; and type II error of 20% (80% power). Trial diversity was 62%. The required information size was 6734 participants. The cumulative Z‐curve (blue line) did not cross the trial sequential monitoring boundaries for benefit or harm (red inward sloping lines) and did not enter the trial sequential monitoring area for futility (inner‐wedge with red outward sloping lines). The green dotted lines show the conventional boundaries of the naive alpha of 5% equal to Z‐scores of +1.96 and ‐1.96.

Funnel plot of comparison 1. Glucocorticosteroids versus no intervention/placebo, outcome 1.1 all‐cause mortality

All‐cause mortality at the end of treatment (median 28 days (range 3 days to 12 weeks) (post hoc analysis). Fourteen trials provided data. The diversity‐adjusted required information size (DARIS) was calculated based on all‐cause mortality of 22% in the control group; risk ratio reduction in the glucocorticosteroid group of 20%; type I error of 1%; and type II error of 20% (80% power). Trial diversity was 59%. The required information size was 9242 participants. The cumulative Z‐curve (blue line) did not cross the trial sequential monitoring boundaries for benefit or harm (red inward sloping lines) and did not enter the trial sequential monitoring area for futility (inner‐wedge with red outward sloping lines). The green dotted lines show the conventional boundaries of the naive alpha of 5% equal to Z‐scores of +1.96 and ‐1.96.

All‐cause mortality up to 1 year (post hoc analysis). Three trials provided data. The diversity‐adjusted required information size (DARIS) was calculated based on mortality in the control group of 40%; risk ratio reduction of 20% in the glucocorticosteroid group; type I error of 1%; and type II error of 20% (80% power). Trial diversity was 0%. The required information size was 1695 participants. The cumulative Z‐curve (blue line) did not cross the trial sequential monitoring boundaries for benefit or harm (red inward sloping lines). The cumulative Z‐curve crossed the inner‐wedge futility line (red outward sloping lines). The green dotted lines show the conventional boundaries of the naive alpha of 5% equal to Z‐scores of +1.96 and ‐1.96.
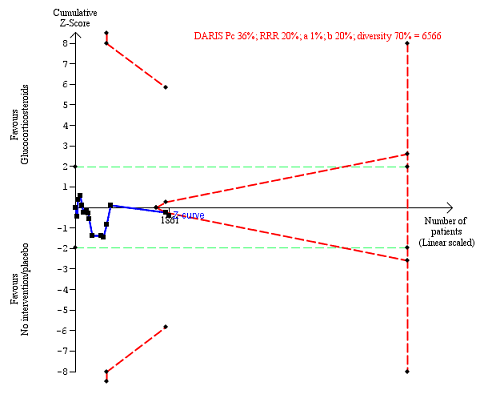
Serious adverse events during treatment. There are 15 trials providing data. The diversity‐adjusted required information size (DARIS) was calculated based on an incidence rate of serious adverse events in the control group of 36%; risk ratio reduction of 20% in the glucocorticosteroid group; type I error of 1%; and type II error of 20% (80% power). Trial diversity was 70%. The required information size was 6566 participants. The cumulative Z‐curve (blue line) did not cross the trial sequential monitoring boundaries for benefit or harm (red inward sloping lines), but it entered the trial sequential monitoring area for futility (inner‐wedge futility line red outward sloping lines) indicating that sufficient information was provided. The green dotted lines show the conventional boundaries of the naive alpha of 5% equal to Z‐scores of +1.96 and ‐1.96.
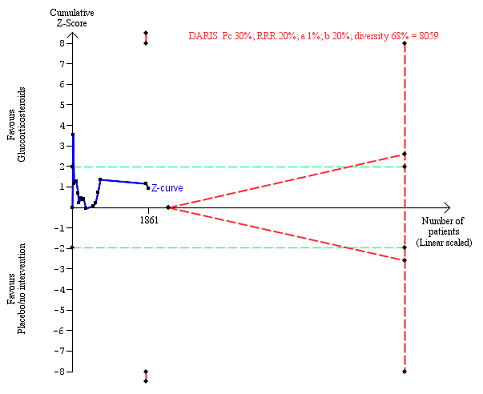
Liver‐related mortality up to three months after randomisation. Fifteen trials provided data. The diversity‐adjusted required information size (DARIS) was calculated based on liver‐ related mortality of 30% in the control group; risk ratio reduction in the glucocorticosteroid group of 20%; type I error of 1%; and type II error of 20% (80% power). Trial diversity was 68%. The required information size was 8059 participants. The cumulative Z‐curve (blue line) did not cross the trial sequential monitoring boundaries for benefit or harm (red inward sloping lines) and did not enter the trial sequential monitoring area for futility (inner‐wedge with red outward sloping lines). The green dotted lines show the conventional boundaries of the naive alpha of 5% equal to Z‐scores of +1.96 and ‐1.96.
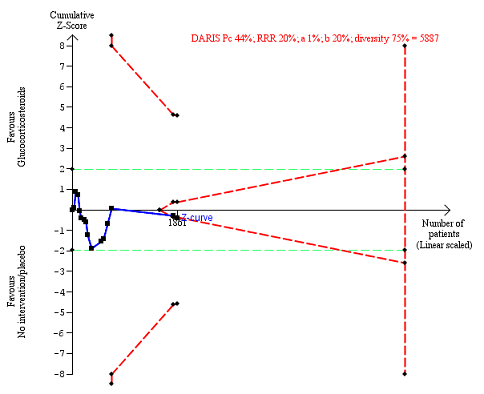
Any complications up to three months after randomisation. Fifteen trials provided data. The diversity‐adjusted required information size (DARIS) was calculated based on any complications of 44% in the control group; risk ratio reduction in the glucocorticosteroid group of 20%; type I error of 1%; and type II error of 20% (80% power). Trial diversity was 75%. The required information size was 5887 participants. The cumulative Z‐curve (blue line) did not cross the trial sequential monitoring boundaries for benefit or harm (red inward sloping lines). The cumulative Z‐curve crossed the inner‐wedge futility line (red outward sloping lines). The green dotted lines show the conventional boundaries of the naive alpha of 5% equal to Z‐scores of +1.96 and ‐1.96.
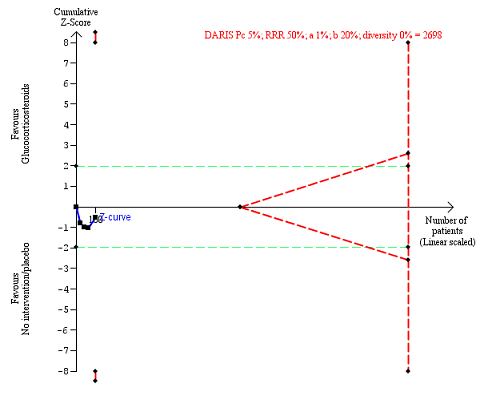
Non‐serious adverse events up to three months after randomisation. Four trials provided data. The diversity‐adjusted required information size (DARIS) was calculated based on non‐serious adverse events of 5% in the control group; risk ratio reduction in the glucocorticosteroid group of 50%; type I error of 1%; and type II error of 20% (80% power). Trial diversity was 0%. The required information size was 2698 participants. The cumulative Z‐curve (blue line) did not cross the trial sequential monitoring boundaries for benefit or harm (red inward sloping lines) and did not enter the trial sequential monitoring area for futility (inner‐wedge with red outward sloping lines). The green dotted lines show the conventional boundaries of the naive alpha of 5% equal to Z‐scores of +1.96 and ‐1.96.

Comparison 1 Glucocorticosteroids versus no intervention/placebo, Outcome 1 All‐cause mortality.

Comparison 1 Glucocorticosteroids versus no intervention/placebo, Outcome 2 Health‐related quality of life.

Comparison 1 Glucocorticosteroids versus no intervention/placebo, Outcome 3 Number of participants with serious adverse events during treatment.

Comparison 1 Glucocorticosteroids versus no intervention/placebo, Outcome 4 Liver‐related mortality.
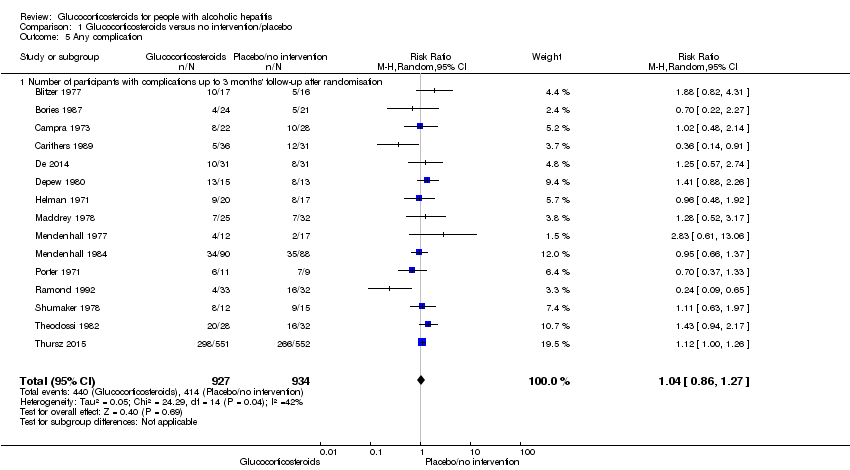
Comparison 1 Glucocorticosteroids versus no intervention/placebo, Outcome 5 Any complication.

Comparison 1 Glucocorticosteroids versus no intervention/placebo, Outcome 6 Number of participants with non‐serious adverse events up to 3 months' follow‐up after randomisation.

Comparison 2 Subgroup analysis: all‐cause mortality up to 3 months after randomisation, Outcome 1 Severity of alcoholic hepatitis.

Comparison 2 Subgroup analysis: all‐cause mortality up to 3 months after randomisation, Outcome 2 Glucocorticosteroid (prednisolone) dose.
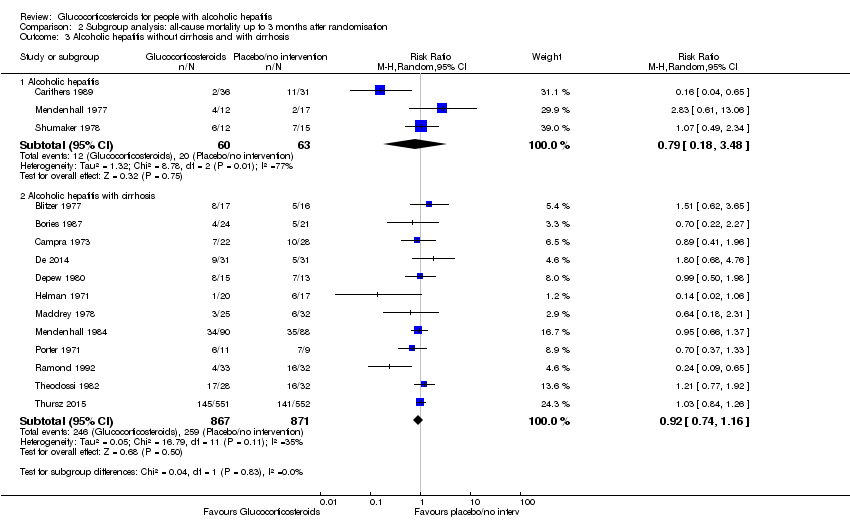
Comparison 2 Subgroup analysis: all‐cause mortality up to 3 months after randomisation, Outcome 3 Alcoholic hepatitis without cirrhosis and with cirrhosis.

Comparison 2 Subgroup analysis: all‐cause mortality up to 3 months after randomisation, Outcome 4 Hepatorenal syndrome.

Comparison 2 Subgroup analysis: all‐cause mortality up to 3 months after randomisation, Outcome 5 Ascites.

Comparison 3 Sensitivity analysis: all‐cause mortality, Outcome 1 Best‐worst scenario all‐cause mortality to 3 months follow‐up.

Comparison 3 Sensitivity analysis: all‐cause mortality, Outcome 2 Worst‐best scenario all‐cause mortality to 3 months follow‐up.

Comparison 4 Sensitivity analysis: serious adverse events, Outcome 1 Best‐worse scenario of serious adverse events during treatment.

Comparison 4 Sensitivity analysis: serious adverse events, Outcome 2 Worst‐best scenario of serious adverse events during treatment.
| Glucocorticosteroids for people with alcoholic hepatitis | ||||||
| Patient or population: participants with alcoholic hepatitis at high risk of mortality and morbidity Settings: hospitals and clinics Intervention: glucocorticosteroids Comparison: placebo or no intervention | ||||||
| Outcomes | Illustrative comparative risks* (95% CI) | Relative effect | No of participants | Quality of the evidence | Comments | |
| Assumed risk | Corresponding risk | |||||
| Placebo or no intervention | Glucocorticosteroids | |||||
| All‐cause mortality: 3 months following randomisation | 298 per 1000 | 278 per 1000 | RR 0.90 (0.70 to 1.15) | 1861 (15 RCTs) | ⊕⊝⊝⊝1 | The Trial Sequential Analysis‐adjusted CI was 0.36 to 2.32 |
| Health‐related quality of life: up to 3 months (measured withEuropean Quality of Life ‐ 5 Dimensions‐3 Levels (EQ‐ 5D‐3L) scale) | The mean value is 0.592 | The mean value is 0.553 | MD ‐0.04; (‐0.11 to 0.03) | 377 (1 RCT) | ⊕⊕⊝⊝2 low | We did not perform Trial Sequential Analysis |
| Serious adverse events during treatment | 361 per 1000 | 389 per 1000 | RR 1.05 (0.85 to 1.29) | 1861 (15 RCTs) | ⊕⊕⊝⊝3 | The Trial Sequential Analysis‐adjusted CI was 0.60 to 1.82 |
| Liver‐related mortality: up to 3 months following randomisation | 298 per 1000 | 277 per 1000 | RR 0.89 (0.69 to 1.14) | 1861 (15 RCTs) | ⊕⊕⊝⊝4 | The Trial Sequential Analysis‐adjusted CI was 0.32 to 2.45 |
| Any complication: up to 3 months following randomisation | 443 per 1000 | 474 per 1000 | RR 1.04 (0.86 to 1.27) | 1861 (15 RCTs) | ⊕⊕⊝⊝5 | The Trial Sequential Analysis‐adjusted CI was 0.67 to 1.63 |
| Number of participants with non‐serious adverse events: up to 3 months' follow‐up after end of treatment | 51 per 1000 | 120 per 1000 | RR 1.99 (0.72 to 5.48) | 160 (4 RCTs) | ⊕⊝⊝⊝6 | The Trial Sequential Analysis‐adjusted CI was 0.01 to 249.60 |
| *The basis for the assumed risk (e.g. the median control group risk across studies) is provided in footnotes. The corresponding risk (and its 95% confidence interval) is based on the assumed risk in the comparison group and the relative effect of the intervention (and its 95% CI). | ||||||
| GRADE Working Group grades of evidence | ||||||
| 1Downgraded 3 levels: 1 level due to within‐study risk of bias (high overall risk of bias in all the trials); 1 level due to inconsistency of the data (there is wide variation in the effect estimates across studies; there is little overlap of confidence intervals associated with the effect estimates; presence of moderate heterogeneity: I² = 45%; heterogeneity could be explained with selection bias); 1 level due to imprecision of effect estimates (the trial sequential analysis showed that additional evidence is needed and that we have not yet reached the required information size). | ||||||
| Trial | Gastrointestinal haemorrhage | Hepatorenal syndrome (with or without hepatic failure) | Septicaemia | Hepatocellular carcinoma | ||||
| Prednisolone | Placebo | Prednisolone | Placebo | Prednisolone | Placebo | Prednisolone | Placebo | |
| 3 | ||||||||
| 4 | 2 | |||||||
| 3 | 5 | 4 | ||||||
| 3 | 2 | 2 | 2 fungal | 1 | ||||
| Not reported | ||||||||
| 1 | 1 | 3 | 6 | |||||
| 3 | 3 | 2 | ||||||
| 2 | 1 | 2 | 1 | |||||
| 11 | 6 | 7 | 6 | |||||
| 3 | 3 | 2 | ||||||
| 2 | 4 | 1 | ||||||
| 2 | ||||||||
| 1 | 2 | 1 | 1 | |||||
| 2 | 3 | 3 | 3 | 1 | ||||
| Type of adverse event | Prednisolone group | Placebo group |
| Gastrointestinal haemorrhage plus variceal bleeding | 40 | 28 |
| Infections | 74 | 43 |
| ‐ lung | 38 | 17 |
| ‐ sepsis | 14 | 14 |
| Outcome or subgroup title | No. of studies | No. of participants | Statistical method | Effect size |
| 1 All‐cause mortality Show forest plot | 15 | Risk Ratio (M‐H, Random, 95% CI) | Subtotals only | |
| 1.1 Up to 3 months after randomisation | 15 | 1861 | Risk Ratio (M‐H, Random, 95% CI) | 0.90 [0.70, 1.15] |
| 1.2 At the end of treatment | 14 | 1824 | Risk Ratio (M‐H, Random, 95% CI) | 0.87 [0.66, 1.15] |
| 1.3 At 1 year after randomisation | 3 | 1343 | Risk Ratio (M‐H, Random, 95% CI) | 1.03 [0.91, 1.17] |
| 2 Health‐related quality of life Show forest plot | 1 | Mean Difference (IV, Random, 95% CI) | Totals not selected | |
| 2.1 Up to three months | 1 | Mean Difference (IV, Random, 95% CI) | 0.0 [0.0, 0.0] | |
| 2.2 Up to one year | 1 | Mean Difference (IV, Random, 95% CI) | 0.0 [0.0, 0.0] | |
| 3 Number of participants with serious adverse events during treatment Show forest plot | 15 | 1861 | Risk Ratio (M‐H, Random, 95% CI) | 1.05 [0.85, 1.29] |
| 4 Liver‐related mortality Show forest plot | 15 | 1861 | Risk Ratio (M‐H, Random, 95% CI) | 0.89 [0.69, 1.14] |
| 4.1 Up to 3 months' follow‐up after randomisation | 15 | 1861 | Risk Ratio (M‐H, Random, 95% CI) | 0.89 [0.69, 1.14] |
| 5 Any complication Show forest plot | 15 | 1861 | Risk Ratio (M‐H, Random, 95% CI) | 1.04 [0.86, 1.27] |
| 5.1 Number of participants with complications up to 3 months' follow‐up after randomisation | 15 | 1861 | Risk Ratio (M‐H, Random, 95% CI) | 1.04 [0.86, 1.27] |
| 6 Number of participants with non‐serious adverse events up to 3 months' follow‐up after randomisation Show forest plot | 4 | 160 | Risk Ratio (M‐H, Fixed, 95% CI) | 1.99 [0.72, 5.48] |
| Outcome or subgroup title | No. of studies | No. of participants | Statistical method | Effect size |
| 1 Severity of alcoholic hepatitis Show forest plot | 15 | Risk Ratio (M‐H, Random, 95% CI) | Subtotals only | |
| 1.1 Mild alcoholic hepatitis | 4 | 182 | Risk Ratio (M‐H, Random, 95% CI) | 1.02 [0.58, 1.80] |
| 1.2 Severe alcoholic hepatitis | 14 | 1679 | Risk Ratio (M‐H, Random, 95% CI) | 0.92 [0.73, 1.16] |
| 2 Glucocorticosteroid (prednisolone) dose Show forest plot | 15 | Risk Ratio (M‐H, Random, 95% CI) | Subtotals only | |
| 2.1 Less than or equal to 40 mg | 10 | 1547 | Risk Ratio (M‐H, Random, 95% CI) | 0.75 [0.50, 1.14] |
| 2.2 More than 40 mg | 5 | 314 | Risk Ratio (M‐H, Random, 95% CI) | 1.02 [0.79, 1.30] |
| 3 Alcoholic hepatitis without cirrhosis and with cirrhosis Show forest plot | 15 | Risk Ratio (M‐H, Random, 95% CI) | Subtotals only | |
| 3.1 Alcoholic hepatitis | 3 | 123 | Risk Ratio (M‐H, Random, 95% CI) | 0.79 [0.18, 3.48] |
| 3.2 Alcoholic hepatitis with cirrhosis | 12 | 1738 | Risk Ratio (M‐H, Random, 95% CI) | 0.92 [0.74, 1.16] |
| 4 Hepatorenal syndrome Show forest plot | 10 | Risk Ratio (M‐H, Random, 95% CI) | Subtotals only | |
| 4.1 With hepatorenal syndrome | 8 | 1382 | Risk Ratio (M‐H, Random, 95% CI) | 1.00 [0.85, 1.17] |
| 4.2 Without hepatorenal syndrome | 2 | 129 | Risk Ratio (M‐H, Random, 95% CI) | 0.56 [0.05, 6.49] |
| 5 Ascites Show forest plot | 13 | Risk Ratio (M‐H, Random, 95% CI) | Subtotals only | |
| 5.1 With ascites | 13 | 729 | Risk Ratio (M‐H, Random, 95% CI) | 0.82 [0.60, 1.12] |
| Outcome or subgroup title | No. of studies | No. of participants | Statistical method | Effect size |
| 1 Best‐worst scenario all‐cause mortality to 3 months follow‐up Show forest plot | 15 | Risk Ratio (M‐H, Random, 95% CI) | Subtotals only | |
| 1.1 Up to 3 months | 15 | 1861 | Risk Ratio (M‐H, Random, 95% CI) | 0.82 [0.64, 1.05] |
| 2 Worst‐best scenario all‐cause mortality to 3 months follow‐up Show forest plot | 15 | Risk Ratio (M‐H, Fixed, 95% CI) | Subtotals only | |
| 2.1 Up to 3 months | 15 | 1861 | Risk Ratio (M‐H, Fixed, 95% CI) | 1.21 [1.06, 1.37] |
| Outcome or subgroup title | No. of studies | No. of participants | Statistical method | Effect size |
| 1 Best‐worse scenario of serious adverse events during treatment Show forest plot | 15 | 1861 | Risk Ratio (M‐H, Random, 95% CI) | 1.00 [0.83, 1.21] |
| 2 Worst‐best scenario of serious adverse events during treatment Show forest plot | 15 | 1861 | Risk Ratio (M‐H, Fixed, 95% CI) | 1.18 [1.05, 1.31] |