Endometrial resection and ablation techniques for heavy menstrual bleeding
Información
- DOI:
- https://doi.org/10.1002/14651858.CD001501.pub4Copiar DOI

- Base de datos:
-
- Cochrane Database of Systematic Reviews
- Versión publicada:
-
- 30 agosto 2013see what's new
- Tipo:
-
- Intervention
- Etapa:
-
- Review
- Grupo Editorial Cochrane:
-
Grupo Cochrane de Ginecología y fertilidad
- Copyright:
-
- Copyright © 2013 The Cochrane Collaboration. Published by John Wiley & Sons, Ltd.
Cifras del artículo
Altmetric:
Citado por:
Autores
Contributions of authors
Ray Garry commented on the final draft of an earlier version of the review.
Martha Hickey commented on the final list of included trials, extracted data from the included trials for earlier versions of the review, wrote the discussion and conclusion, and commented on the draft of the protocol and an earlier version of the full review.
Anne Lethaby wrote the protocol, searched for relevant trials, assessed trials for eligibility for inclusion, extracted data from the included trials, assessed trials for risk of bias, compared the independent data extraction and clarified points of disagreement, entered the data and wrote and commented on the final review (excluding the discussion and conclusion).
Julie Brown performed independent selection of trials for the 2009 update.
Josien Penninx performed independent data extraction and assessment of risk of bias for the 2009 and 2013 updates and commented on the final version of the review.
Jane Marjoribanks helped update the search for the 2013 update.
Sources of support
Internal sources
-
No sources of support supplied
External sources
-
UK NHS, Not specified.
The update in 2009 was funded by Dept of Health (England) Incentive Scheme 2008
Declarations of interest
The review authors did not report any conflict of interest.
Acknowledgements
The review authors acknowledge and thank the Cochrane Menstrual Disorders and Subfertility Group for extensive support in the preparation of this review. Special thanks are due to Shauna Sylvester, Sarah Hetrick, Michelle Proctor, Jane Clarke and Helen Nagels (Managing Editors during the lifecycle of this review), Sue Furness, Ruth Withers and Marian Showell (Trials Search Co‐ordinators), Neil Johnson (Editor) and Sue Hall (for secretarial assistance). The review authors also thank Amy Goodwin, Manager of Clinical Research, Gyncare for extra data and answering queries on the Meyer trial, authors from some of the other trials (Abbott 2003; Boujida 2002; Perino 2004; Soysal 2001; van Zon‐Rabelink 2003), and Joerg Neumann for translating the relevant sections of the Romer trial. The review authors are also indebted to Sarah Hetrick of the Australasian Cochrane Centre who has helped with the update searching in 2004, extraction of data and addition of entries to the Characteristics of included studies.
Version history
| Published | Title | Stage | Authors | Version |
| 2019 Jan 22 | Endometrial resection and ablation techniques for heavy menstrual bleeding | Review | Magdalena Bofill Rodriguez, Anne Lethaby, Mihaela Grigore, Julie Brown, Martha Hickey, Cindy Farquhar | |
| 2013 Aug 30 | Endometrial resection and ablation techniques for heavy menstrual bleeding | Review | Anne Lethaby, Josien Penninx, Martha Hickey, Ray Garry, Jane Marjoribanks | |
| 2009 Oct 07 | Endometrial resection / ablation techniques for heavy menstrual bleeding | Review | Anne Lethaby, Martha Hickey, Ray Garry, Josien Penninx | |
| 2009 Jul 08 | Endometrial destruction techniques for heavy menstrual bleeding | Review | Anne Lethaby, Martha Hickey, Ray Garry | |
| 2002 Apr 22 | Endometrial destruction techniques for heavy menstrual bleeding | Review | Anne Lethaby, Martha Hickey | |
Differences between protocol and review
Title changed from 'Endometrial destruction techniques for heavy menstrual bleeding' to 'Endometrial resection / ablation techniques for heavy menstrual bleeding' in December 2008.
Keywords
MeSH
Medical Subject Headings (MeSH) Keywords
Medical Subject Headings Check Words
Adult; Female; Humans; Middle Aged;
PICO

Study flow diagram.
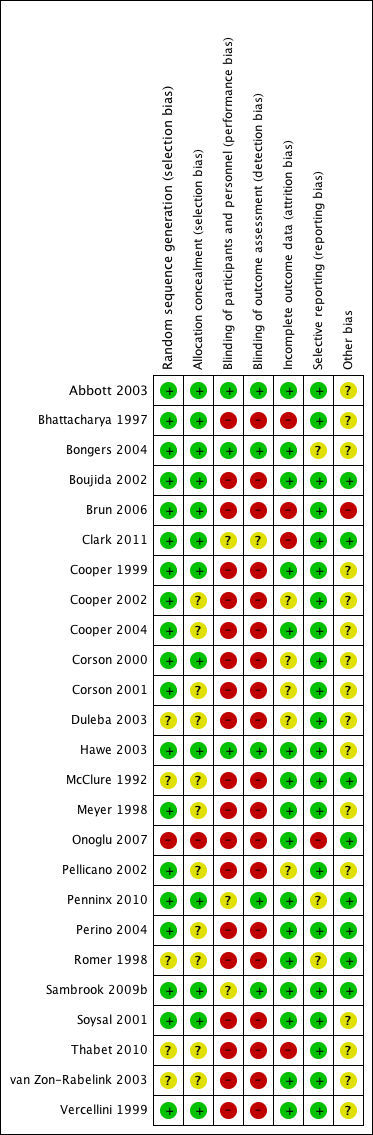
Methodological quality summary: review authors' judgements about each methodological quality item for each included study.
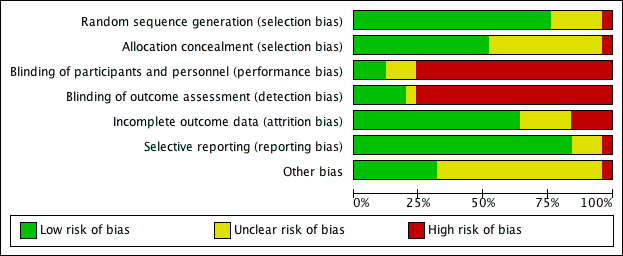
Risk of bias graph: review authors' judgements about each risk of bias item presented as percentages across all included studies.

Funnel plot of comparison: 16 Overall analyses: Second‐generation endometrial ablation versus first‐generation endometrial ablation, outcome: 16.2 Satisfaction rate.

Comparison 1 Laser ablation (first generation) versus transcervical resection of the endometrium (TCRE) (first generation), Outcome 1 Amenorrhoea rate.

Comparison 1 Laser ablation (first generation) versus transcervical resection of the endometrium (TCRE) (first generation), Outcome 2 Amenorrhoea/hypomenorrhoea rate.
| Study | Laser ablation | TCRE + RB | Results |
| McClure 1992 | N=12 | N=10 | Mann Whitney test. |
Comparison 1 Laser ablation (first generation) versus transcervical resection of the endometrium (TCRE) (first generation), Outcome 3 MBL at 6 months (descriptive data).

Comparison 1 Laser ablation (first generation) versus transcervical resection of the endometrium (TCRE) (first generation), Outcome 4 Participant satisfaction at 12 months (very/moderately).

Comparison 1 Laser ablation (first generation) versus transcervical resection of the endometrium (TCRE) (first generation), Outcome 5 Duration of operation (mins).
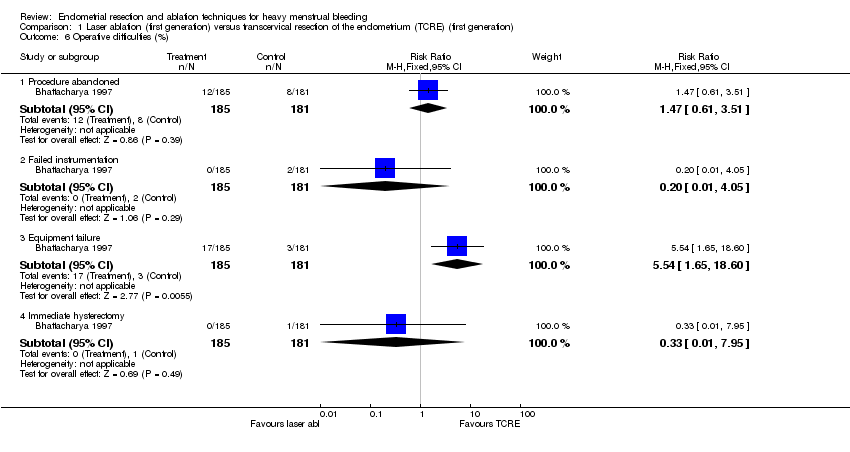
Comparison 1 Laser ablation (first generation) versus transcervical resection of the endometrium (TCRE) (first generation), Outcome 6 Operative difficulties (%).

Comparison 1 Laser ablation (first generation) versus transcervical resection of the endometrium (TCRE) (first generation), Outcome 7 Good general health (proportion of women).
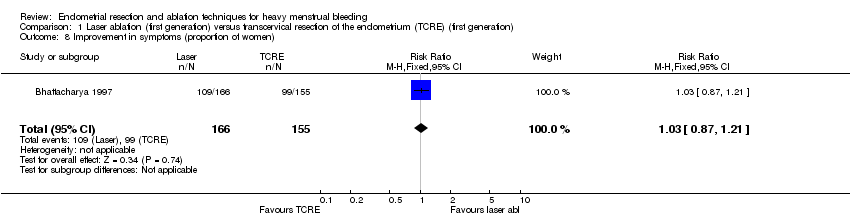
Comparison 1 Laser ablation (first generation) versus transcervical resection of the endometrium (TCRE) (first generation), Outcome 8 Improvement in symptoms (proportion of women).
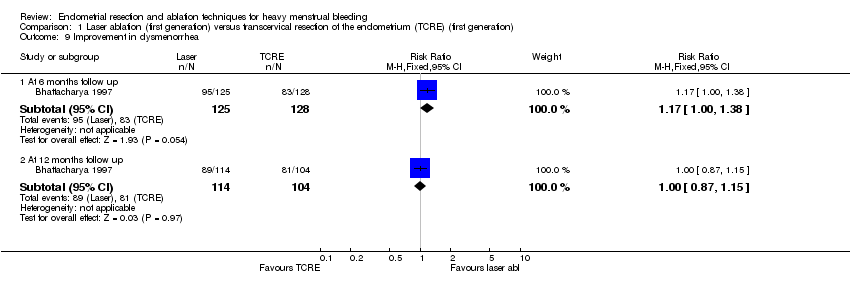
Comparison 1 Laser ablation (first generation) versus transcervical resection of the endometrium (TCRE) (first generation), Outcome 9 Improvement in dysmenorrhea.
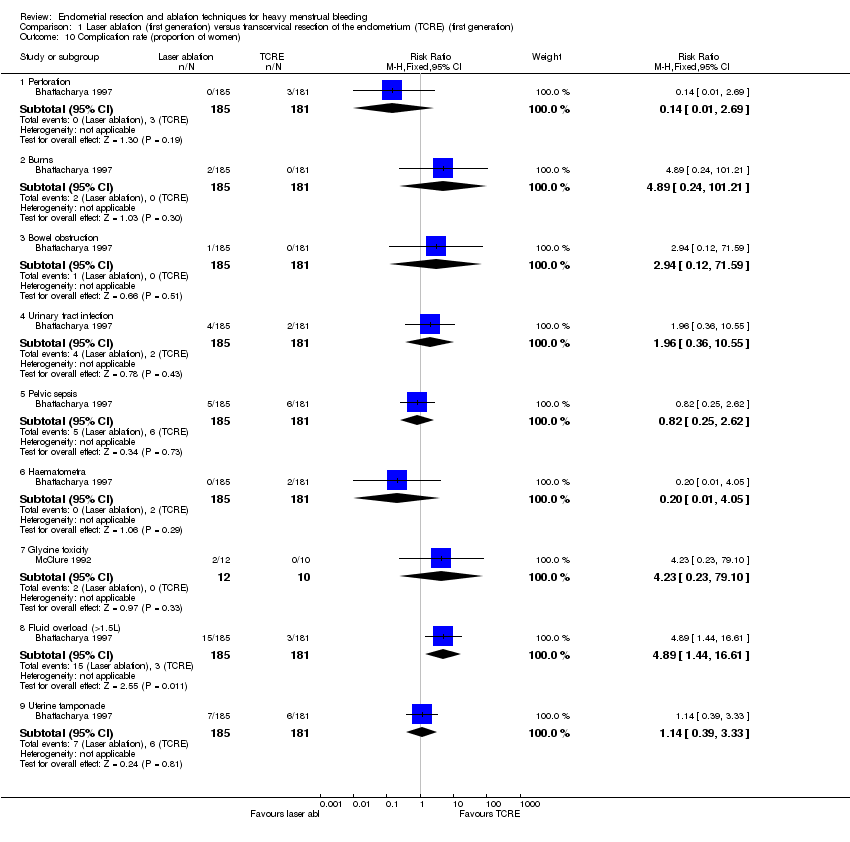
Comparison 1 Laser ablation (first generation) versus transcervical resection of the endometrium (TCRE) (first generation), Outcome 10 Complication rate (proportion of women).
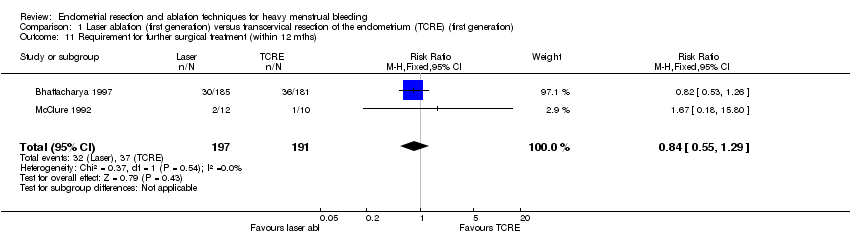
Comparison 1 Laser ablation (first generation) versus transcervical resection of the endometrium (TCRE) (first generation), Outcome 11 Requirement for further surgical treatment (within 12 mths).
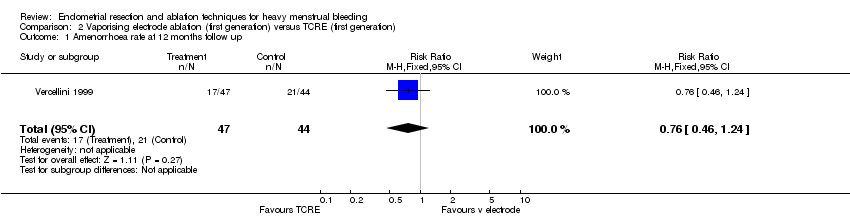
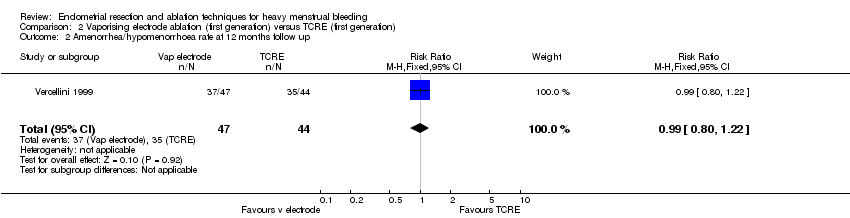
Comparison 2 Vaporising electrode ablation (first generation) versus TCRE (first generation), Outcome 1 Amenorrhoea rate at 12 months follow up.
Comparison 2 Vaporising electrode ablation (first generation) versus TCRE (first generation), Outcome 2 Amenorrhea/hypomenorrhoea rate at 12 months follow up.
| Study | Vaporising electrode | TCRE | Results |
| Vercellini 1999 | N=47 | N=44 | Unpaired t test. |
Comparison 2 Vaporising electrode ablation (first generation) versus TCRE (first generation), Outcome 3 PBAC score at 12 mths.
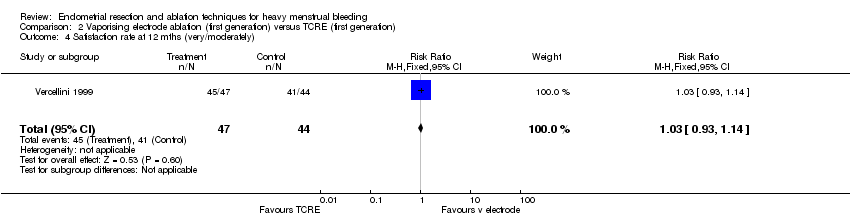
Comparison 2 Vaporising electrode ablation (first generation) versus TCRE (first generation), Outcome 4 Satisfaction rate at 12 mths (very/moderately).

Comparison 2 Vaporising electrode ablation (first generation) versus TCRE (first generation), Outcome 5 Duration of operation (mins).
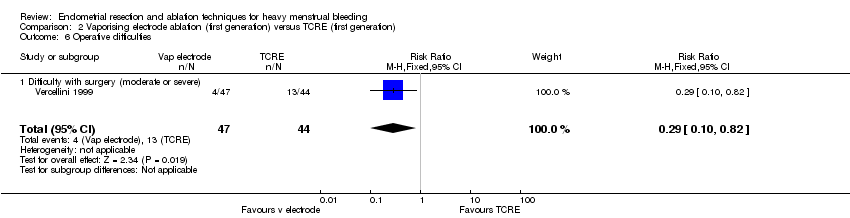
Comparison 2 Vaporising electrode ablation (first generation) versus TCRE (first generation), Outcome 6 Operative difficulties.

Comparison 2 Vaporising electrode ablation (first generation) versus TCRE (first generation), Outcome 7 Degree of fluid deficit (ml).

Comparison 3 Rollerball (first generation) versus TCRE (first generation), Outcome 1 Duration of operation (mins).
| Study | Rollerball | TCRE | Comment |
| Boujida 2002 | N=61 | N=59 | Mann Whitney test: P<0.05 |
Comparison 3 Rollerball (first generation) versus TCRE (first generation), Outcome 2 Duration of operation (descriptive data).
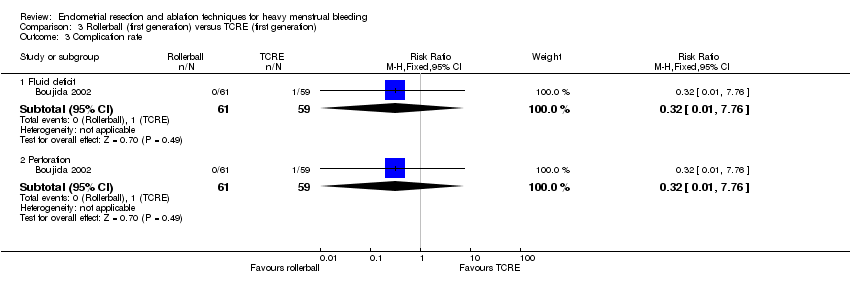
Comparison 3 Rollerball (first generation) versus TCRE (first generation), Outcome 3 Complication rate.
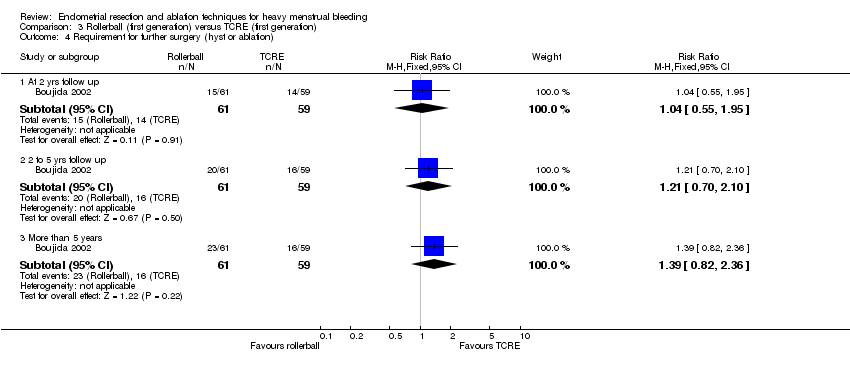
Comparison 3 Rollerball (first generation) versus TCRE (first generation), Outcome 4 Requirement for further surgery (hyst or ablation).

Comparison 3 Rollerball (first generation) versus TCRE (first generation), Outcome 5 Requirement for further surgery rate (hyst only).
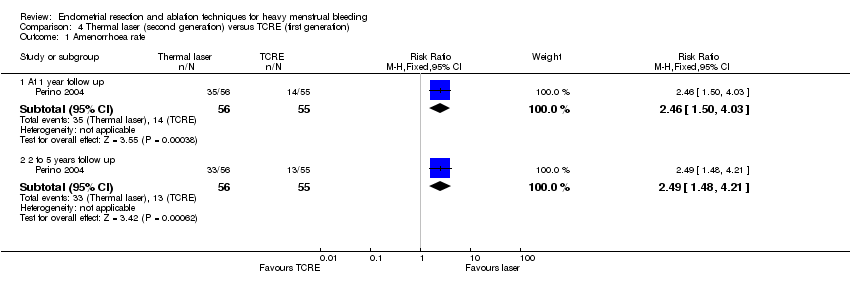
Comparison 4 Thermal laser (second generation) versus TCRE (first generation), Outcome 1 Amenorrhoea rate.

Comparison 4 Thermal laser (second generation) versus TCRE (first generation), Outcome 2 Satisfaction rate.

Comparison 4 Thermal laser (second generation) versus TCRE (first generation), Outcome 3 Duration of operation.

Comparison 4 Thermal laser (second generation) versus TCRE (first generation), Outcome 4 Pain score at 12 hrs after surgery (VAS: 1‐10).

Comparison 4 Thermal laser (second generation) versus TCRE (first generation), Outcome 5 Intraoperative complication rate.
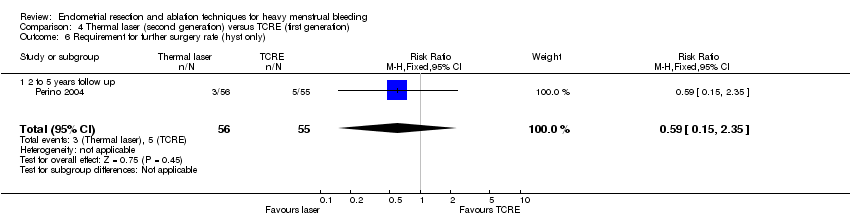
Comparison 4 Thermal laser (second generation) versus TCRE (first generation), Outcome 6 Requirement for further surgery rate (hyst only).
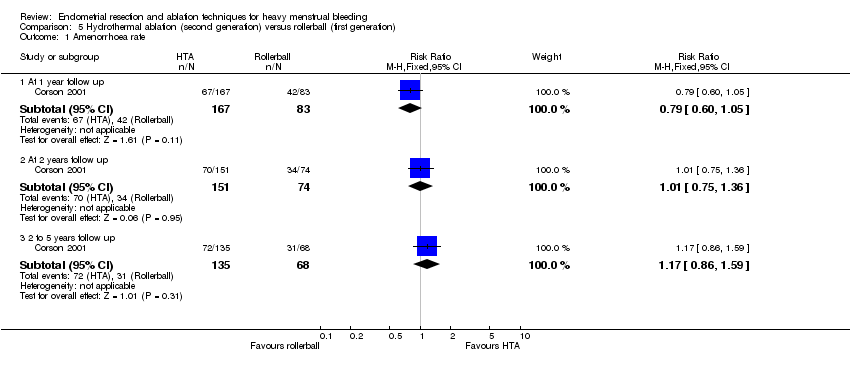
Comparison 5 Hydrothermal ablation (second generation) versus rollerball (first generation), Outcome 1 Amenorrhoea rate.
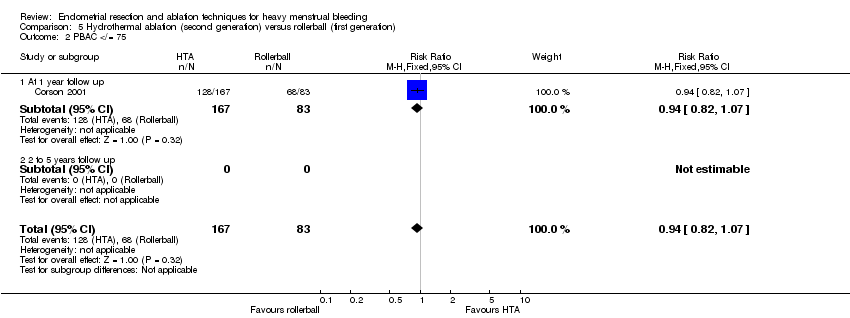
Comparison 5 Hydrothermal ablation (second generation) versus rollerball (first generation), Outcome 2 PBAC </= 75.

Comparison 5 Hydrothermal ablation (second generation) versus rollerball (first generation), Outcome 3 Proportion with "normal" bleeding (PBAC </= 100).

Comparison 5 Hydrothermal ablation (second generation) versus rollerball (first generation), Outcome 4 Satisfaction rate.

Comparison 5 Hydrothermal ablation (second generation) versus rollerball (first generation), Outcome 5 Proportion having local anaesthesia (%).

Comparison 5 Hydrothermal ablation (second generation) versus rollerball (first generation), Outcome 6 Intraoperative complication rate.

Comparison 5 Hydrothermal ablation (second generation) versus rollerball (first generation), Outcome 7 Postoperative complication rate.
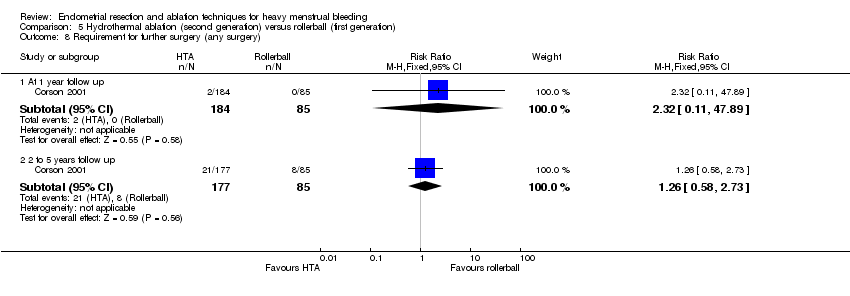
Comparison 5 Hydrothermal ablation (second generation) versus rollerball (first generation), Outcome 8 Requirement for further surgery (any surgery).

Comparison 5 Hydrothermal ablation (second generation) versus rollerball (first generation), Outcome 9 Requirement for further surgery rate (hyst only).

Comparison 6 Cryoablation (second generation) versus rollerball (first generation), Outcome 1 Amenorrhoea rate.
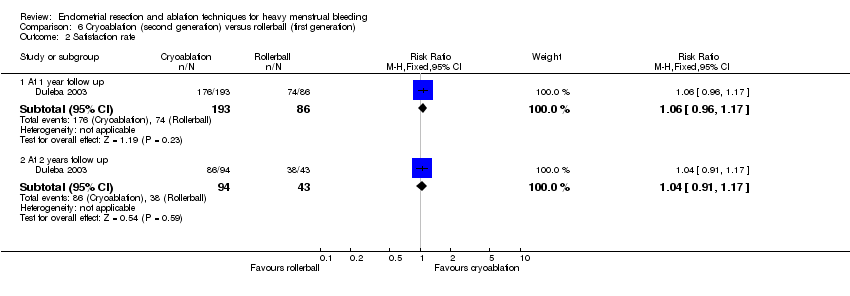
Comparison 6 Cryoablation (second generation) versus rollerball (first generation), Outcome 2 Satisfaction rate.

Comparison 6 Cryoablation (second generation) versus rollerball (first generation), Outcome 3 Proportion having local anaesthesia (%).

Comparison 6 Cryoablation (second generation) versus rollerball (first generation), Outcome 4 Intraoperative complication rate.
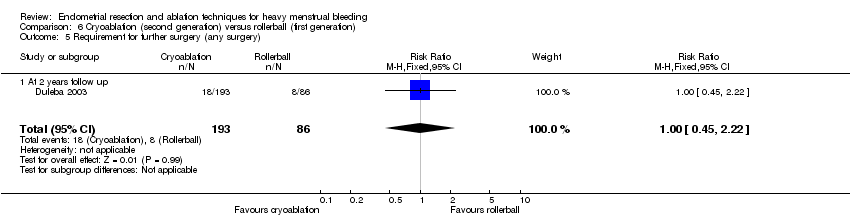
Comparison 6 Cryoablation (second generation) versus rollerball (first generation), Outcome 5 Requirement for further surgery (any surgery).

Comparison 6 Cryoablation (second generation) versus rollerball (first generation), Outcome 6 Requirement for further surgery rate (hyst only).

Comparison 7 Electrode ablation (second generation) versus TCRE + rollerball (first generation), Outcome 1 Amenorrhea rate at 1 yr follow up.
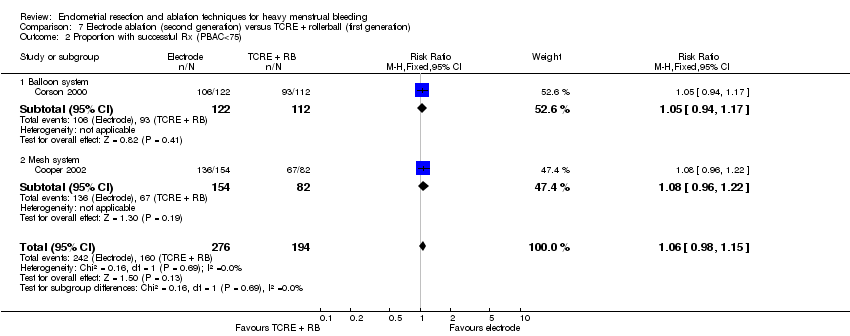
Comparison 7 Electrode ablation (second generation) versus TCRE + rollerball (first generation), Outcome 2 Proportion with successful Rx (PBAC<75).
| Study | Electrode system | TCRE + RB | Stat test for diff |
| Balloon system | |||
| Corson 2000 | N=122 | N=112 | Not significantly different |
| Mesh system | |||
| Cooper 2002 | N=154 | N=82 | No reported difference |
Comparison 7 Electrode ablation (second generation) versus TCRE + rollerball (first generation), Outcome 3 PBAC score 12 months after treatment.
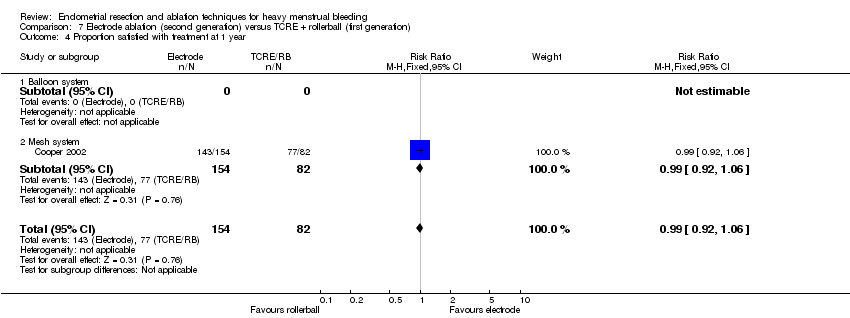
Comparison 7 Electrode ablation (second generation) versus TCRE + rollerball (first generation), Outcome 4 Proportion satisfied with treatment at 1 year.
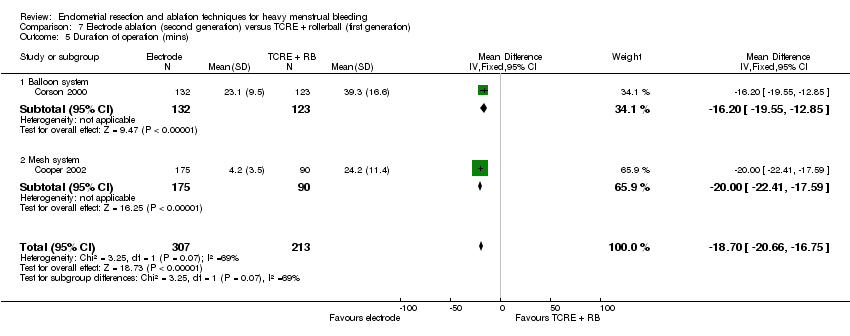
Comparison 7 Electrode ablation (second generation) versus TCRE + rollerball (first generation), Outcome 5 Duration of operation (mins).

Comparison 7 Electrode ablation (second generation) versus TCRE + rollerball (first generation), Outcome 6 Proportion having local anaesthesia (%).

Comparison 7 Electrode ablation (second generation) versus TCRE + rollerball (first generation), Outcome 7 Intraoperative complication rate.
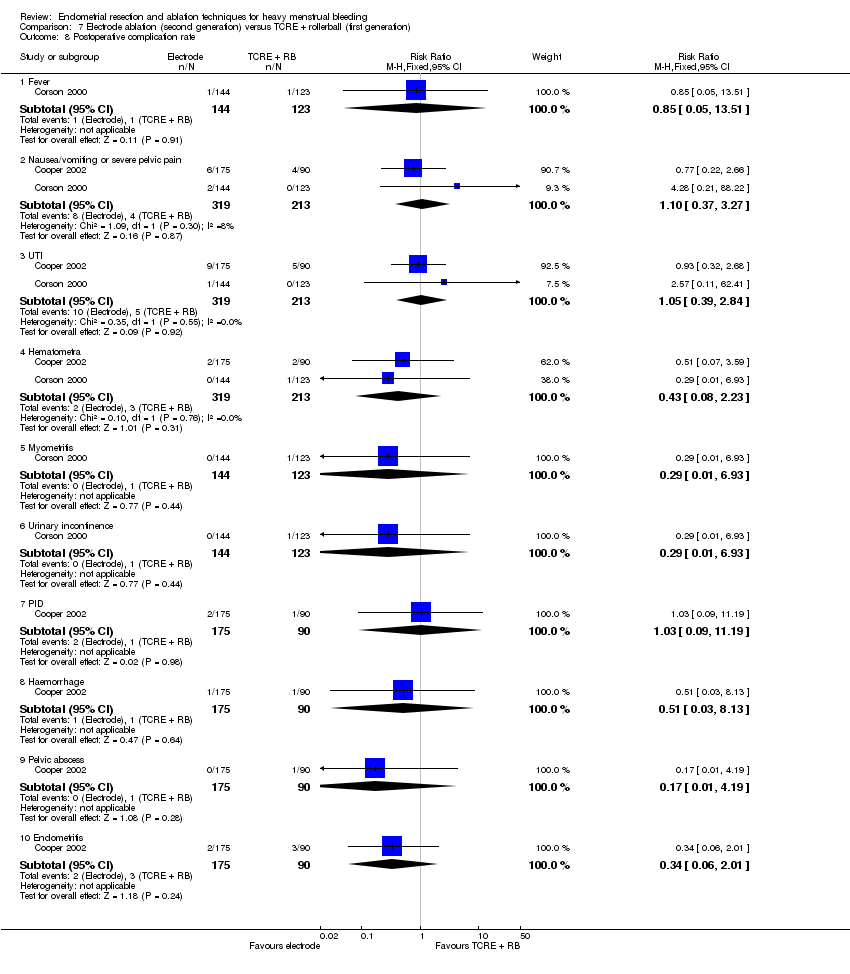
Comparison 7 Electrode ablation (second generation) versus TCRE + rollerball (first generation), Outcome 8 Postoperative complication rate.

Comparison 7 Electrode ablation (second generation) versus TCRE + rollerball (first generation), Outcome 9 Requirement for further surgery at 2 years (hysterectomy).
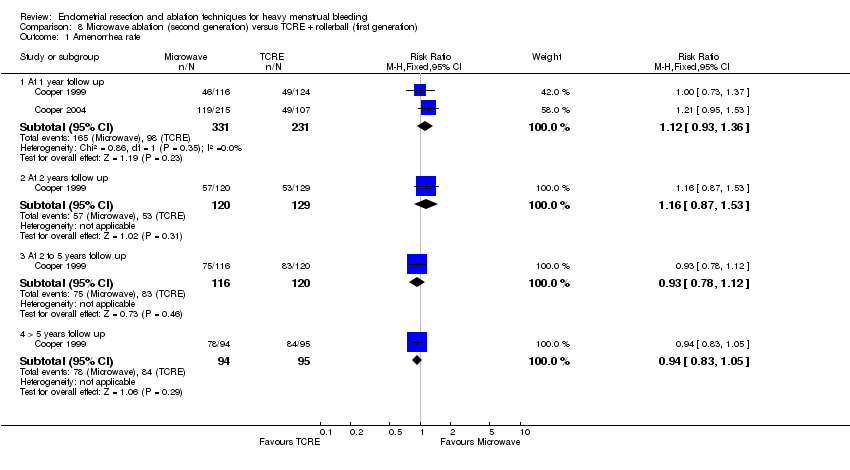
Comparison 8 Microwave ablation (second generation) versus TCRE + rollerball (first generation), Outcome 1 Amenorrhea rate.

Comparison 8 Microwave ablation (second generation) versus TCRE + rollerball (first generation), Outcome 2 Success of treatment (PBAC<75 or acceptable improvement).

Comparison 8 Microwave ablation (second generation) versus TCRE + rollerball (first generation), Outcome 3 Satisfaction rate.
| Study | Microwave | TCRE | Results |
| Cooper 1999 | N=129 | N=134 | Mann Whitney U test |
Comparison 8 Microwave ablation (second generation) versus TCRE + rollerball (first generation), Outcome 4 Duration of operation (mins).

Comparison 8 Microwave ablation (second generation) versus TCRE + rollerball (first generation), Outcome 5 Operative difficulties.
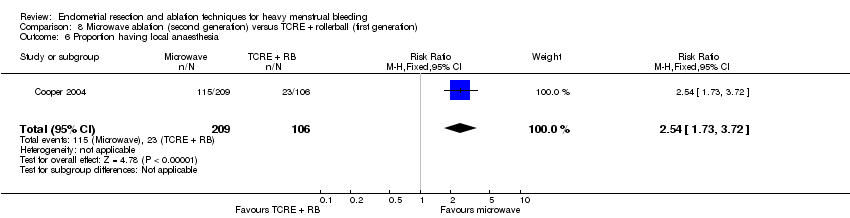
Comparison 8 Microwave ablation (second generation) versus TCRE + rollerball (first generation), Outcome 6 Proportion having local anaesthesia.
| Study | Microwave | TCRE | Results |
| Cooper 1999 | N=129 | N=134 | Mann Whitney U test |
Comparison 8 Microwave ablation (second generation) versus TCRE + rollerball (first generation), Outcome 7 Duration of hospital stay (hours).
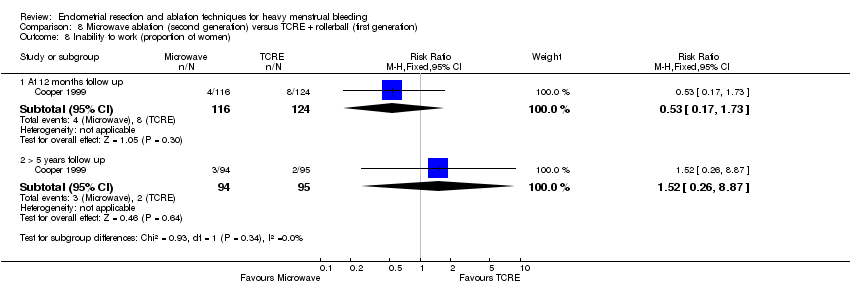
Comparison 8 Microwave ablation (second generation) versus TCRE + rollerball (first generation), Outcome 8 Inability to work (proportion of women).
| Study | MEA | TCRE | Results |
| Physical functioning | |||
| Cooper 1999 | AT 1 YEAR: At 10 YEARS: N=94 Mean change (SD): ‐4.4 (27) | AT 1 YEAR: At 10 YEARS: N=95 Mean change (SD): ‐3.0 (25) | AT 1 YEAR: At 10 YEARS: t test: NS (95% CI ‐8.9 to 6.1) |
| Social functioning | |||
| Cooper 1999 | AT 1 YEAR: At 10 YEARS: N=94 Mean change (SD): 10.1 (30) | At 1 YEAR: N=124 At 10 YEARS: N=95 Mean change (SD): 9.9 (26) | AT 1 YEAR: At 10 YEARS: t test: NS (95% CI ‐7.9 to 8.3) |
| Physical role | |||
| Cooper 1999 | AT 1 YEAR: At 10 YEARS: N=94 Mean change (SD): 15.0 (53) | AT 1 YEAR: At 10 YEARS: N=95 Mean change (SD): 10.9 (47) | AT 1 YEAR: At 10 YEARS: t test: NS, 95% CI ‐10.3 to 18.5 |
| Emotional role | |||
| Cooper 1999 | AT ONE YEAR: At 10 YEARS: N=94 Mean change (SD): 21.1 (50) | AT 1 YEAR: N=120 At 10 YEARS: N=95 Mean change (SD): 13.5 (47) | AT 1 YEAR: At 10 YEARS: t test: NS, 95% CI 6.3 to 21.5 |
| Mental health | |||
| Cooper 1999 | AT 1 YEAR: At 10 YEARS: N=94 Mean change (SD): 7.2 (21) | AT 1 YEAR: N=120 At 10 YEARS: N=95 Mean change (SD): 7.9 (25) | AT 1 YEAR: At 10 YEARS: t test: NS, 95% CI ‐7.3 to 5.9 |
| Energy/fatigue | |||
| Cooper 1999 | AT 1 YEAR: N=116 At 10 YEARS: N=94 Mean change (SD): 12.9 (29) | AT 1 YEAR: N=120 At 10 YEARS: N=95 Mean change (SD): 15.3 (27) | AT 1 YEAR: At 10 YEARS: t test: NS, 95% CI ‐10.4 to 5.6 |
| Pain | |||
| Cooper 1999 | AT 1 YEAR: N=116 At 10 YEARS: N=94 Mean change (SD): 11.6 (37) | AT 1 YEAR: N=120 At 10 YEARS: N=95 Mean change (SD): 12.3 (35) | AT 1 YEAR: At 10 YEARS: t test: NS, 95% CI ‐11.0 to 9.6 |
| General health | |||
| Cooper 1999 | AT 1 YEAR: N=116 At 10 YEARS: N=94 Mean change (SD): 0.94 (23) | AT 1 YEAR: N=120 At 10 YEARS: N=95 Mean change (SD): 2.8 (22) | AT 1 YEAR: At 10 YEARS: t test: NS, 95% CI ‐8.3 to 4.6 |
Comparison 8 Microwave ablation (second generation) versus TCRE + rollerball (first generation), Outcome 9 Change in SF36 score after treatment.

Comparison 8 Microwave ablation (second generation) versus TCRE + rollerball (first generation), Outcome 10 Improvement in symptoms.

Comparison 8 Microwave ablation (second generation) versus TCRE + rollerball (first generation), Outcome 11 Improvement in dysmenorrhoea.
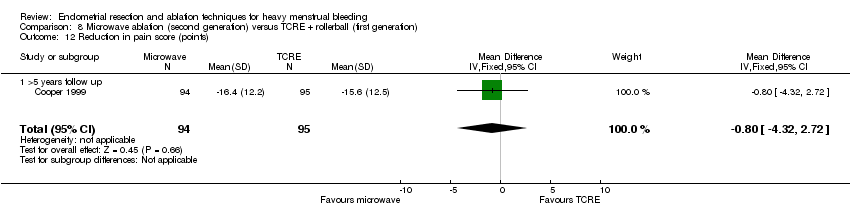
Comparison 8 Microwave ablation (second generation) versus TCRE + rollerball (first generation), Outcome 12 Reduction in pain score (points).

Comparison 8 Microwave ablation (second generation) versus TCRE + rollerball (first generation), Outcome 13 Postoperative analgesia rate.

Comparison 8 Microwave ablation (second generation) versus TCRE + rollerball (first generation), Outcome 14 Intraoperative complication rate.

Comparison 8 Microwave ablation (second generation) versus TCRE + rollerball (first generation), Outcome 15 Postoperative complication rate (wihin 24 hours).
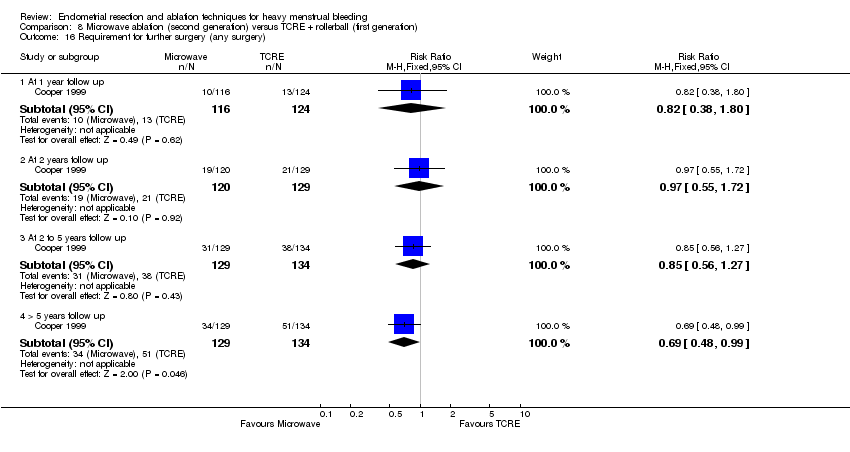
Comparison 8 Microwave ablation (second generation) versus TCRE + rollerball (first generation), Outcome 16 Requirement for further surgery (any surgery).
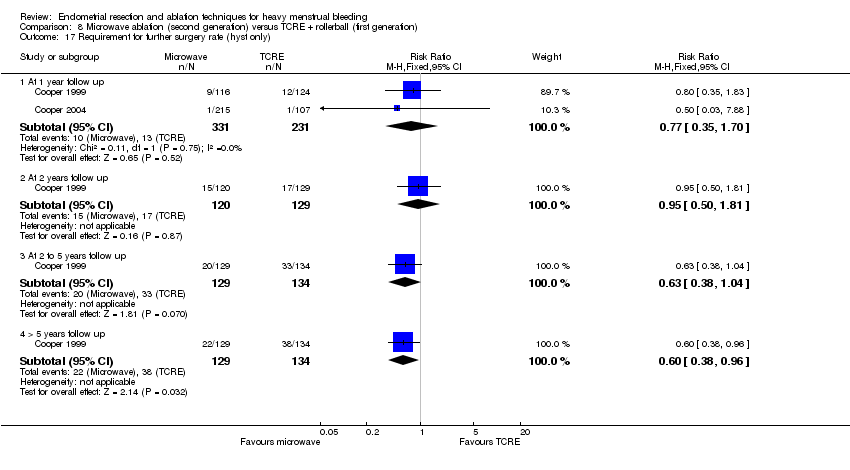
Comparison 8 Microwave ablation (second generation) versus TCRE + rollerball (first generation), Outcome 17 Requirement for further surgery rate (hyst only).

Comparison 9 Balloon endometrial ablation (second generation) versus rollerball endometrial ablation (first generation), Outcome 1 Amenorrhea rate.

Comparison 9 Balloon endometrial ablation (second generation) versus rollerball endometrial ablation (first generation), Outcome 2 Amenorrhoea/eumenorrhoea rate.
| Study | Balloon | Rollerball | Results |
| At 1 year follow up | |||
| Meyer 1998 | N=125 | N=114 | No statistical test performed of these outcomes |
| Soysal 2001 | N=41 | N=44 | Significance not reported |
| van Zon‐Rabelink 2003 | N=74 | N=55 | Wilcoxon test: |
| At 2 years follow up | |||
| van Zon‐Rabelink 2003 | N=66 | N=55 | Wilcoxon test: P=0.01 |
Comparison 9 Balloon endometrial ablation (second generation) versus rollerball endometrial ablation (first generation), Outcome 3 PBAC score after treatment.
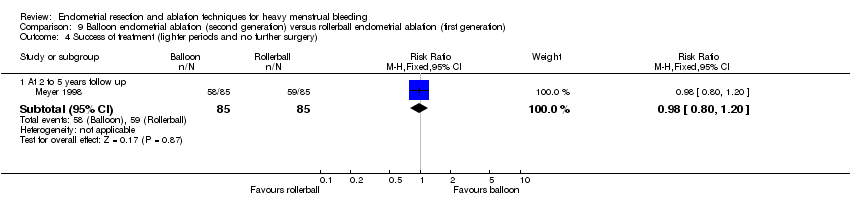
Comparison 9 Balloon endometrial ablation (second generation) versus rollerball endometrial ablation (first generation), Outcome 4 Success of treatment (lighter periods and no further surgery).
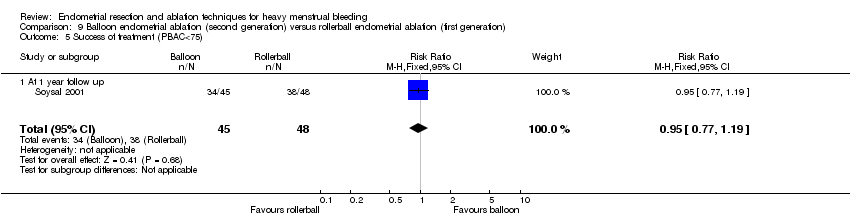
Comparison 9 Balloon endometrial ablation (second generation) versus rollerball endometrial ablation (first generation), Outcome 5 Success of treatment (PBAC<75).
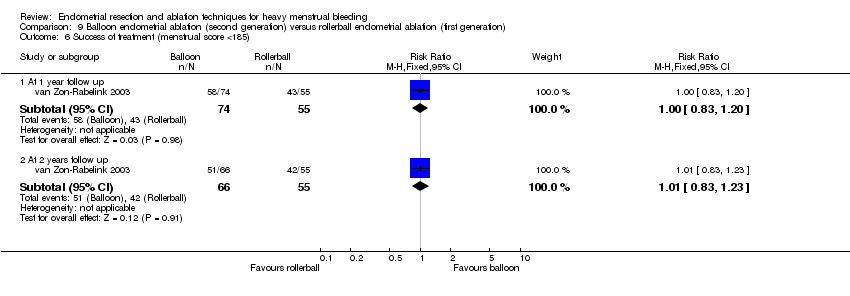
Comparison 9 Balloon endometrial ablation (second generation) versus rollerball endometrial ablation (first generation), Outcome 6 Success of treatment (menstrual score <185).
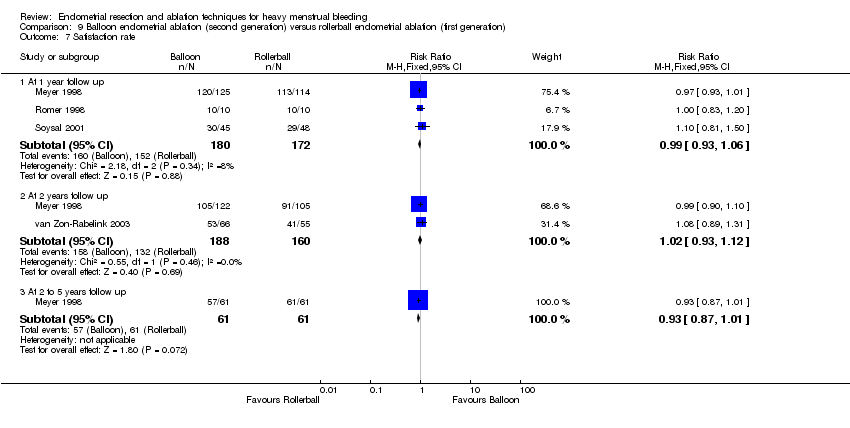
Comparison 9 Balloon endometrial ablation (second generation) versus rollerball endometrial ablation (first generation), Outcome 7 Satisfaction rate.

Comparison 9 Balloon endometrial ablation (second generation) versus rollerball endometrial ablation (first generation), Outcome 8 Duration of operation (mins).

Comparison 9 Balloon endometrial ablation (second generation) versus rollerball endometrial ablation (first generation), Outcome 9 Operative difficulties.

Comparison 9 Balloon endometrial ablation (second generation) versus rollerball endometrial ablation (first generation), Outcome 10 Inability to work (proportion of women).
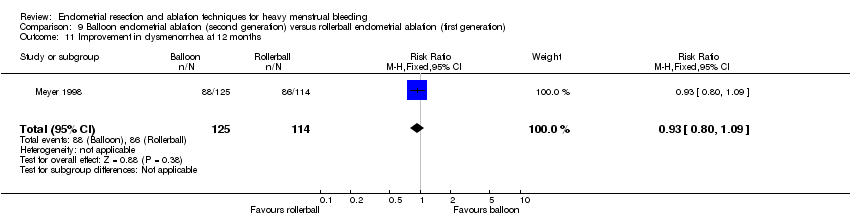
Comparison 9 Balloon endometrial ablation (second generation) versus rollerball endometrial ablation (first generation), Outcome 11 Improvement in dysmenorrhea at 12 months.

Comparison 9 Balloon endometrial ablation (second generation) versus rollerball endometrial ablation (first generation), Outcome 12 Improvement in premenstrual symptoms (from moderate/severe).
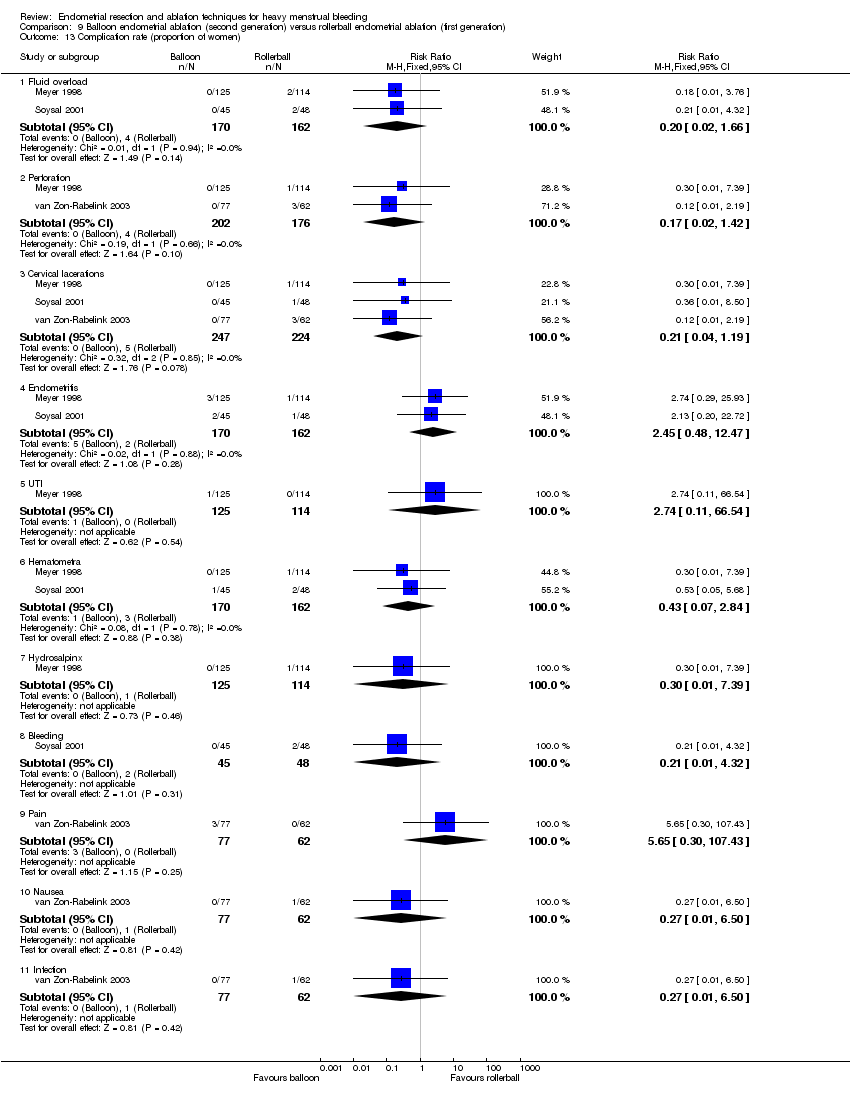
Comparison 9 Balloon endometrial ablation (second generation) versus rollerball endometrial ablation (first generation), Outcome 13 Complication rate (proportion of women).
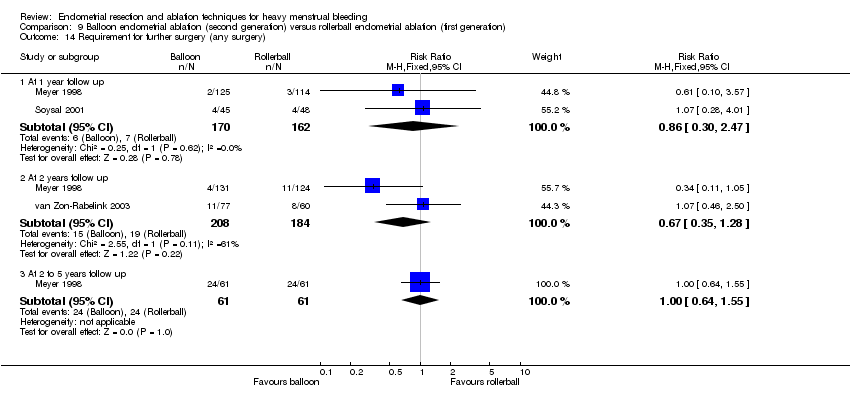
Comparison 9 Balloon endometrial ablation (second generation) versus rollerball endometrial ablation (first generation), Outcome 14 Requirement for further surgery (any surgery).

Comparison 9 Balloon endometrial ablation (second generation) versus rollerball endometrial ablation (first generation), Outcome 15 Requirement for further surgery (hyst only).
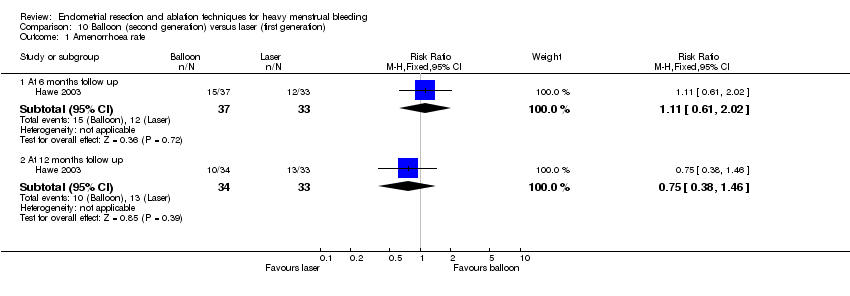
Comparison 10 Balloon (second generation) versus laser (first generation), Outcome 1 Amenorrhoea rate.
| Study | Balloon | Laser | Statistical test |
| At 6 months follow up | |||
| Hawe 2003 | N=37 | N=33 | Significance not reported |
Comparison 10 Balloon (second generation) versus laser (first generation), Outcome 2 PBAC score after treatment.

Comparison 10 Balloon (second generation) versus laser (first generation), Outcome 3 Satisfaction rate.

Comparison 10 Balloon (second generation) versus laser (first generation), Outcome 4 Operative difficulties.

Comparison 10 Balloon (second generation) versus laser (first generation), Outcome 5 Euroquol 5D.

Comparison 10 Balloon (second generation) versus laser (first generation), Outcome 6 Euroquol 5D VAS.
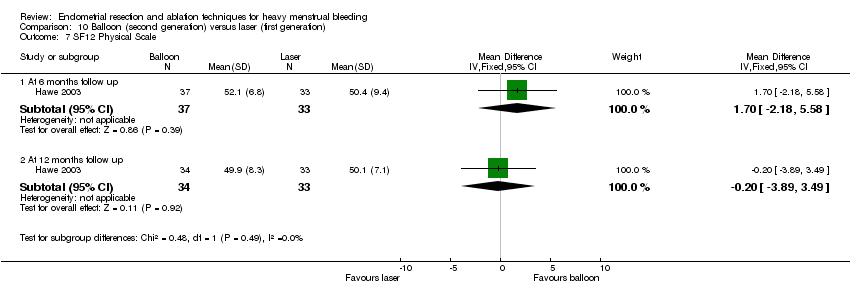
Comparison 10 Balloon (second generation) versus laser (first generation), Outcome 7 SF12 Physical Scale.
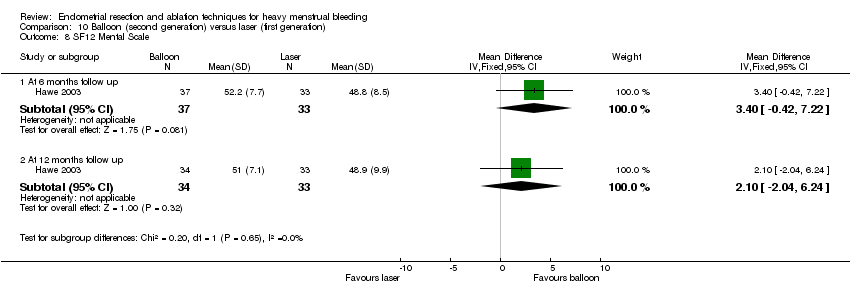
Comparison 10 Balloon (second generation) versus laser (first generation), Outcome 8 SF12 Mental Scale.

Comparison 10 Balloon (second generation) versus laser (first generation), Outcome 9 SAQ pleasure scale.
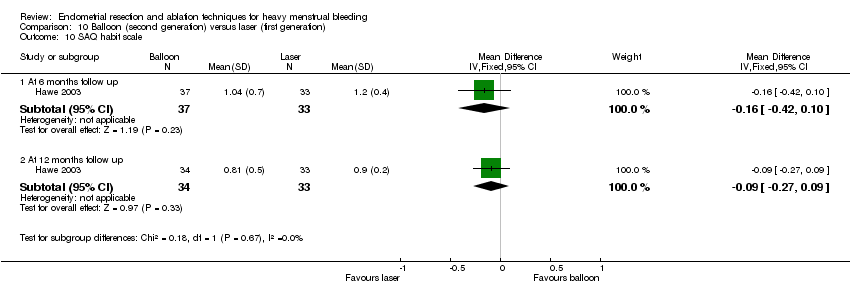
Comparison 10 Balloon (second generation) versus laser (first generation), Outcome 10 SAQ habit scale.

Comparison 10 Balloon (second generation) versus laser (first generation), Outcome 11 SAQ discomfort scale.
| Study | Balloon | Laser | Statistical test |
| At 6 months follow up | |||
| Hawe 2003 | N=37 | N=33 | Not reported |
| At 12 months follow up | |||
| Hawe 2003 | N=34 | N=33 | Not reported |
Comparison 10 Balloon (second generation) versus laser (first generation), Outcome 12 PMS (visual analogue).
| Study | Balloon | Laser | Statistical test |
| At 6 months follow up | |||
| Hawe 2003 | N=37 | N=33 | Not reported |
| At 12 months follow up | |||
| Hawe 2003 | N=34 | N=33 | Not reported |
Comparison 10 Balloon (second generation) versus laser (first generation), Outcome 13 Dysmenorrhoea (visual analogue).

Comparison 10 Balloon (second generation) versus laser (first generation), Outcome 14 Pain score.
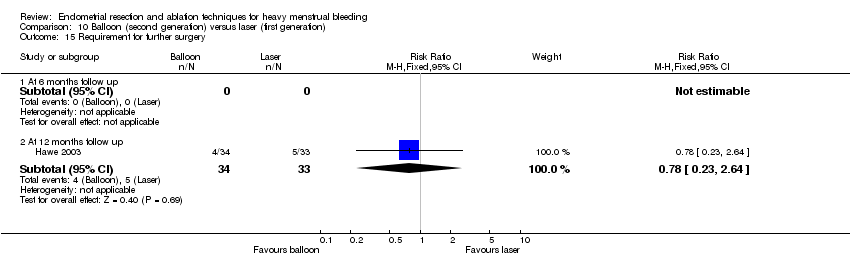
Comparison 10 Balloon (second generation) versus laser (first generation), Outcome 15 Requirement for further surgery.
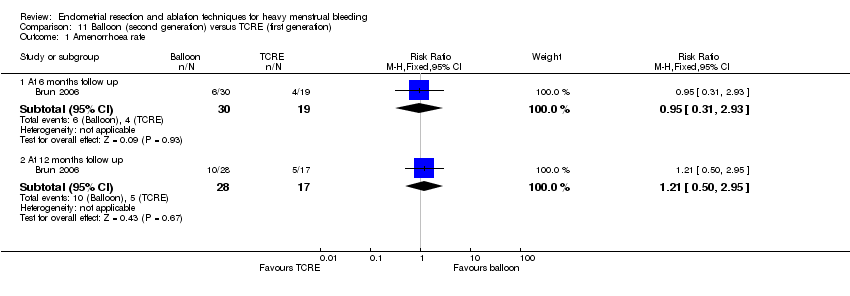
Comparison 11 Balloon (second generation) versus TCRE (first generation), Outcome 1 Amenorrhoea rate.

Comparison 11 Balloon (second generation) versus TCRE (first generation), Outcome 2 Satisfaction rate.
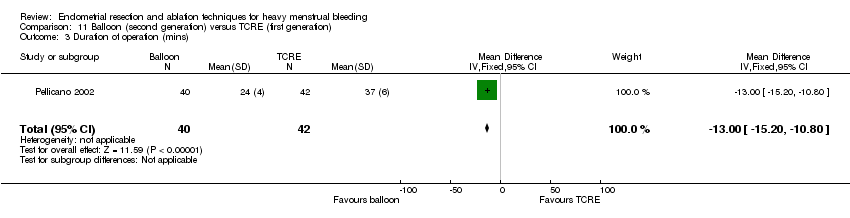
Comparison 11 Balloon (second generation) versus TCRE (first generation), Outcome 3 Duration of operation (mins).
| Study | Cavaterm balloon | TCRE | Comments |
| Brun 2006 | n=31 Median (range): 48 (24‐150) | n=20 Median (range): 45 (23‐105) | No statistical test reported ‐ unlikely to be a difference |
Comparison 11 Balloon (second generation) versus TCRE (first generation), Outcome 4 Duration of operation (mins).
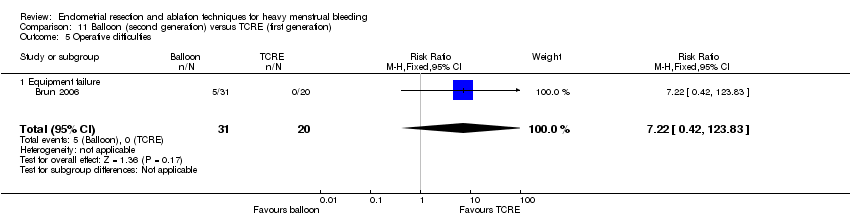
Comparison 11 Balloon (second generation) versus TCRE (first generation), Outcome 5 Operative difficulties.

Comparison 11 Balloon (second generation) versus TCRE (first generation), Outcome 6 Hospital stay (days).
| Study | Cavaterm balloon | TCRE | Comments |
| Brun 2006 | n=31 Median (range): 21 (0‐36) | n=20 Median (range): 30 (6‐72) | Mann Whitney rank sum test P=0.012 |
Comparison 11 Balloon (second generation) versus TCRE (first generation), Outcome 7 Duration of hospital stay (hours).

Comparison 11 Balloon (second generation) versus TCRE (first generation), Outcome 8 Return to normal activities (days).
| Study | Cavaterm balloon | TCRE | Comments |
| Brun 2006 | n=31 Median (range): 4 (1‐20) | n=20 Median (range): 2 (1‐30) | Mann Whitney rank test ‐ not significantly different |
Comparison 11 Balloon (second generation) versus TCRE (first generation), Outcome 9 Return to normal activities (days).

Comparison 11 Balloon (second generation) versus TCRE (first generation), Outcome 10 Intraoperative complications (continuous data).

Comparison 11 Balloon (second generation) versus TCRE (first generation), Outcome 11 Intraoperative complications (dichotomous data).

Comparison 11 Balloon (second generation) versus TCRE (first generation), Outcome 12 Postoperative pain (continuous data).
| Study | Cavaterm balloon | TCRE | Comments |
| Brun 2006 | n=31 Pain score (VAS scale 0‐100): median (range): 45 (1‐100) | n=20 Pain score (VAS scale 0‐100): median (range): 10 (0‐90) | Mann Whitney rank sum test: P=0.012 |
Comparison 11 Balloon (second generation) versus TCRE (first generation), Outcome 13 Postoperative pain (descriptive data).

Comparison 11 Balloon (second generation) versus TCRE (first generation), Outcome 14 Postoperative complications.
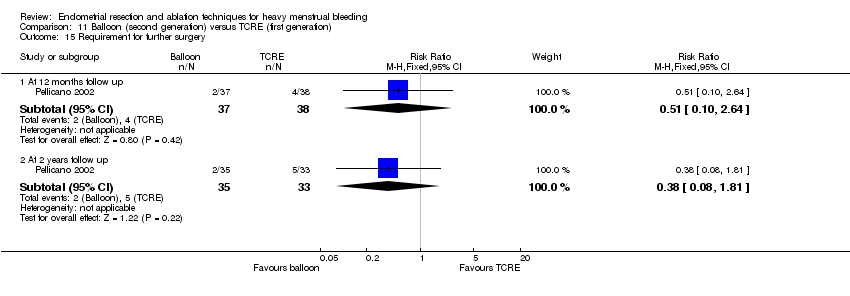
Comparison 11 Balloon (second generation) versus TCRE (first generation), Outcome 15 Requirement for further surgery.

Comparison 11 Balloon (second generation) versus TCRE (first generation), Outcome 16 Requirement for further surgery (hyst only).

Comparison 12 Bipolar radiofrequency (second generation) versus balloon ablation (second generation), Outcome 1 Amenorrhoea rate.
| Study | Electrode | Balloon | Statistical test |
| At 12 months follow up | |||
| Abbott 2003 | N=37 | N=18 | Mann Whitney |
Comparison 12 Bipolar radiofrequency (second generation) versus balloon ablation (second generation), Outcome 2 PBAC score after treatment.

Comparison 12 Bipolar radiofrequency (second generation) versus balloon ablation (second generation), Outcome 3 Satisfaction rate.
| Study | Electrode | Balloon | Statistical test |
| Abbott 2003 | N=37 | N=18 | t test |
| Bongers 2004 | N=82 | N=43 | Not reported |
| Clark 2011 | N=42 Mean time in mins (SD): 5.7 (2.1) | N=39 Mean time in mins (SD): 12.5 (2.3) | MD=6.7 mins (95% CI 5.8 to 7.7); p<0.001 Note: this is an office procedure in both arms) |
Comparison 12 Bipolar radiofrequency (second generation) versus balloon ablation (second generation), Outcome 4 Duration of operation.

Comparison 12 Bipolar radiofrequency (second generation) versus balloon ablation (second generation), Outcome 5 Operative difficulties.
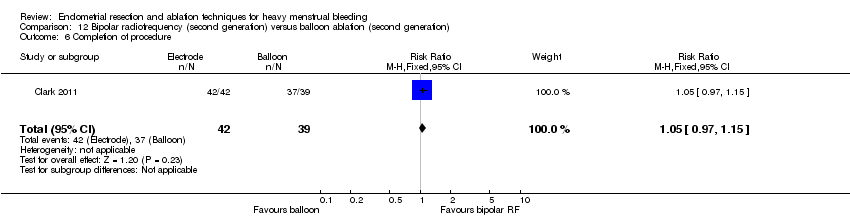
Comparison 12 Bipolar radiofrequency (second generation) versus balloon ablation (second generation), Outcome 6 Completion of procedure.
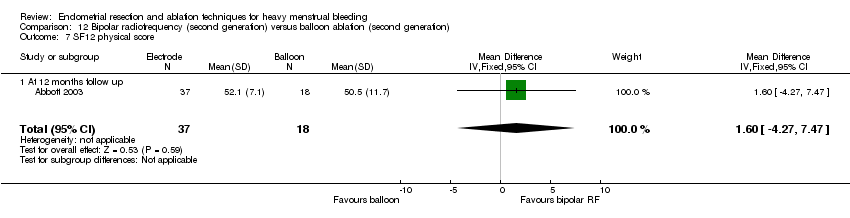
Comparison 12 Bipolar radiofrequency (second generation) versus balloon ablation (second generation), Outcome 7 SF12 physical score.
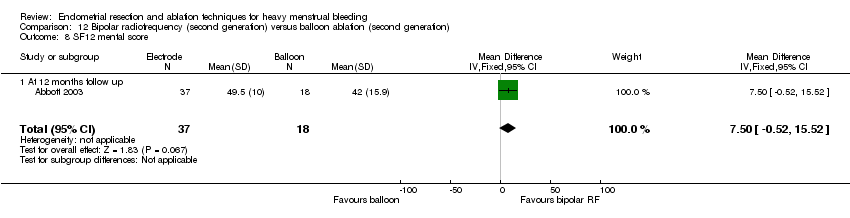
Comparison 12 Bipolar radiofrequency (second generation) versus balloon ablation (second generation), Outcome 8 SF12 mental score.
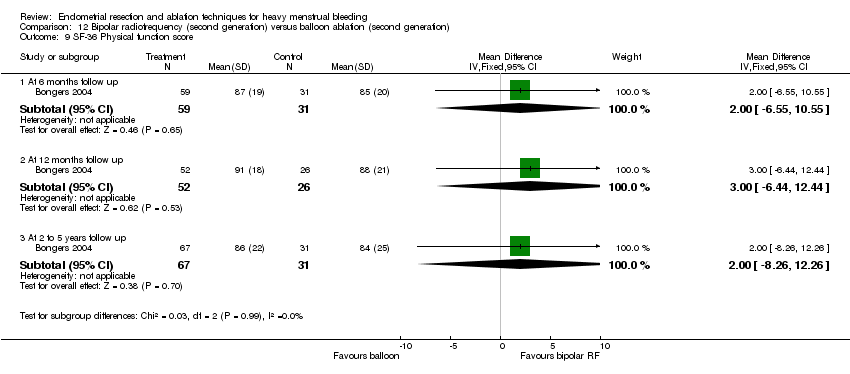
Comparison 12 Bipolar radiofrequency (second generation) versus balloon ablation (second generation), Outcome 9 SF‐36 Physical function score.

Comparison 12 Bipolar radiofrequency (second generation) versus balloon ablation (second generation), Outcome 10 SF‐36 Role physical.
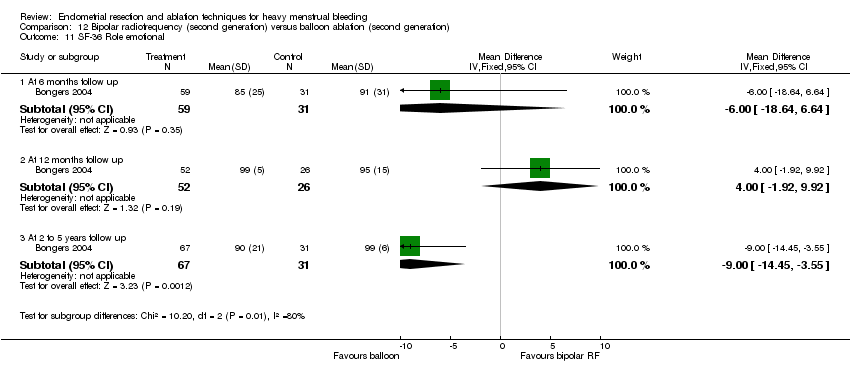
Comparison 12 Bipolar radiofrequency (second generation) versus balloon ablation (second generation), Outcome 11 SF‐36 Role emotional.
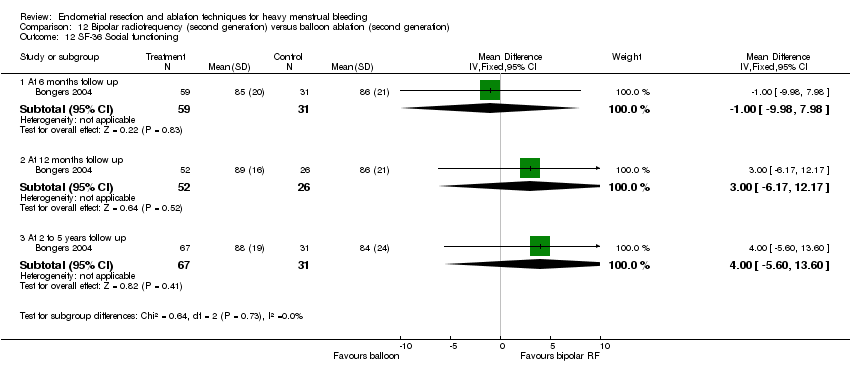
Comparison 12 Bipolar radiofrequency (second generation) versus balloon ablation (second generation), Outcome 12 SF‐36 Social functioning.
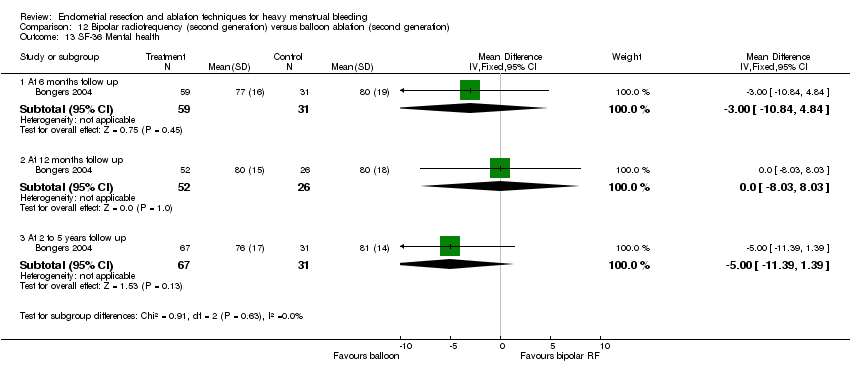
Comparison 12 Bipolar radiofrequency (second generation) versus balloon ablation (second generation), Outcome 13 SF‐36 Mental health.
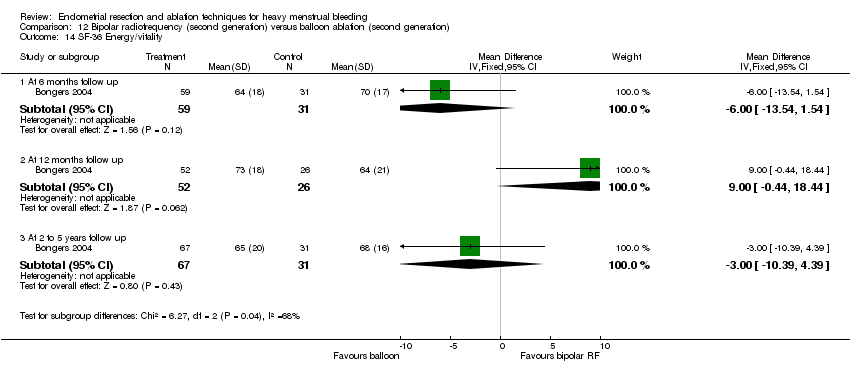
Comparison 12 Bipolar radiofrequency (second generation) versus balloon ablation (second generation), Outcome 14 SF‐36 Energy/vitality.

Comparison 12 Bipolar radiofrequency (second generation) versus balloon ablation (second generation), Outcome 15 SF‐36 Pain.

Comparison 12 Bipolar radiofrequency (second generation) versus balloon ablation (second generation), Outcome 16 SF‐36 General health.
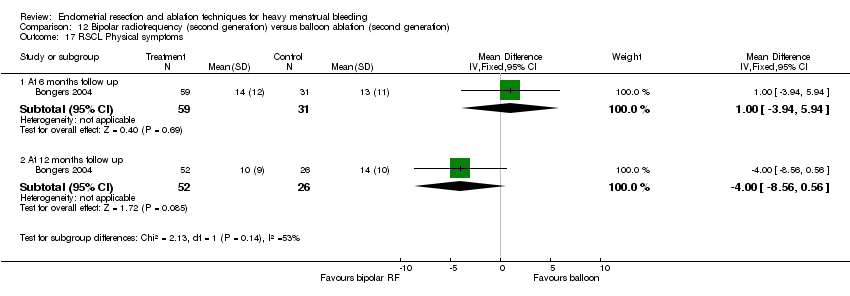
Comparison 12 Bipolar radiofrequency (second generation) versus balloon ablation (second generation), Outcome 17 RSCL Physical symptoms.

Comparison 12 Bipolar radiofrequency (second generation) versus balloon ablation (second generation), Outcome 18 RSCL Psychological distress.

Comparison 12 Bipolar radiofrequency (second generation) versus balloon ablation (second generation), Outcome 19 RSCL Activity level.

Comparison 12 Bipolar radiofrequency (second generation) versus balloon ablation (second generation), Outcome 20 RSCL Overall quality of life.

Comparison 12 Bipolar radiofrequency (second generation) versus balloon ablation (second generation), Outcome 21 SDS Depression.

Comparison 12 Bipolar radiofrequency (second generation) versus balloon ablation (second generation), Outcome 22 Multi‐attribute utility tool.
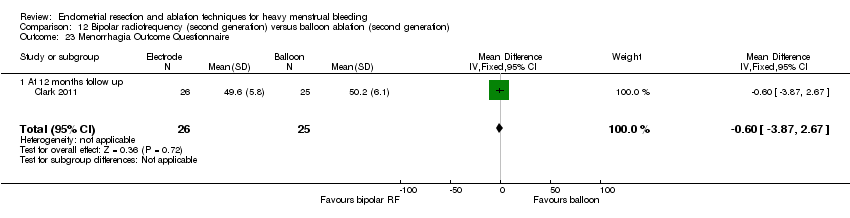
Comparison 12 Bipolar radiofrequency (second generation) versus balloon ablation (second generation), Outcome 23 Menorrhagia Outcome Questionnaire.

Comparison 12 Bipolar radiofrequency (second generation) versus balloon ablation (second generation), Outcome 24 EQ 5‐D utility.
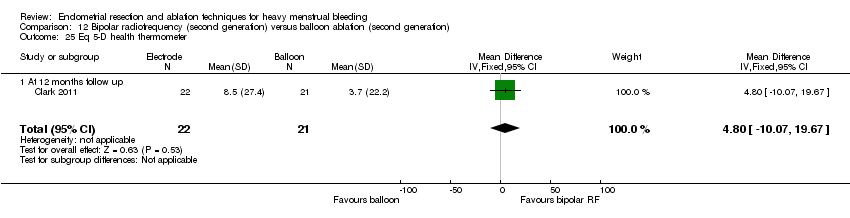
Comparison 12 Bipolar radiofrequency (second generation) versus balloon ablation (second generation), Outcome 25 Eq 5‐D health thermometer.
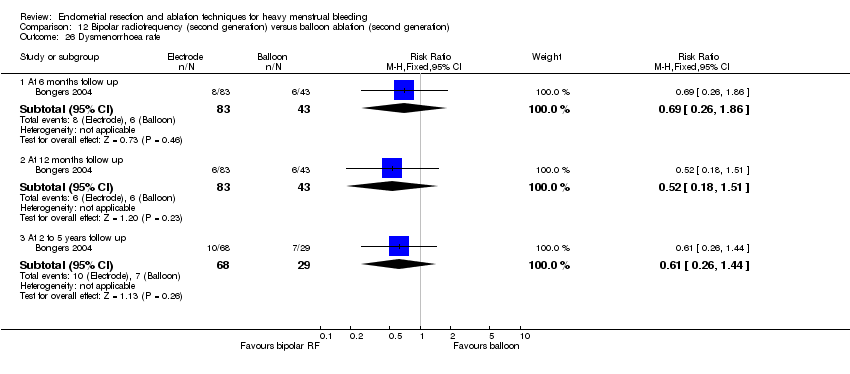
Comparison 12 Bipolar radiofrequency (second generation) versus balloon ablation (second generation), Outcome 26 Dysmenorrhoea rate.
| Study | Electrode | Balloon | Statistical test |
| At 12 months follow up | |||
| Abbott 2003 | N=37 | N=18 | Mann Whitney |
Comparison 12 Bipolar radiofrequency (second generation) versus balloon ablation (second generation), Outcome 27 Dysmenorrhoea rate (VAS score).

Comparison 12 Bipolar radiofrequency (second generation) versus balloon ablation (second generation), Outcome 28 Improvement in dysmenorrhoea.
| Study | Electrode | Balloon | Statistical test |
| At 12 months follow up | |||
| Abbott 2003 | N=37 | N=18 | Mann Whitney |
Comparison 12 Bipolar radiofrequency (second generation) versus balloon ablation (second generation), Outcome 29 PMS rate (VAS score).

Comparison 12 Bipolar radiofrequency (second generation) versus balloon ablation (second generation), Outcome 30 Improvement in PMS (emotional).

Comparison 12 Bipolar radiofrequency (second generation) versus balloon ablation (second generation), Outcome 31 Improvement in PMS (physical).
| Study | Bipolar RF ablation | Thermal ablation | Results |
| Clark 2011 | N=42 Mean: 6.4 days | N=39 Mean: 6.6 days | No significant difference between groups: 0.2 days difference (95% CI ‐5.9 to 6.2) |
Comparison 12 Bipolar radiofrequency (second generation) versus balloon ablation (second generation), Outcome 32 Time taken off work (days).
| Study | Bipolar RF ablation | Balloon ablation | Results |
| Clark 2011 | N=42 Mean (days): 4.9 | N=39 Mean (days): 8.1 | No significant difference between groups: 3.2 days difference (95% CI ‐1.6 to 8.1) |
Comparison 12 Bipolar radiofrequency (second generation) versus balloon ablation (second generation), Outcome 33 Time to resume normal activities (days).

Comparison 12 Bipolar radiofrequency (second generation) versus balloon ablation (second generation), Outcome 34 Postoperative complication rate.

Comparison 12 Bipolar radiofrequency (second generation) versus balloon ablation (second generation), Outcome 35 Requirement for further surgery (ablation or hyst).

Comparison 12 Bipolar radiofrequency (second generation) versus balloon ablation (second generation), Outcome 36 Requirement for further surgery (hyst only).
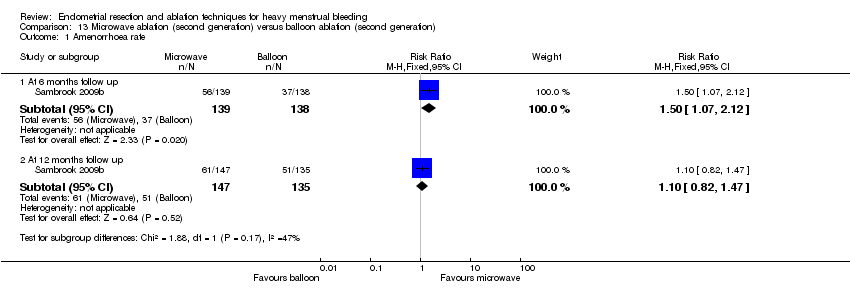
Comparison 13 Microwave ablation (second generation) versus balloon ablation (second generation), Outcome 1 Amenorrhoea rate.
| Study | Follow up | Microwave ablation | Balloon ablation | Results |
| Sambrook 2009b | 12 months | N=143 Mean PBAC score (interquartile range): 3.0 (0.0 to 14.0) | N=135 Mean PBAC score (interquartile range): 4.0 (0.0 to 14.0) | Incidence rate ratio (95% CI): 0.91 (0.6 to 1.5) |
Comparison 13 Microwave ablation (second generation) versus balloon ablation (second generation), Outcome 2 PBAC score at 12 months follow up.

Comparison 13 Microwave ablation (second generation) versus balloon ablation (second generation), Outcome 3 Satisfaction at 12 months follow up.

Comparison 13 Microwave ablation (second generation) versus balloon ablation (second generation), Outcome 4 Operative difficulties causing failure.
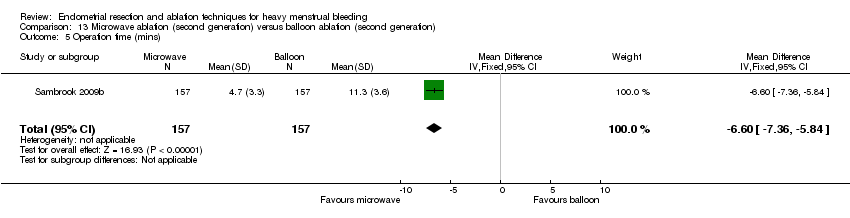
Comparison 13 Microwave ablation (second generation) versus balloon ablation (second generation), Outcome 5 Operation time (mins).

Comparison 13 Microwave ablation (second generation) versus balloon ablation (second generation), Outcome 6 Proportion choosing local anaesthesia.

Comparison 13 Microwave ablation (second generation) versus balloon ablation (second generation), Outcome 7 Proportion requiring opiate analgesia.

Comparison 13 Microwave ablation (second generation) versus balloon ablation (second generation), Outcome 8 Proportion requiring overnight stay.

Comparison 13 Microwave ablation (second generation) versus balloon ablation (second generation), Outcome 9 Quality of life scores: EQ5D.

Comparison 13 Microwave ablation (second generation) versus balloon ablation (second generation), Outcome 10 Quality of life scores: SF12.

Comparison 13 Microwave ablation (second generation) versus balloon ablation (second generation), Outcome 11 Requirement for further surgery at 12 months follow up (hyst only).
| Study | Microwave ablation | Balloon ablation | Results |
| Sambrook 2009b | N= | ||
Comparison 13 Microwave ablation (second generation) versus balloon ablation (second generation), Outcome 12 Pain score at 12 months follow up.

Comparison 14 Bipolar radiofrequency (second generation) versus hydrothermal ablation (second generation), Outcome 1 Amenorrhoea rates.

Comparison 14 Bipolar radiofrequency (second generation) versus hydrothermal ablation (second generation), Outcome 2 Satisfaction.

Comparison 14 Bipolar radiofrequency (second generation) versus hydrothermal ablation (second generation), Outcome 3 Absence of dysmenorrhoea.
| Study | Bipolar RF | Hydrotherm ablation | Results |
| Penninx 2010 | N=82 Median (range): 11.8 (5 to 40) | N=74 Median (range): 27.8 (14 to 55) | Test used not stated p<0.001 |
Comparison 14 Bipolar radiofrequency (second generation) versus hydrothermal ablation (second generation), Outcome 4 Duration of procedure (mins).

Comparison 14 Bipolar radiofrequency (second generation) versus hydrothermal ablation (second generation), Outcome 5 Postoperative complications.

Comparison 14 Bipolar radiofrequency (second generation) versus hydrothermal ablation (second generation), Outcome 6 Requirement for further surgery (any).

Comparison 14 Bipolar radiofrequency (second generation) versus hydrothermal ablation (second generation), Outcome 7 Requirement for further surgery (hyst only).
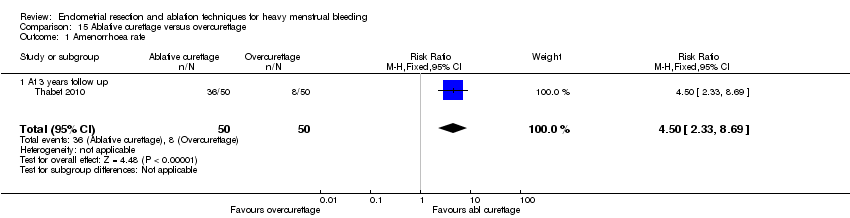
Comparison 15 Ablative curettage versus overcurettage, Outcome 1 Amenorrhoea rate.

Comparison 15 Ablative curettage versus overcurettage, Outcome 2 Amenorrhoea and normal menses rate.

Comparison 15 Ablative curettage versus overcurettage, Outcome 3 Postoperative complications.

Comparison 15 Ablative curettage versus overcurettage, Outcome 4 Hospital stay (days).

Comparison 15 Ablative curettage versus overcurettage, Outcome 5 Failure rate of procedure.

Comparison 15 Ablative curettage versus overcurettage, Outcome 6 Requirement for further surgery (hyst only).

Comparison 16 Overall analyses: second‐generation endometrial ablation versus first‐generation endometrial ablation, Outcome 1 Amenorrhoea rate.
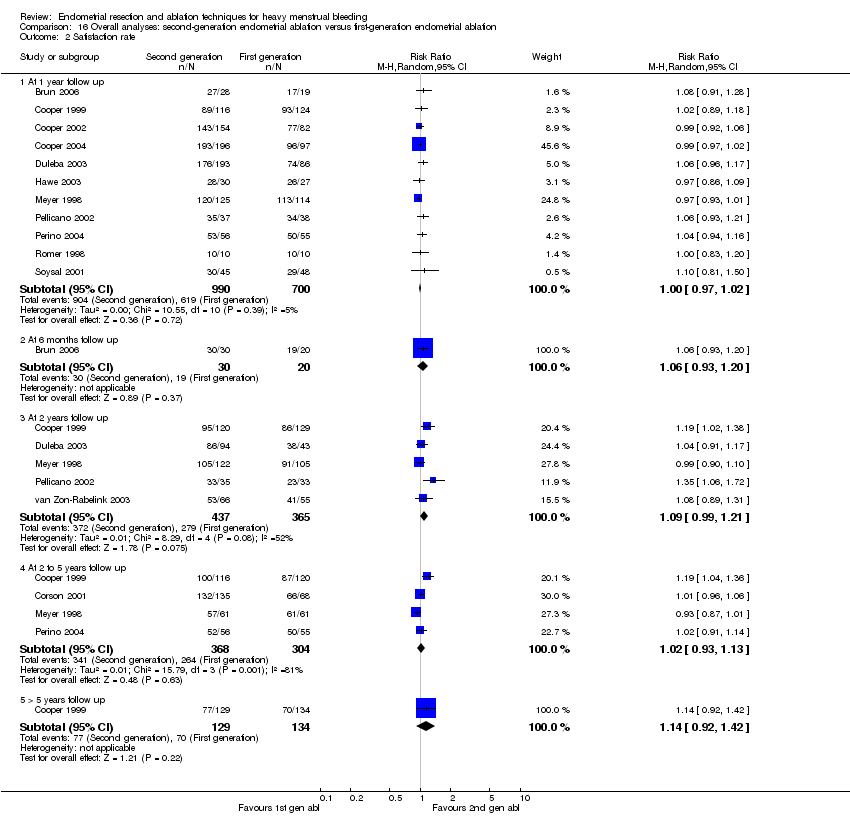
Comparison 16 Overall analyses: second‐generation endometrial ablation versus first‐generation endometrial ablation, Outcome 2 Satisfaction rate.

Comparison 16 Overall analyses: second‐generation endometrial ablation versus first‐generation endometrial ablation, Outcome 3 Success of treatment (PBAC<75 or acceptable improvement).
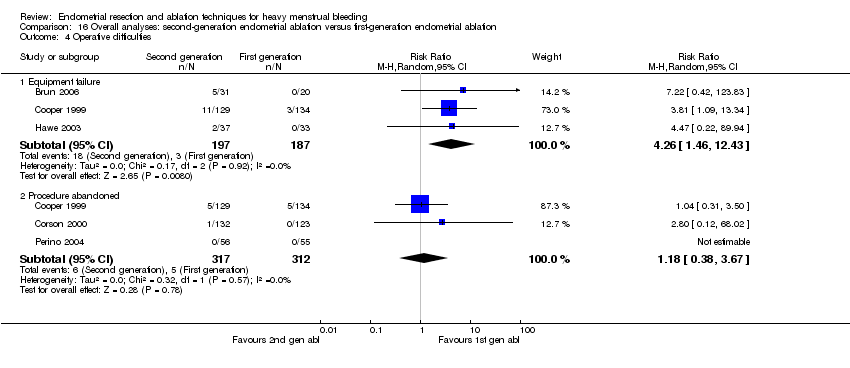
Comparison 16 Overall analyses: second‐generation endometrial ablation versus first‐generation endometrial ablation, Outcome 4 Operative difficulties.
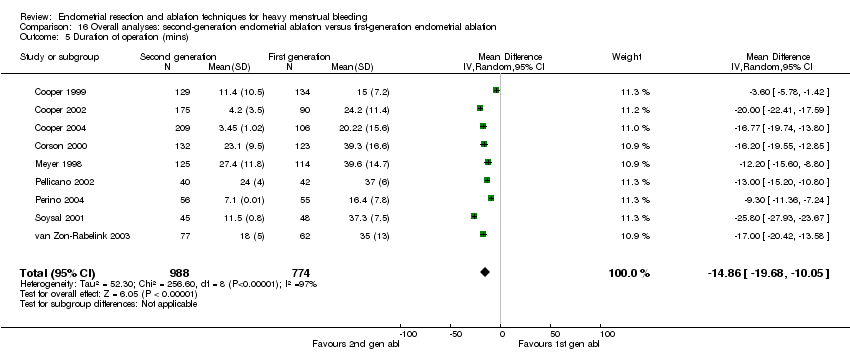
Comparison 16 Overall analyses: second‐generation endometrial ablation versus first‐generation endometrial ablation, Outcome 5 Duration of operation (mins).
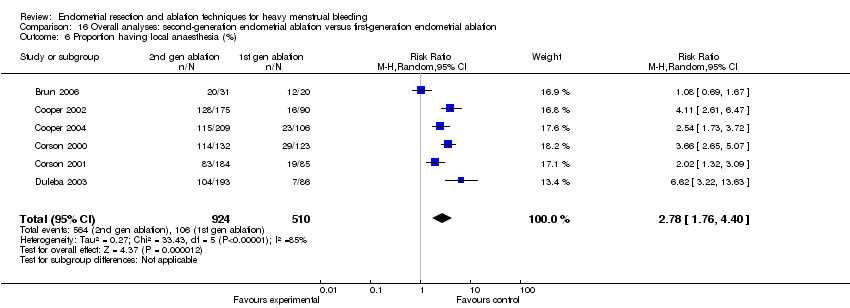
Comparison 16 Overall analyses: second‐generation endometrial ablation versus first‐generation endometrial ablation, Outcome 6 Proportion having local anaesthesia (%).

Comparison 16 Overall analyses: second‐generation endometrial ablation versus first‐generation endometrial ablation, Outcome 7 Inability to work.

Comparison 16 Overall analyses: second‐generation endometrial ablation versus first‐generation endometrial ablation, Outcome 8 Operative or postoperative complication rate.

Comparison 16 Overall analyses: second‐generation endometrial ablation versus first‐generation endometrial ablation, Outcome 9 Requirement for any additional surgery.
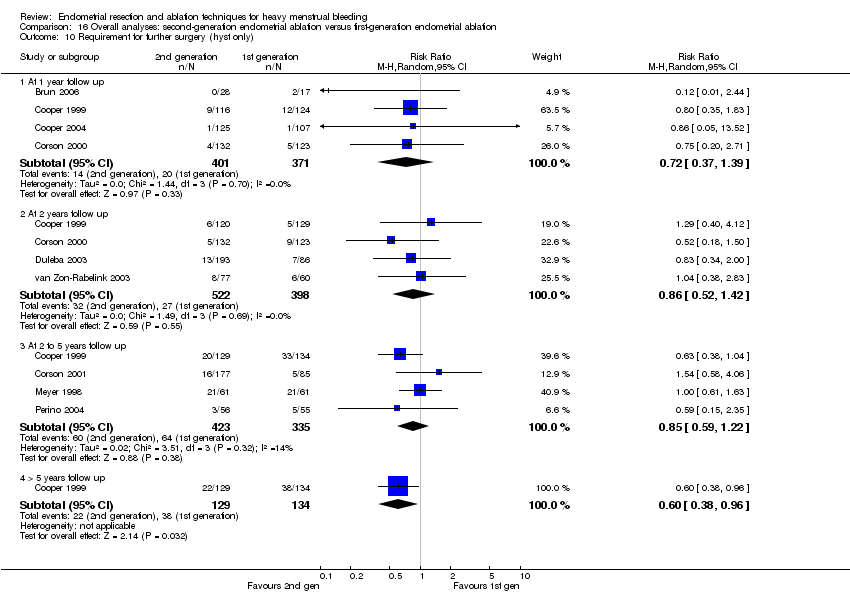
Comparison 16 Overall analyses: second‐generation endometrial ablation versus first‐generation endometrial ablation, Outcome 10 Requirement for further surgery (hyst only).
| Second‐generation endometrial ablation compared to first‐generation endometrial ablation for heavy menstrual bleeding | ||||||
| Patient or population: patients with heavy menstrual bleeding | ||||||
| Outcomes | Illustrative comparative risks* (95% CI) | Relative effect | No of Participants | Quality of the evidence | Comments | |
| Assumed risk | Corresponding risk | |||||
| First‐generation endometrial ablation | Second‐generation endometrial ablation | |||||
| Amenorrhoea rate ‐ At 1 year follow up | 376 per 1000 | 353 per 1000 | RR 0.94 | 2085 | ⊕⊝⊝⊝ | |
| Satisfaction rate ‐ At 1 year follow up | 884 per 1000 | 884 per 1000 | RR 1 | 1690 | ⊕⊕⊕⊝ | |
| Success of treatment (PBAC<75 or acceptable improvement) ‐ At 12 months follow up | 808 per 1000 | 824 per 1000 | RR 1.02 | 1375 | ⊕⊕⊕⊕ | |
| Duration of operation (mins) | The mean duration of operation (mins) in the intervention groups was | 1762 | ⊕⊕⊝⊝ | |||
| Proportion having local anaesthesia (%) | 208 per 1000 | 578 per 1000 | RR 2.78 | 1434 | ⊕⊕⊝⊝ | |
| Operative or post‐operative complication rate ‐ Perforation | 13 per 1000 | 4 per 1000 | RR 0.32 | 1885 | ⊕⊕⊕⊝ | |
| Requirement for any additional surgery ‐ > 5 years follow up | 381 per 1000 | 263 per 1000 | RR 0.69 | 263 | ⊕⊕⊕⊝ | |
| *The basis for the assumed risk (e.g. the median control group risk across studies) is provided in footnotes. The corresponding risk (and its 95% confidence interval) is based on the assumed risk in the comparison group and the relative effect of the intervention (and its 95% CI). | ||||||
| GRADE Working Group grades of evidence | ||||||
| 1 Substantial heterogeneity (I2 = 74%) that could not be explained | ||||||
| Outcome or subgroup title | No. of studies | No. of participants | Statistical method | Effect size |
| 1 Amenorrhoea rate Show forest plot | 2 | Risk Ratio (M‐H, Fixed, 95% CI) | Subtotals only | |
| 1.1 At 6 months | 2 | 348 | Risk Ratio (M‐H, Fixed, 95% CI) | 0.97 [0.66, 1.45] |
| 1.2 At 12 months | 1 | 306 | Risk Ratio (M‐H, Fixed, 95% CI) | 1.06 [0.70, 1.60] |
| 2 Amenorrhoea/hypomenorrhoea rate Show forest plot | 1 | Risk Ratio (M‐H, Fixed, 95% CI) | Subtotals only | |
| 2.1 At 6 months | 1 | 326 | Risk Ratio (M‐H, Fixed, 95% CI) | 0.97 [0.89, 1.05] |
| 2.2 At 12 months | 1 | 306 | Risk Ratio (M‐H, Fixed, 95% CI) | 1.06 [0.92, 1.22] |
| 3 MBL at 6 months (descriptive data) Show forest plot | Other data | No numeric data | ||
| 4 Participant satisfaction at 12 months (very/moderately) Show forest plot | 1 | 321 | Risk Ratio (M‐H, Fixed, 95% CI) | 0.99 [0.92, 1.06] |
| 5 Duration of operation (mins) Show forest plot | 2 | 386 | Mean Difference (IV, Fixed, 95% CI) | 9.15 [7.21, 11.09] |
| 6 Operative difficulties (%) Show forest plot | 1 | Risk Ratio (M‐H, Fixed, 95% CI) | Subtotals only | |
| 6.1 Procedure abandoned | 1 | 366 | Risk Ratio (M‐H, Fixed, 95% CI) | 1.47 [0.61, 3.51] |
| 6.2 Failed instrumentation | 1 | 366 | Risk Ratio (M‐H, Fixed, 95% CI) | 0.20 [0.01, 4.05] |
| 6.3 Equipment failure | 1 | 366 | Risk Ratio (M‐H, Fixed, 95% CI) | 5.54 [1.65, 18.60] |
| 6.4 Immediate hysterectomy | 1 | 366 | Risk Ratio (M‐H, Fixed, 95% CI) | 0.33 [0.01, 7.95] |
| 7 Good general health (proportion of women) Show forest plot | 1 | 321 | Risk Ratio (M‐H, Fixed, 95% CI) | 1.03 [0.95, 1.12] |
| 8 Improvement in symptoms (proportion of women) Show forest plot | 1 | 321 | Risk Ratio (M‐H, Fixed, 95% CI) | 1.03 [0.87, 1.21] |
| 9 Improvement in dysmenorrhea Show forest plot | 1 | Risk Ratio (M‐H, Fixed, 95% CI) | Subtotals only | |
| 9.1 At 6 months follow up | 1 | 253 | Risk Ratio (M‐H, Fixed, 95% CI) | 1.17 [1.00, 1.38] |
| 9.2 At 12 months follow up | 1 | 218 | Risk Ratio (M‐H, Fixed, 95% CI) | 1.00 [0.87, 1.15] |
| 10 Complication rate (proportion of women) Show forest plot | 2 | Risk Ratio (M‐H, Fixed, 95% CI) | Subtotals only | |
| 10.1 Perforation | 1 | 366 | Risk Ratio (M‐H, Fixed, 95% CI) | 0.14 [0.01, 2.69] |
| 10.2 Burns | 1 | 366 | Risk Ratio (M‐H, Fixed, 95% CI) | 4.89 [0.24, 101.21] |
| 10.3 Bowel obstruction | 1 | 366 | Risk Ratio (M‐H, Fixed, 95% CI) | 2.94 [0.12, 71.59] |
| 10.4 Urinary tract infection | 1 | 366 | Risk Ratio (M‐H, Fixed, 95% CI) | 1.96 [0.36, 10.55] |
| 10.5 Pelvic sepsis | 1 | 366 | Risk Ratio (M‐H, Fixed, 95% CI) | 0.82 [0.25, 2.62] |
| 10.6 Haematometra | 1 | 366 | Risk Ratio (M‐H, Fixed, 95% CI) | 0.20 [0.01, 4.05] |
| 10.7 Glycine toxicity | 1 | 22 | Risk Ratio (M‐H, Fixed, 95% CI) | 4.23 [0.23, 79.10] |
| 10.8 Fluid overload (>1.5L) | 1 | 366 | Risk Ratio (M‐H, Fixed, 95% CI) | 4.89 [1.44, 16.61] |
| 10.9 Uterine tamponade | 1 | 366 | Risk Ratio (M‐H, Fixed, 95% CI) | 1.14 [0.39, 3.33] |
| 11 Requirement for further surgical treatment (within 12 mths) Show forest plot | 2 | 388 | Risk Ratio (M‐H, Fixed, 95% CI) | 0.84 [0.55, 1.29] |
| Outcome or subgroup title | No. of studies | No. of participants | Statistical method | Effect size |
| 1 Amenorrhoea rate at 12 months follow up Show forest plot | 1 | 91 | Risk Ratio (M‐H, Fixed, 95% CI) | 0.76 [0.46, 1.24] |
| 2 Amenorrhea/hypomenorrhoea rate at 12 months follow up Show forest plot | 1 | 91 | Risk Ratio (M‐H, Fixed, 95% CI) | 0.99 [0.80, 1.22] |
| 3 PBAC score at 12 mths Show forest plot | Other data | No numeric data | ||
| 4 Satisfaction rate at 12 mths (very/moderately) Show forest plot | 1 | 91 | Risk Ratio (M‐H, Fixed, 95% CI) | 1.03 [0.93, 1.14] |
| 5 Duration of operation (mins) Show forest plot | 1 | 91 | Mean Difference (IV, Fixed, 95% CI) | ‐1.50 [‐2.65, ‐0.35] |
| 6 Operative difficulties Show forest plot | 1 | 91 | Risk Ratio (M‐H, Fixed, 95% CI) | 0.29 [0.10, 0.82] |
| 6.1 Difficulty with surgery (moderate or severe) | 1 | 91 | Risk Ratio (M‐H, Fixed, 95% CI) | 0.29 [0.10, 0.82] |
| 7 Degree of fluid deficit (ml) Show forest plot | 1 | 91 | Mean Difference (IV, Fixed, 95% CI) | ‐258.0 [‐342.05, ‐173.95] |
| Outcome or subgroup title | No. of studies | No. of participants | Statistical method | Effect size |
| 1 Duration of operation (mins) Show forest plot | 1 | 45 | Mean Difference (IV, Fixed, 95% CI) | ‐1.10 [‐2.92, 0.72] |
| 2 Duration of operation (descriptive data) Show forest plot | Other data | No numeric data | ||
| 3 Complication rate Show forest plot | 1 | Risk Ratio (M‐H, Fixed, 95% CI) | Subtotals only | |
| 3.1 Fluid deficit | 1 | 120 | Risk Ratio (M‐H, Fixed, 95% CI) | 0.32 [0.01, 7.76] |
| 3.2 Perforation | 1 | 120 | Risk Ratio (M‐H, Fixed, 95% CI) | 0.32 [0.01, 7.76] |
| 4 Requirement for further surgery (hyst or ablation) Show forest plot | 1 | Risk Ratio (M‐H, Fixed, 95% CI) | Subtotals only | |
| 4.1 At 2 yrs follow up | 1 | 120 | Risk Ratio (M‐H, Fixed, 95% CI) | 1.04 [0.55, 1.95] |
| 4.2 2 to 5 yrs follow up | 1 | 120 | Risk Ratio (M‐H, Fixed, 95% CI) | 1.21 [0.70, 2.10] |
| 4.3 More than 5 years | 1 | 120 | Risk Ratio (M‐H, Fixed, 95% CI) | 1.39 [0.82, 2.36] |
| 5 Requirement for further surgery rate (hyst only) Show forest plot | 1 | Risk Ratio (M‐H, Fixed, 95% CI) | Subtotals only | |
| 5.1 At 2 yrs follow up | 1 | 120 | Risk Ratio (M‐H, Fixed, 95% CI) | 1.45 [0.43, 4.88] |
| 5.2 2 to 5 yrs follow up | 1 | 120 | Risk Ratio (M‐H, Fixed, 95% CI) | 1.21 [0.51, 2.85] |
| 5.3 More than 5 years follow up | 1 | 120 | Risk Ratio (M‐H, Fixed, 95% CI) | 1.32 [0.66, 2.63] |
| Outcome or subgroup title | No. of studies | No. of participants | Statistical method | Effect size |
| 1 Amenorrhoea rate Show forest plot | 1 | Risk Ratio (M‐H, Fixed, 95% CI) | Subtotals only | |
| 1.1 At 1 year follow up | 1 | 111 | Risk Ratio (M‐H, Fixed, 95% CI) | 2.46 [1.50, 4.03] |
| 1.2 2 to 5 years follow up | 1 | 111 | Risk Ratio (M‐H, Fixed, 95% CI) | 2.49 [1.48, 4.21] |
| 2 Satisfaction rate Show forest plot | 1 | Risk Ratio (M‐H, Fixed, 95% CI) | Subtotals only | |
| 2.1 At one year follow up | 1 | 111 | Risk Ratio (M‐H, Fixed, 95% CI) | 1.04 [0.94, 1.16] |
| 2.2 2 to 5 years follow up | 1 | 111 | Risk Ratio (M‐H, Fixed, 95% CI) | 1.02 [0.91, 1.14] |
| 3 Duration of operation Show forest plot | 1 | 111 | Mean Difference (IV, Fixed, 95% CI) | ‐9.30 [‐11.36, ‐7.24] |
| 4 Pain score at 12 hrs after surgery (VAS: 1‐10) Show forest plot | 1 | 111 | Mean Difference (IV, Fixed, 95% CI) | 0.70 [0.02, 1.38] |
| 5 Intraoperative complication rate Show forest plot | 1 | Risk Ratio (M‐H, Fixed, 95% CI) | Subtotals only | |
| 5.1 Perforation | 1 | 111 | Risk Ratio (M‐H, Fixed, 95% CI) | 0.0 [0.0, 0.0] |
| 5.2 UTI | 1 | 111 | Risk Ratio (M‐H, Fixed, 95% CI) | 0.49 [0.05, 5.26] |
| 6 Requirement for further surgery rate (hyst only) Show forest plot | 1 | 111 | Risk Ratio (M‐H, Fixed, 95% CI) | 0.59 [0.15, 2.35] |
| 6.1 2 to 5 years follow up | 1 | 111 | Risk Ratio (M‐H, Fixed, 95% CI) | 0.59 [0.15, 2.35] |
| Outcome or subgroup title | No. of studies | No. of participants | Statistical method | Effect size |
| 1 Amenorrhoea rate Show forest plot | 1 | Risk Ratio (M‐H, Fixed, 95% CI) | Subtotals only | |
| 1.1 At 1 year follow up | 1 | 250 | Risk Ratio (M‐H, Fixed, 95% CI) | 0.79 [0.60, 1.05] |
| 1.2 At 2 years follow up | 1 | 225 | Risk Ratio (M‐H, Fixed, 95% CI) | 1.01 [0.75, 1.36] |
| 1.3 2 to 5 years follow up | 1 | 203 | Risk Ratio (M‐H, Fixed, 95% CI) | 1.17 [0.86, 1.59] |
| 2 PBAC </= 75 Show forest plot | 1 | 250 | Risk Ratio (M‐H, Fixed, 95% CI) | 0.94 [0.82, 1.07] |
| 2.1 At 1 year follow up | 1 | 250 | Risk Ratio (M‐H, Fixed, 95% CI) | 0.94 [0.82, 1.07] |
| 2.2 2 to 5 years follow up | 0 | 0 | Risk Ratio (M‐H, Fixed, 95% CI) | 0.0 [0.0, 0.0] |
| 3 Proportion with "normal" bleeding (PBAC </= 100) Show forest plot | 1 | Risk Ratio (M‐H, Fixed, 95% CI) | Subtotals only | |
| 3.1 At 1 year follow up | 1 | 250 | Risk Ratio (M‐H, Fixed, 95% CI) | 0.96 [0.86, 1.07] |
| 3.2 At 2 years follow up | 1 | 225 | Risk Ratio (M‐H, Fixed, 95% CI) | 1.00 [0.92, 1.09] |
| 3.3 2 to 5 years follow up | 1 | 203 | Risk Ratio (M‐H, Fixed, 95% CI) | 1.03 [0.95, 1.12] |
| 4 Satisfaction rate Show forest plot | 1 | 203 | Risk Ratio (M‐H, Fixed, 95% CI) | 1.01 [0.96, 1.06] |
| 4.1 2 to 5 years follow up | 1 | 203 | Risk Ratio (M‐H, Fixed, 95% CI) | 1.01 [0.96, 1.06] |
| 5 Proportion having local anaesthesia (%) Show forest plot | 1 | 269 | Risk Ratio (M‐H, Fixed, 95% CI) | 2.02 [1.32, 3.09] |
| 6 Intraoperative complication rate Show forest plot | 1 | Risk Ratio (M‐H, Fixed, 95% CI) | Subtotals only | |
| 6.1 Cervical lacerations | 1 | 269 | Risk Ratio (M‐H, Fixed, 95% CI) | 0.09 [0.00, 1.92] |
| 6.2 Endometritis | 1 | 269 | Risk Ratio (M‐H, Fixed, 95% CI) | 0.92 [0.08, 10.05] |
| 6.3 Urinary tract infection | 1 | 269 | Risk Ratio (M‐H, Fixed, 95% CI) | 1.15 [0.23, 5.83] |
| 6.4 Hematometra | 1 | 269 | Risk Ratio (M‐H, Fixed, 95% CI) | 0.18 [0.04, 0.93] |
| 6.5 First degree burn | 1 | 269 | Risk Ratio (M‐H, Fixed, 95% CI) | 2.32 [0.11, 47.89] |
| 7 Postoperative complication rate Show forest plot | 1 | Risk Ratio (M‐H, Fixed, 95% CI) | Subtotals only | |
| 7.1 Abdominal pain (at 2 weeks) | 1 | 269 | Risk Ratio (M‐H, Fixed, 95% CI) | 1.40 [1.03, 1.90] |
| 7.2 Uterine cramping | 1 | 269 | Risk Ratio (M‐H, Fixed, 95% CI) | 1.12 [0.72, 1.74] |
| 7.3 Nausea or vomiting | 1 | 269 | Risk Ratio (M‐H, Fixed, 95% CI) | 3.08 [1.36, 6.98] |
| 8 Requirement for further surgery (any surgery) Show forest plot | 1 | Risk Ratio (M‐H, Fixed, 95% CI) | Subtotals only | |
| 8.1 At 1 year follow up | 1 | 269 | Risk Ratio (M‐H, Fixed, 95% CI) | 2.32 [0.11, 47.89] |
| 8.2 2 to 5 years follow up | 1 | 262 | Risk Ratio (M‐H, Fixed, 95% CI) | 1.26 [0.58, 2.73] |
| 9 Requirement for further surgery rate (hyst only) Show forest plot | 1 | 262 | Risk Ratio (M‐H, Fixed, 95% CI) | 1.54 [0.58, 4.06] |
| 9.1 At 1 year follow up | 0 | 0 | Risk Ratio (M‐H, Fixed, 95% CI) | 0.0 [0.0, 0.0] |
| 9.2 2 to 5 years follow up | 1 | 262 | Risk Ratio (M‐H, Fixed, 95% CI) | 1.54 [0.58, 4.06] |
| Outcome or subgroup title | No. of studies | No. of participants | Statistical method | Effect size |
| 1 Amenorrhoea rate Show forest plot | 1 | 228 | Risk Ratio (M‐H, Fixed, 95% CI) | 0.50 [0.36, 0.69] |
| 1.1 At 1 year follow up | 1 | 228 | Risk Ratio (M‐H, Fixed, 95% CI) | 0.50 [0.36, 0.69] |
| 2 Satisfaction rate Show forest plot | 1 | Risk Ratio (M‐H, Fixed, 95% CI) | Subtotals only | |
| 2.1 At 1 year follow up | 1 | 279 | Risk Ratio (M‐H, Fixed, 95% CI) | 1.06 [0.96, 1.17] |
| 2.2 At 2 years follow up | 1 | 137 | Risk Ratio (M‐H, Fixed, 95% CI) | 1.04 [0.91, 1.17] |
| 3 Proportion having local anaesthesia (%) Show forest plot | 1 | 279 | Risk Ratio (M‐H, Fixed, 95% CI) | 6.62 [3.22, 13.63] |
| 4 Intraoperative complication rate Show forest plot | 1 | Risk Ratio (M‐H, Fixed, 95% CI) | Subtotals only | |
| 4.1 Perforation | 1 | 279 | Risk Ratio (M‐H, Fixed, 95% CI) | 0.15 [0.01, 3.63] |
| 4.2 Vaginal bleeding | 1 | 279 | Risk Ratio (M‐H, Fixed, 95% CI) | 1.35 [0.06, 32.70] |
| 4.3 Abdominal cramping | 1 | 279 | Risk Ratio (M‐H, Fixed, 95% CI) | 2.24 [0.11, 46.21] |
| 4.4 UTI | 1 | 279 | Risk Ratio (M‐H, Fixed, 95% CI) | 0.15 [0.01, 3.63] |
| 4.5 Severe pelvic pain | 1 | 279 | Risk Ratio (M‐H, Fixed, 95% CI) | 0.15 [0.01, 3.63] |
| 5 Requirement for further surgery (any surgery) Show forest plot | 1 | 279 | Risk Ratio (M‐H, Fixed, 95% CI) | 1.00 [0.45, 2.22] |
| 5.1 At 2 years follow up | 1 | 279 | Risk Ratio (M‐H, Fixed, 95% CI) | 1.00 [0.45, 2.22] |
| 6 Requirement for further surgery rate (hyst only) Show forest plot | 1 | 279 | Risk Ratio (M‐H, Fixed, 95% CI) | 0.83 [0.34, 2.00] |
| 6.1 At 2 years follow up | 1 | 279 | Risk Ratio (M‐H, Fixed, 95% CI) | 0.83 [0.34, 2.00] |
| Outcome or subgroup title | No. of studies | No. of participants | Statistical method | Effect size |
| 1 Amenorrhea rate at 1 yr follow up Show forest plot | 2 | 470 | Risk Ratio (M‐H, Fixed, 95% CI) | 1.02 [0.79, 1.31] |
| 1.1 Balloon system | 1 | 234 | Risk Ratio (M‐H, Fixed, 95% CI) | 0.89 [0.62, 1.29] |
| 1.2 Mesh system | 1 | 236 | Risk Ratio (M‐H, Fixed, 95% CI) | 1.16 [0.82, 1.64] |
| 2 Proportion with successful Rx (PBAC<75) Show forest plot | 2 | 470 | Risk Ratio (M‐H, Fixed, 95% CI) | 1.06 [0.98, 1.15] |
| 2.1 Balloon system | 1 | 234 | Risk Ratio (M‐H, Fixed, 95% CI) | 1.05 [0.94, 1.17] |
| 2.2 Mesh system | 1 | 236 | Risk Ratio (M‐H, Fixed, 95% CI) | 1.08 [0.96, 1.22] |
| 3 PBAC score 12 months after treatment Show forest plot | Other data | No numeric data | ||
| 3.1 Balloon system | Other data | No numeric data | ||
| 3.2 Mesh system | Other data | No numeric data | ||
| 4 Proportion satisfied with treatment at 1 year Show forest plot | 1 | 236 | Risk Ratio (M‐H, Fixed, 95% CI) | 0.99 [0.92, 1.06] |
| 4.1 Balloon system | 0 | 0 | Risk Ratio (M‐H, Fixed, 95% CI) | 0.0 [0.0, 0.0] |
| 4.2 Mesh system | 1 | 236 | Risk Ratio (M‐H, Fixed, 95% CI) | 0.99 [0.92, 1.06] |
| 5 Duration of operation (mins) Show forest plot | 2 | 520 | Mean Difference (IV, Fixed, 95% CI) | ‐18.70 [‐20.66, ‐16.75] |
| 5.1 Balloon system | 1 | 255 | Mean Difference (IV, Fixed, 95% CI) | ‐16.20 [‐19.55, ‐12.85] |
| 5.2 Mesh system | 1 | 265 | Mean Difference (IV, Fixed, 95% CI) | ‐20.0 [‐22.41, ‐17.59] |
| 6 Proportion having local anaesthesia (%) Show forest plot | 2 | 520 | Risk Ratio (M‐H, Fixed, 95% CI) | 3.85 [2.94, 5.04] |
| 6.1 Balloon system | 1 | 255 | Risk Ratio (M‐H, Fixed, 95% CI) | 3.66 [2.65, 5.07] |
| 6.2 Mesh system | 1 | 265 | Risk Ratio (M‐H, Fixed, 95% CI) | 4.11 [2.61, 6.47] |
| 7 Intraoperative complication rate Show forest plot | 2 | Risk Ratio (M‐H, Fixed, 95% CI) | Subtotals only | |
| 7.1 Perforation | 2 | 532 | Risk Ratio (M‐H, Fixed, 95% CI) | 0.13 [0.02, 1.01] |
| 7.2 Bradycardia | 1 | 265 | Risk Ratio (M‐H, Fixed, 95% CI) | 1.55 [0.06, 37.70] |
| 7.3 Cervical tear/stenosis | 2 | 532 | Risk Ratio (M‐H, Fixed, 95% CI) | 0.11 [0.01, 0.87] |
| 7.4 Fluid overload | 1 | 267 | Risk Ratio (M‐H, Fixed, 95% CI) | 0.29 [0.01, 6.93] |
| 7.5 Procedure abandoned | 1 | 267 | Risk Ratio (M‐H, Fixed, 95% CI) | 2.57 [0.11, 62.41] |
| 8 Postoperative complication rate Show forest plot | 2 | Risk Ratio (M‐H, Fixed, 95% CI) | Subtotals only | |
| 8.1 Fever | 1 | 267 | Risk Ratio (M‐H, Fixed, 95% CI) | 0.85 [0.05, 13.51] |
| 8.2 Nausea/vomiting or severe pelvic pain | 2 | 532 | Risk Ratio (M‐H, Fixed, 95% CI) | 1.10 [0.37, 3.27] |
| 8.3 UTI | 2 | 532 | Risk Ratio (M‐H, Fixed, 95% CI) | 1.05 [0.39, 2.84] |
| 8.4 Hematometra | 2 | 532 | Risk Ratio (M‐H, Fixed, 95% CI) | 0.43 [0.08, 2.23] |
| 8.5 Myometritis | 1 | 267 | Risk Ratio (M‐H, Fixed, 95% CI) | 0.29 [0.01, 6.93] |
| 8.6 Urinary incontinence | 1 | 267 | Risk Ratio (M‐H, Fixed, 95% CI) | 0.29 [0.01, 6.93] |
| 8.7 PID | 1 | 265 | Risk Ratio (M‐H, Fixed, 95% CI) | 1.03 [0.09, 11.19] |
| 8.8 Haemorrhage | 1 | 265 | Risk Ratio (M‐H, Fixed, 95% CI) | 0.51 [0.03, 8.13] |
| 8.9 Pelvic abscess | 1 | 265 | Risk Ratio (M‐H, Fixed, 95% CI) | 0.17 [0.01, 4.19] |
| 8.10 Endometritis | 1 | 265 | Risk Ratio (M‐H, Fixed, 95% CI) | 0.34 [0.06, 2.01] |
| 9 Requirement for further surgery at 2 years (hysterectomy) Show forest plot | 1 | 255 | Risk Ratio (M‐H, Fixed, 95% CI) | 0.52 [0.18, 1.50] |
| 9.1 Balloon system | 1 | 255 | Risk Ratio (M‐H, Fixed, 95% CI) | 0.52 [0.18, 1.50] |
| 9.2 Mesh system | 0 | 0 | Risk Ratio (M‐H, Fixed, 95% CI) | 0.0 [0.0, 0.0] |
| Outcome or subgroup title | No. of studies | No. of participants | Statistical method | Effect size |
| 1 Amenorrhea rate Show forest plot | 2 | Risk Ratio (M‐H, Fixed, 95% CI) | Subtotals only | |
| 1.1 At 1 year follow up | 2 | 562 | Risk Ratio (M‐H, Fixed, 95% CI) | 1.12 [0.93, 1.36] |
| 1.2 At 2 years follow up | 1 | 249 | Risk Ratio (M‐H, Fixed, 95% CI) | 1.16 [0.87, 1.53] |
| 1.3 At 2 to 5 years follow up | 1 | 236 | Risk Ratio (M‐H, Fixed, 95% CI) | 0.93 [0.78, 1.12] |
| 1.4 > 5 years follow up | 1 | 189 | Risk Ratio (M‐H, Fixed, 95% CI) | 0.94 [0.83, 1.05] |
| 2 Success of treatment (PBAC<75 or acceptable improvement) Show forest plot | 2 | Risk Ratio (M‐H, Fixed, 95% CI) | Subtotals only | |
| 2.1 At 1 year follow up | 2 | 562 | Risk Ratio (M‐H, Fixed, 95% CI) | 1.04 [0.96, 1.13] |
| 2.2 At 2 to 5 years follow up | 1 | 236 | Risk Ratio (M‐H, Fixed, 95% CI) | 1.12 [0.97, 1.28] |
| 2.3 > 5 years follow up | 1 | 263 | Risk Ratio (M‐H, Fixed, 95% CI) | 1.08 [0.87, 1.34] |
| 3 Satisfaction rate Show forest plot | 2 | Risk Ratio (M‐H, Fixed, 95% CI) | Subtotals only | |
| 3.1 At 1 year follow up | 2 | 533 | Risk Ratio (M‐H, Fixed, 95% CI) | 1.01 [0.95, 1.07] |
| 3.2 At 2 years follow up | 1 | 249 | Risk Ratio (M‐H, Fixed, 95% CI) | 1.19 [1.02, 1.38] |
| 3.3 At 2 to 5 years follow up | 1 | 236 | Risk Ratio (M‐H, Fixed, 95% CI) | 1.19 [1.04, 1.36] |
| 3.4 > 5 years follow up | 1 | 263 | Risk Ratio (M‐H, Fixed, 95% CI) | 1.14 [0.92, 1.42] |
| 4 Duration of operation (mins) Show forest plot | Other data | No numeric data | ||
| 5 Operative difficulties Show forest plot | 1 | Risk Ratio (M‐H, Fixed, 95% CI) | Subtotals only | |
| 5.1 Equipment failure | 1 | 263 | Risk Ratio (M‐H, Fixed, 95% CI) | 3.81 [1.09, 13.34] |
| 5.2 Procedure abandoned | 1 | 263 | Risk Ratio (M‐H, Fixed, 95% CI) | 1.04 [0.31, 3.50] |
| 6 Proportion having local anaesthesia Show forest plot | 1 | 315 | Risk Ratio (M‐H, Fixed, 95% CI) | 2.54 [1.73, 3.72] |
| 7 Duration of hospital stay (hours) Show forest plot | Other data | No numeric data | ||
| 8 Inability to work (proportion of women) Show forest plot | 1 | Risk Ratio (M‐H, Fixed, 95% CI) | Subtotals only | |
| 8.1 At 12 months follow up | 1 | 240 | Risk Ratio (M‐H, Fixed, 95% CI) | 0.53 [0.17, 1.73] |
| 8.2 > 5 years follow up | 1 | 189 | Risk Ratio (M‐H, Fixed, 95% CI) | 1.52 [0.26, 8.87] |
| 9 Change in SF36 score after treatment Show forest plot | Other data | No numeric data | ||
| 9.1 Physical functioning | Other data | No numeric data | ||
| 9.2 Social functioning | Other data | No numeric data | ||
| 9.3 Physical role | Other data | No numeric data | ||
| 9.4 Emotional role | Other data | No numeric data | ||
| 9.5 Mental health | Other data | No numeric data | ||
| 9.6 Energy/fatigue | Other data | No numeric data | ||
| 9.7 Pain | Other data | No numeric data | ||
| 9.8 General health | Other data | No numeric data | ||
| 10 Improvement in symptoms Show forest plot | 1 | Risk Ratio (M‐H, Fixed, 95% CI) | Subtotals only | |
| 10.1 At 1 year follow up | 1 | 240 | Risk Ratio (M‐H, Fixed, 95% CI) | 1.03 [0.90, 1.19] |
| 10.2 At 2 to 5 years follow up | 1 | 236 | Risk Ratio (M‐H, Fixed, 95% CI) | 1.12 [0.97, 1.28] |
| 11 Improvement in dysmenorrhoea Show forest plot | 2 | Risk Ratio (M‐H, Fixed, 95% CI) | Subtotals only | |
| 11.1 At 1 year follow up | 2 | 533 | Risk Ratio (M‐H, Fixed, 95% CI) | 0.98 [0.89, 1.09] |
| 11.2 At 2 years follow up | 1 | 249 | Risk Ratio (M‐H, Fixed, 95% CI) | 1.05 [0.93, 1.19] |
| 12 Reduction in pain score (points) Show forest plot | 1 | 189 | Mean Difference (IV, Fixed, 95% CI) | ‐0.80 [‐4.32, 2.72] |
| 12.1 >5 years follow up | 1 | 189 | Mean Difference (IV, Fixed, 95% CI) | ‐0.80 [‐4.32, 2.72] |
| 13 Postoperative analgesia rate Show forest plot | 1 | 263 | Risk Ratio (M‐H, Fixed, 95% CI) | 0.94 [0.81, 1.10] |
| 14 Intraoperative complication rate Show forest plot | 2 | Risk Ratio (M‐H, Fixed, 95% CI) | Subtotals only | |
| 14.1 Perforation | 2 | 585 | Risk Ratio (M‐H, Fixed, 95% CI) | 1.63 [0.22, 12.12] |
| 14.2 Haemorrhage | 1 | 263 | Risk Ratio (M‐H, Fixed, 95% CI) | 0.09 [0.01, 1.69] |
| 14.3 Cervical laceration | 1 | 322 | Risk Ratio (M‐H, Fixed, 95% CI) | 0.50 [0.07, 3.48] |
| 14.4 Cervical stenosis | 1 | 322 | Risk Ratio (M‐H, Fixed, 95% CI) | 1.5 [0.06, 36.52] |
| 15 Postoperative complication rate (wihin 24 hours) Show forest plot | 1 | Risk Ratio (M‐H, Fixed, 95% CI) | Subtotals only | |
| 15.1 Chills | 1 | 322 | Risk Ratio (M‐H, Fixed, 95% CI) | 1.35 [0.59, 3.11] |
| 15.2 Bloating | 1 | 322 | Risk Ratio (M‐H, Fixed, 95% CI) | 0.83 [0.38, 1.83] |
| 15.3 Dysuria | 1 | 322 | Risk Ratio (M‐H, Fixed, 95% CI) | 0.77 [0.37, 1.58] |
| 15.4 Fever | 1 | 322 | Risk Ratio (M‐H, Fixed, 95% CI) | 2.5 [0.12, 51.62] |
| 15.5 Headache | 1 | 322 | Risk Ratio (M‐H, Fixed, 95% CI) | 0.75 [0.22, 2.59] |
| 15.6 Nausea | 1 | 322 | Risk Ratio (M‐H, Fixed, 95% CI) | 1.35 [0.83, 2.21] |
| 15.7 Vomiting | 1 | 322 | Risk Ratio (M‐H, Fixed, 95% CI) | 3.61 [1.30, 10.00] |
| 15.8 UTI | 1 | 322 | Risk Ratio (M‐H, Fixed, 95% CI) | 0.50 [0.03, 7.88] |
| 15.9 Vaginal infection | 1 | 322 | Risk Ratio (M‐H, Fixed, 95% CI) | 1.5 [0.06, 36.52] |
| 15.10 Uterine cramping | 1 | 322 | Risk Ratio (M‐H, Fixed, 95% CI) | 1.21 [1.01, 1.44] |
| 15.11 Abdominal tenderness | 1 | 322 | Risk Ratio (M‐H, Fixed, 95% CI) | 0.61 [0.26, 1.42] |
| 15.12 Endometritis | 1 | 322 | Risk Ratio (M‐H, Fixed, 95% CI) | 6.5 [0.37, 114.31] |
| 16 Requirement for further surgery (any surgery) Show forest plot | 1 | Risk Ratio (M‐H, Fixed, 95% CI) | Subtotals only | |
| 16.1 At 1 year follow up | 1 | 240 | Risk Ratio (M‐H, Fixed, 95% CI) | 0.82 [0.38, 1.80] |
| 16.2 At 2 years follow up | 1 | 249 | Risk Ratio (M‐H, Fixed, 95% CI) | 0.97 [0.55, 1.72] |
| 16.3 At 2 to 5 years follow up | 1 | 263 | Risk Ratio (M‐H, Fixed, 95% CI) | 0.85 [0.56, 1.27] |
| 16.4 > 5 years follow up | 1 | 263 | Risk Ratio (M‐H, Fixed, 95% CI) | 0.69 [0.48, 0.99] |
| 17 Requirement for further surgery rate (hyst only) Show forest plot | 2 | Risk Ratio (M‐H, Fixed, 95% CI) | Subtotals only | |
| 17.1 At 1 year follow up | 2 | 562 | Risk Ratio (M‐H, Fixed, 95% CI) | 0.77 [0.35, 1.70] |
| 17.2 At 2 years follow up | 1 | 249 | Risk Ratio (M‐H, Fixed, 95% CI) | 0.95 [0.50, 1.81] |
| 17.3 At 2 to 5 years follow up | 1 | 263 | Risk Ratio (M‐H, Fixed, 95% CI) | 0.63 [0.38, 1.04] |
| 17.4 > 5 years follow up | 1 | 263 | Risk Ratio (M‐H, Fixed, 95% CI) | 0.60 [0.38, 0.96] |
| Outcome or subgroup title | No. of studies | No. of participants | Statistical method | Effect size |
| 1 Amenorrhea rate Show forest plot | 3 | Risk Ratio (M‐H, Fixed, 95% CI) | Subtotals only | |
| 1.1 At 1 year follow up | 3 | 352 | Risk Ratio (M‐H, Fixed, 95% CI) | 0.63 [0.41, 0.97] |
| 1.2 At 2 years follow up | 1 | 227 | Risk Ratio (M‐H, Fixed, 95% CI) | 0.60 [0.33, 1.07] |
| 1.3 At 2 to 5 years follow up | 1 | 122 | Risk Ratio (M‐H, Fixed, 95% CI) | 0.7 [0.39, 1.25] |
| 2 Amenorrhoea/eumenorrhoea rate Show forest plot | 2 | Risk Ratio (M‐H, Fixed, 95% CI) | Subtotals only | |
| 2.1 At 1 year follow up | 2 | 259 | Risk Ratio (M‐H, Fixed, 95% CI) | 0.95 [0.86, 1.06] |
| 2.2 At 2 years follow up | 1 | 227 | Risk Ratio (M‐H, Fixed, 95% CI) | 0.99 [0.91, 1.08] |
| 2.3 At 2 to 5 years follow up | 1 | 122 | Risk Ratio (M‐H, Fixed, 95% CI) | 0.98 [0.91, 1.06] |
| 3 PBAC score after treatment Show forest plot | Other data | No numeric data | ||
| 3.1 At 1 year follow up | Other data | No numeric data | ||
| 3.2 At 2 years follow up | Other data | No numeric data | ||
| 4 Success of treatment (lighter periods and no further surgery) Show forest plot | 1 | Risk Ratio (M‐H, Fixed, 95% CI) | Subtotals only | |
| 4.1 At 2 to 5 years follow up | 1 | 170 | Risk Ratio (M‐H, Fixed, 95% CI) | 0.98 [0.80, 1.20] |
| 5 Success of treatment (PBAC<75) Show forest plot | 1 | 93 | Risk Ratio (M‐H, Fixed, 95% CI) | 0.95 [0.77, 1.19] |
| 5.1 At 1 year follow up | 1 | 93 | Risk Ratio (M‐H, Fixed, 95% CI) | 0.95 [0.77, 1.19] |
| 6 Success of treatment (menstrual score <185) Show forest plot | 1 | Risk Ratio (M‐H, Fixed, 95% CI) | Subtotals only | |
| 6.1 At 1 year follow up | 1 | 129 | Risk Ratio (M‐H, Fixed, 95% CI) | 1.00 [0.83, 1.20] |
| 6.2 At 2 years follow up | 1 | 121 | Risk Ratio (M‐H, Fixed, 95% CI) | 1.01 [0.83, 1.23] |
| 7 Satisfaction rate Show forest plot | 4 | Risk Ratio (M‐H, Fixed, 95% CI) | Subtotals only | |
| 7.1 At 1 year follow up | 3 | 352 | Risk Ratio (M‐H, Fixed, 95% CI) | 0.99 [0.93, 1.06] |
| 7.2 At 2 years follow up | 2 | 348 | Risk Ratio (M‐H, Fixed, 95% CI) | 1.02 [0.93, 1.12] |
| 7.3 At 2 to 5 years follow up | 1 | 122 | Risk Ratio (M‐H, Fixed, 95% CI) | 0.93 [0.87, 1.01] |
| 8 Duration of operation (mins) Show forest plot | 3 | 471 | Mean Difference (IV, Fixed, 95% CI) | ‐20.87 [‐22.47, ‐19.28] |
| 9 Operative difficulties Show forest plot | 1 | 139 | Risk Ratio (M‐H, Fixed, 95% CI) | 1.05 [0.49, 2.22] |
| 9.1 Technical complication rate | 1 | 139 | Risk Ratio (M‐H, Fixed, 95% CI) | 1.05 [0.49, 2.22] |
| 10 Inability to work (proportion of women) Show forest plot | 1 | Risk Ratio (M‐H, Fixed, 95% CI) | Subtotals only | |
| 10.1 At 1 year follow up | 1 | 239 | Risk Ratio (M‐H, Fixed, 95% CI) | 1.52 [0.37, 6.22] |
| 10.2 At 2 years follow up | 1 | 227 | Risk Ratio (M‐H, Fixed, 95% CI) | 0.29 [0.03, 2.72] |
| 10.3 At 2 to 5 years follow up | 1 | 210 | Risk Ratio (M‐H, Fixed, 95% CI) | 0.87 [0.26, 2.93] |
| 11 Improvement in dysmenorrhea at 12 months Show forest plot | 1 | 239 | Risk Ratio (M‐H, Fixed, 95% CI) | 0.93 [0.80, 1.09] |
| 12 Improvement in premenstrual symptoms (from moderate/severe) Show forest plot | 1 | Risk Ratio (M‐H, Fixed, 95% CI) | Subtotals only | |
| 12.1 At 1 year follow up | 1 | 185 | Risk Ratio (M‐H, Fixed, 95% CI) | 0.94 [0.74, 1.19] |
| 12.2 At 2 years follow up | 1 | 177 | Risk Ratio (M‐H, Fixed, 95% CI) | 1.03 [0.82, 1.29] |
| 12.3 At 2 to 5 years follow up | 1 | 166 | Risk Ratio (M‐H, Fixed, 95% CI) | 0.99 [0.75, 1.30] |
| 13 Complication rate (proportion of women) Show forest plot | 3 | Risk Ratio (M‐H, Fixed, 95% CI) | Subtotals only | |
| 13.1 Fluid overload | 2 | 332 | Risk Ratio (M‐H, Fixed, 95% CI) | 0.20 [0.02, 1.66] |
| 13.2 Perforation | 2 | 378 | Risk Ratio (M‐H, Fixed, 95% CI) | 0.17 [0.02, 1.42] |
| 13.3 Cervical lacerations | 3 | 471 | Risk Ratio (M‐H, Fixed, 95% CI) | 0.21 [0.04, 1.19] |
| 13.4 Endometritis | 2 | 332 | Risk Ratio (M‐H, Fixed, 95% CI) | 2.45 [0.48, 12.47] |
| 13.5 UTI | 1 | 239 | Risk Ratio (M‐H, Fixed, 95% CI) | 2.74 [0.11, 66.54] |
| 13.6 Hematometra | 2 | 332 | Risk Ratio (M‐H, Fixed, 95% CI) | 0.43 [0.07, 2.84] |
| 13.7 Hydrosalpinx | 1 | 239 | Risk Ratio (M‐H, Fixed, 95% CI) | 0.30 [0.01, 7.39] |
| 13.8 Bleeding | 1 | 93 | Risk Ratio (M‐H, Fixed, 95% CI) | 0.21 [0.01, 4.32] |
| 13.9 Pain | 1 | 139 | Risk Ratio (M‐H, Fixed, 95% CI) | 5.65 [0.30, 107.43] |
| 13.10 Nausea | 1 | 139 | Risk Ratio (M‐H, Fixed, 95% CI) | 0.27 [0.01, 6.50] |
| 13.11 Infection | 1 | 139 | Risk Ratio (M‐H, Fixed, 95% CI) | 0.27 [0.01, 6.50] |
| 14 Requirement for further surgery (any surgery) Show forest plot | 3 | Risk Ratio (M‐H, Fixed, 95% CI) | Subtotals only | |
| 14.1 At 1 year follow up | 2 | 332 | Risk Ratio (M‐H, Fixed, 95% CI) | 0.86 [0.30, 2.47] |
| 14.2 At 2 years follow up | 2 | 392 | Risk Ratio (M‐H, Fixed, 95% CI) | 0.67 [0.35, 1.28] |
| 14.3 At 2 to 5 years follow up | 1 | 122 | Risk Ratio (M‐H, Fixed, 95% CI) | 1.0 [0.64, 1.55] |
| 15 Requirement for further surgery (hyst only) Show forest plot | 2 | Risk Ratio (M‐H, Fixed, 95% CI) | Subtotals only | |
| 15.1 At 1 year follow up | 0 | 0 | Risk Ratio (M‐H, Fixed, 95% CI) | 0.0 [0.0, 0.0] |
| 15.2 At 2 years follow up | 1 | 137 | Risk Ratio (M‐H, Fixed, 95% CI) | 1.04 [0.38, 2.83] |
| 15.3 At 2 to 5 years follow up | 1 | 122 | Risk Ratio (M‐H, Fixed, 95% CI) | 1.0 [0.61, 1.63] |
| Outcome or subgroup title | No. of studies | No. of participants | Statistical method | Effect size |
| 1 Amenorrhoea rate Show forest plot | 1 | Risk Ratio (M‐H, Fixed, 95% CI) | Subtotals only | |
| 1.1 At 6 months follow up | 1 | 70 | Risk Ratio (M‐H, Fixed, 95% CI) | 1.11 [0.61, 2.02] |
| 1.2 At 12 months follow up | 1 | 67 | Risk Ratio (M‐H, Fixed, 95% CI) | 0.75 [0.38, 1.46] |
| 2 PBAC score after treatment Show forest plot | Other data | No numeric data | ||
| 2.1 At 6 months follow up | Other data | No numeric data | ||
| 3 Satisfaction rate Show forest plot | 1 | Risk Ratio (M‐H, Fixed, 95% CI) | Subtotals only | |
| 3.1 At 6 months follow up | 1 | 69 | Risk Ratio (M‐H, Fixed, 95% CI) | 1.04 [0.91, 1.20] |
| 3.2 At 12 months follow up | 1 | 57 | Risk Ratio (M‐H, Fixed, 95% CI) | 0.97 [0.86, 1.09] |
| 4 Operative difficulties Show forest plot | 1 | 70 | Risk Ratio (M‐H, Fixed, 95% CI) | 4.47 [0.22, 89.94] |
| 4.1 Failure of equipment | 1 | 70 | Risk Ratio (M‐H, Fixed, 95% CI) | 4.47 [0.22, 89.94] |
| 5 Euroquol 5D Show forest plot | 1 | Mean Difference (IV, Fixed, 95% CI) | Subtotals only | |
| 5.1 At 6 months follow up | 1 | 70 | Mean Difference (IV, Fixed, 95% CI) | 0.01 [‐0.11, 0.13] |
| 5.2 At 12 months follow up | 1 | 67 | Mean Difference (IV, Fixed, 95% CI) | ‐0.01 [‐0.13, 0.11] |
| 6 Euroquol 5D VAS Show forest plot | 1 | Mean Difference (IV, Fixed, 95% CI) | Subtotals only | |
| 6.1 At 6 months follow up | 1 | 70 | Mean Difference (IV, Fixed, 95% CI) | 1.20 [‐5.95, 8.35] |
| 6.2 At 12 months follow up | 1 | 67 | Mean Difference (IV, Fixed, 95% CI) | 10.10 [2.43, 17.77] |
| 7 SF12 Physical Scale Show forest plot | 1 | Mean Difference (IV, Fixed, 95% CI) | Subtotals only | |
| 7.1 At 6 months follow up | 1 | 70 | Mean Difference (IV, Fixed, 95% CI) | 1.70 [‐2.18, 5.58] |
| 7.2 At 12 months follow up | 1 | 67 | Mean Difference (IV, Fixed, 95% CI) | ‐0.20 [‐3.89, 3.49] |
| 8 SF12 Mental Scale Show forest plot | 1 | Mean Difference (IV, Fixed, 95% CI) | Subtotals only | |
| 8.1 At 6 months follow up | 1 | 70 | Mean Difference (IV, Fixed, 95% CI) | 3.40 [‐0.42, 7.22] |
| 8.2 At 12 months follow up | 1 | 67 | Mean Difference (IV, Fixed, 95% CI) | 2.10 [‐2.04, 6.24] |
| 9 SAQ pleasure scale Show forest plot | 1 | Mean Difference (IV, Fixed, 95% CI) | Subtotals only | |
| 9.1 At 6 months follow up | 1 | 70 | Mean Difference (IV, Fixed, 95% CI) | 0.5 [‐1.30, 2.30] |
| 9.2 At 12 months follow up | 1 | 67 | Mean Difference (IV, Fixed, 95% CI) | ‐0.60 [‐2.68, 1.48] |
| 10 SAQ habit scale Show forest plot | 1 | Mean Difference (IV, Fixed, 95% CI) | Subtotals only | |
| 10.1 At 6 months follow up | 1 | 70 | Mean Difference (IV, Fixed, 95% CI) | ‐0.16 [‐0.42, 0.10] |
| 10.2 At 12 months follow up | 1 | 67 | Mean Difference (IV, Fixed, 95% CI) | ‐0.09 [‐0.27, 0.09] |
| 11 SAQ discomfort scale Show forest plot | 1 | Mean Difference (IV, Fixed, 95% CI) | Subtotals only | |
| 11.1 At 6 months follow up | 1 | 70 | Mean Difference (IV, Fixed, 95% CI) | ‐0.14 [‐0.98, 0.70] |
| 11.2 At 12 months follow up | 1 | 67 | Mean Difference (IV, Fixed, 95% CI) | 0.10 [‐0.67, 0.87] |
| 12 PMS (visual analogue) Show forest plot | Other data | No numeric data | ||
| 12.1 At 6 months follow up | Other data | No numeric data | ||
| 12.2 At 12 months follow up | Other data | No numeric data | ||
| 13 Dysmenorrhoea (visual analogue) Show forest plot | Other data | No numeric data | ||
| 13.1 At 6 months follow up | Other data | No numeric data | ||
| 13.2 At 12 months follow up | Other data | No numeric data | ||
| 14 Pain score Show forest plot | 1 | 70 | Mean Difference (IV, Fixed, 95% CI) | 32.7 [23.72, 41.68] |
| 15 Requirement for further surgery Show forest plot | 1 | Risk Ratio (M‐H, Fixed, 95% CI) | Subtotals only | |
| 15.1 At 6 months follow up | 0 | 0 | Risk Ratio (M‐H, Fixed, 95% CI) | 0.0 [0.0, 0.0] |
| 15.2 At 12 months follow up | 1 | 67 | Risk Ratio (M‐H, Fixed, 95% CI) | 0.78 [0.23, 2.64] |
| Outcome or subgroup title | No. of studies | No. of participants | Statistical method | Effect size |
| 1 Amenorrhoea rate Show forest plot | 1 | Risk Ratio (M‐H, Fixed, 95% CI) | Subtotals only | |
| 1.1 At 6 months follow up | 1 | 49 | Risk Ratio (M‐H, Fixed, 95% CI) | 0.95 [0.31, 2.93] |
| 1.2 At 12 months follow up | 1 | 45 | Risk Ratio (M‐H, Fixed, 95% CI) | 1.21 [0.50, 2.95] |
| 2 Satisfaction rate Show forest plot | 2 | Risk Ratio (M‐H, Fixed, 95% CI) | Subtotals only | |
| 2.1 At 6 months follow up | 1 | 50 | Risk Ratio (M‐H, Fixed, 95% CI) | 1.06 [0.93, 1.20] |
| 2.2 At 12 months follow up | 2 | 122 | Risk Ratio (M‐H, Fixed, 95% CI) | 1.06 [0.96, 1.18] |
| 2.3 At 2 years follow up | 1 | 68 | Risk Ratio (M‐H, Fixed, 95% CI) | 1.35 [1.06, 1.72] |
| 3 Duration of operation (mins) Show forest plot | 1 | 82 | Mean Difference (IV, Fixed, 95% CI) | ‐13.0 [‐15.20, ‐10.80] |
| 4 Duration of operation (mins) Show forest plot | Other data | No numeric data | ||
| 5 Operative difficulties Show forest plot | 1 | 51 | Risk Ratio (M‐H, Fixed, 95% CI) | 7.22 [0.42, 123.83] |
| 5.1 Equipment failure | 1 | 51 | Risk Ratio (M‐H, Fixed, 95% CI) | 7.22 [0.42, 123.83] |
| 6 Hospital stay (days) Show forest plot | 1 | 82 | Mean Difference (IV, Fixed, 95% CI) | ‐0.30 [‐0.52, ‐0.08] |
| 7 Duration of hospital stay (hours) Show forest plot | Other data | No numeric data | ||
| 8 Return to normal activities (days) Show forest plot | 1 | 82 | Mean Difference (IV, Fixed, 95% CI) | ‐2.10 [‐3.38, ‐0.82] |
| 9 Return to normal activities (days) Show forest plot | Other data | No numeric data | ||
| 10 Intraoperative complications (continuous data) Show forest plot | 1 | 82 | Mean Difference (IV, Fixed, 95% CI) | ‐81.8 [‐93.33, ‐70.27] |
| 10.1 Blood loss | 1 | 82 | Mean Difference (IV, Fixed, 95% CI) | ‐81.8 [‐93.33, ‐70.27] |
| 11 Intraoperative complications (dichotomous data) Show forest plot | 1 | Risk Ratio (M‐H, Fixed, 95% CI) | Subtotals only | |
| 11.1 Fluid overload | 1 | 82 | Risk Ratio (M‐H, Fixed, 95% CI) | 0.10 [0.01, 1.67] |
| 11.2 Cervical tear | 1 | 82 | Risk Ratio (M‐H, Fixed, 95% CI) | 0.35 [0.01, 8.34] |
| 11.3 Conversion to hysterectomy | 1 | 88 | Risk Ratio (M‐H, Fixed, 95% CI) | 0.24 [0.01, 4.84] |
| 12 Postoperative pain (continuous data) Show forest plot | 1 | 82 | Mean Difference (IV, Fixed, 95% CI) | ‐0.60 [‐0.88, ‐0.32] |
| 13 Postoperative pain (descriptive data) Show forest plot | Other data | No numeric data | ||
| 14 Postoperative complications Show forest plot | 1 | Risk Ratio (M‐H, Fixed, 95% CI) | Subtotals only | |
| 14.1 Fever | 1 | 82 | Risk Ratio (M‐H, Fixed, 95% CI) | 0.53 [0.05, 5.57] |
| 14.2 Urinary infection or retention | 1 | 82 | Risk Ratio (M‐H, Fixed, 95% CI) | 0.35 [0.01, 8.34] |
| 14.3 Hemorrhage | 1 | 82 | Risk Ratio (M‐H, Fixed, 95% CI) | 1.31 [0.38, 4.54] |
| 14.4 Blood transfusion | 1 | 82 | Risk Ratio (M‐H, Fixed, 95% CI) | 5.24 [0.26, 105.97] |
| 15 Requirement for further surgery Show forest plot | 1 | Risk Ratio (M‐H, Fixed, 95% CI) | Subtotals only | |
| 15.1 At 12 months follow up | 1 | 75 | Risk Ratio (M‐H, Fixed, 95% CI) | 0.51 [0.10, 2.64] |
| 15.2 At 2 years follow up | 1 | 68 | Risk Ratio (M‐H, Fixed, 95% CI) | 0.38 [0.08, 1.81] |
| 16 Requirement for further surgery (hyst only) Show forest plot | 1 | 45 | Risk Ratio (M‐H, Fixed, 95% CI) | 0.12 [0.01, 2.44] |
| 16.1 At 12 months follow up | 1 | 45 | Risk Ratio (M‐H, Fixed, 95% CI) | 0.12 [0.01, 2.44] |
| Outcome or subgroup title | No. of studies | No. of participants | Statistical method | Effect size |
| 1 Amenorrhoea rate Show forest plot | 3 | Risk Ratio (M‐H, Fixed, 95% CI) | Subtotals only | |
| 1.1 At 6 months follow up | 2 | 179 | Risk Ratio (M‐H, Fixed, 95% CI) | 4.39 [2.00, 9.66] |
| 1.2 At 12 months follow up | 3 | 231 | Risk Ratio (M‐H, Fixed, 95% CI) | 3.78 [2.07, 6.91] |
| 1.3 At 2 to 5 years follow up | 1 | 120 | Risk Ratio (M‐H, Fixed, 95% CI) | 1.56 [0.93, 2.64] |
| 2 PBAC score after treatment Show forest plot | Other data | No numeric data | ||
| 2.1 At 12 months follow up | Other data | No numeric data | ||
| 3 Satisfaction rate Show forest plot | 3 | Risk Ratio (M‐H, Fixed, 95% CI) | Subtotals only | |
| 3.1 At 6 months follow up | 2 | 181 | Risk Ratio (M‐H, Fixed, 95% CI) | 1.08 [0.94, 1.24] |
| 3.2 At 12 months follow up | 3 | 230 | Risk Ratio (M‐H, Fixed, 95% CI) | 1.10 [0.99, 1.22] |
| 4 Duration of operation Show forest plot | Other data | No numeric data | ||
| 5 Operative difficulties Show forest plot | 1 | Risk Ratio (M‐H, Fixed, 95% CI) | Subtotals only | |
| 5.1 Technical complication rate | 1 | 55 | Risk Ratio (M‐H, Fixed, 95% CI) | 0.73 [0.13, 3.99] |
| 6 Completion of procedure Show forest plot | 1 | 81 | Risk Ratio (M‐H, Fixed, 95% CI) | 1.05 [0.97, 1.15] |
| 7 SF12 physical score Show forest plot | 1 | 55 | Mean Difference (IV, Fixed, 95% CI) | 1.60 [‐4.27, 7.47] |
| 7.1 At 12 months follow up | 1 | 55 | Mean Difference (IV, Fixed, 95% CI) | 1.60 [‐4.27, 7.47] |
| 8 SF12 mental score Show forest plot | 1 | 55 | Mean Difference (IV, Fixed, 95% CI) | 7.5 [‐0.52, 15.52] |
| 8.1 At 12 months follow up | 1 | 55 | Mean Difference (IV, Fixed, 95% CI) | 7.5 [‐0.52, 15.52] |
| 9 SF‐36 Physical function score Show forest plot | 1 | Mean Difference (IV, Fixed, 95% CI) | Subtotals only | |
| 9.1 At 6 months follow up | 1 | 90 | Mean Difference (IV, Fixed, 95% CI) | 2.0 [‐6.55, 10.55] |
| 9.2 At 12 months follow up | 1 | 78 | Mean Difference (IV, Fixed, 95% CI) | 3.0 [‐6.44, 12.44] |
| 9.3 At 2 to 5 years follow up | 1 | 98 | Mean Difference (IV, Fixed, 95% CI) | 2.0 [‐8.26, 12.26] |
| 10 SF‐36 Role physical Show forest plot | 1 | Mean Difference (IV, Fixed, 95% CI) | Subtotals only | |
| 10.1 At 6 months follow up | 1 | 90 | Mean Difference (IV, Fixed, 95% CI) | 5.0 [‐7.67, 17.67] |
| 10.2 At 12 months follow up | 1 | 78 | Mean Difference (IV, Fixed, 95% CI) | 5.0 [‐6.96, 16.96] |
| 10.3 At 2 to 5 years follow up | 1 | 98 | Mean Difference (IV, Fixed, 95% CI) | 8.0 [‐2.66, 18.66] |
| 11 SF‐36 Role emotional Show forest plot | 1 | Mean Difference (IV, Fixed, 95% CI) | Subtotals only | |
| 11.1 At 6 months follow up | 1 | 90 | Mean Difference (IV, Fixed, 95% CI) | ‐6.0 [‐18.64, 6.64] |
| 11.2 At 12 months follow up | 1 | 78 | Mean Difference (IV, Fixed, 95% CI) | 4.0 [‐1.92, 9.92] |
| 11.3 At 2 to 5 years follow up | 1 | 98 | Mean Difference (IV, Fixed, 95% CI) | ‐9.0 [‐14.45, ‐3.55] |
| 12 SF‐36 Social functioning Show forest plot | 1 | Mean Difference (IV, Fixed, 95% CI) | Subtotals only | |
| 12.1 At 6 months follow up | 1 | 90 | Mean Difference (IV, Fixed, 95% CI) | ‐1.0 [‐9.98, 7.98] |
| 12.2 At 12 months follow up | 1 | 78 | Mean Difference (IV, Fixed, 95% CI) | 3.0 [‐6.17, 12.17] |
| 12.3 At 2 to 5 years follow up | 1 | 98 | Mean Difference (IV, Fixed, 95% CI) | 4.0 [‐5.60, 13.60] |
| 13 SF‐36 Mental health Show forest plot | 1 | Mean Difference (IV, Fixed, 95% CI) | Subtotals only | |
| 13.1 At 6 months follow up | 1 | 90 | Mean Difference (IV, Fixed, 95% CI) | ‐3.0 [‐10.84, 4.84] |
| 13.2 At 12 months follow up | 1 | 78 | Mean Difference (IV, Fixed, 95% CI) | 0.0 [‐8.03, 8.03] |
| 13.3 At 2 to 5 years follow up | 1 | 98 | Mean Difference (IV, Fixed, 95% CI) | ‐5.0 [‐11.39, 1.39] |
| 14 SF‐36 Energy/vitality Show forest plot | 1 | Mean Difference (IV, Fixed, 95% CI) | Subtotals only | |
| 14.1 At 6 months follow up | 1 | 90 | Mean Difference (IV, Fixed, 95% CI) | ‐6.0 [‐13.54, 1.54] |
| 14.2 At 12 months follow up | 1 | 78 | Mean Difference (IV, Fixed, 95% CI) | 9.0 [‐0.44, 18.44] |
| 14.3 At 2 to 5 years follow up | 1 | 98 | Mean Difference (IV, Fixed, 95% CI) | ‐3.0 [‐10.39, 4.39] |
| 15 SF‐36 Pain Show forest plot | 1 | Mean Difference (IV, Fixed, 95% CI) | Subtotals only | |
| 15.1 At 6 months follow up | 1 | 90 | Mean Difference (IV, Fixed, 95% CI) | 2.0 [‐6.00, 12.00] |
| 15.2 At 12 months follow up | 1 | 78 | Mean Difference (IV, Fixed, 95% CI) | ‐1.0 [‐12.61, 10.61] |
| 15.3 At 2 to 5 years follow up | 1 | 98 | Mean Difference (IV, Fixed, 95% CI) | ‐5.0 [‐14.79, 4.79] |
| 16 SF‐36 General health Show forest plot | 1 | Mean Difference (IV, Fixed, 95% CI) | Subtotals only | |
| 16.1 At 6 months follow up | 1 | 90 | Mean Difference (IV, Fixed, 95% CI) | ‐5.0 [‐13.30, 3.30] |
| 16.2 At 12 months follow up | 1 | 78 | Mean Difference (IV, Fixed, 95% CI) | 6.0 [‐4.10, 16.10] |
| 16.3 At 2 to 5 years follow up | 1 | 98 | Mean Difference (IV, Fixed, 95% CI) | 6.0 [‐5.72, 17.72] |
| 17 RSCL Physical symptoms Show forest plot | 1 | Mean Difference (IV, Fixed, 95% CI) | Subtotals only | |
| 17.1 At 6 months follow up | 1 | 90 | Mean Difference (IV, Fixed, 95% CI) | 1.0 [‐3.94, 5.94] |
| 17.2 At 12 months follow up | 1 | 78 | Mean Difference (IV, Fixed, 95% CI) | ‐4.0 [‐8.56, 0.56] |
| 18 RSCL Psychological distress Show forest plot | 1 | Mean Difference (IV, Fixed, 95% CI) | Subtotals only | |
| 18.1 At 6 months follow up | 1 | 90 | Mean Difference (IV, Fixed, 95% CI) | ‐1.0 [‐10.14, 8.14] |
| 18.2 At 12 months follow up | 1 | 78 | Mean Difference (IV, Fixed, 95% CI) | ‐1.0 [‐7.92, 5.92] |
| 19 RSCL Activity level Show forest plot | 1 | Mean Difference (IV, Fixed, 95% CI) | Subtotals only | |
| 19.1 At 6 months follow up | 1 | 90 | Mean Difference (IV, Fixed, 95% CI) | ‐1.0 [‐3.35, 1.35] |
| 19.2 At 12 months follow up | 1 | 78 | Mean Difference (IV, Fixed, 95% CI) | ‐2.0 [‐4.32, 0.32] |
| 20 RSCL Overall quality of life Show forest plot | 1 | Mean Difference (IV, Fixed, 95% CI) | Subtotals only | |
| 20.1 At 6 months follow up | 1 | 90 | Mean Difference (IV, Fixed, 95% CI) | ‐2.0 [‐12.29, 8.29] |
| 20.2 At 12 months follow up | 1 | 78 | Mean Difference (IV, Fixed, 95% CI) | ‐9.0 [‐18.77, 0.77] |
| 21 SDS Depression Show forest plot | 1 | Mean Difference (IV, Fixed, 95% CI) | Subtotals only | |
| 21.1 At 6 months follow up | 1 | 90 | Mean Difference (IV, Fixed, 95% CI) | 2.0 [‐1.55, 5.55] |
| 21.2 At 12 months follow up | 1 | 78 | Mean Difference (IV, Fixed, 95% CI) | ‐1.0 [‐5.24, 3.24] |
| 22 Multi‐attribute utility tool Show forest plot | 1 | 51 | Mean Difference (IV, Fixed, 95% CI) | 8.80 [‐6.08, 23.68] |
| 22.1 At 12 months follow up | 1 | 51 | Mean Difference (IV, Fixed, 95% CI) | 8.80 [‐6.08, 23.68] |
| 23 Menorrhagia Outcome Questionnaire Show forest plot | 1 | 51 | Mean Difference (IV, Fixed, 95% CI) | ‐0.60 [‐3.87, 2.67] |
| 23.1 At 12 months follow up | 1 | 51 | Mean Difference (IV, Fixed, 95% CI) | ‐0.60 [‐3.87, 2.67] |
| 24 EQ 5‐D utility Show forest plot | 1 | 49 | Mean Difference (IV, Fixed, 95% CI) | 0.03 [‐0.16, 0.22] |
| 24.1 At 12 months follow up | 1 | 49 | Mean Difference (IV, Fixed, 95% CI) | 0.03 [‐0.16, 0.22] |
| 25 Eq 5‐D health thermometer Show forest plot | 1 | 43 | Mean Difference (IV, Fixed, 95% CI) | 4.8 [‐10.07, 19.67] |
| 25.1 At 12 months follow up | 1 | 43 | Mean Difference (IV, Fixed, 95% CI) | 4.8 [‐10.07, 19.67] |
| 26 Dysmenorrhoea rate Show forest plot | 1 | Risk Ratio (M‐H, Fixed, 95% CI) | Subtotals only | |
| 26.1 At 6 months follow up | 1 | 126 | Risk Ratio (M‐H, Fixed, 95% CI) | 0.69 [0.26, 1.86] |
| 26.2 At 12 months follow up | 1 | 126 | Risk Ratio (M‐H, Fixed, 95% CI) | 0.52 [0.18, 1.51] |
| 26.3 At 2 to 5 years follow up | 1 | 97 | Risk Ratio (M‐H, Fixed, 95% CI) | 0.61 [0.26, 1.44] |
| 27 Dysmenorrhoea rate (VAS score) Show forest plot | Other data | No numeric data | ||
| 27.1 At 12 months follow up | Other data | No numeric data | ||
| 28 Improvement in dysmenorrhoea Show forest plot | 1 | 44 | Risk Ratio (M‐H, Fixed, 95% CI) | 1.37 [0.89, 2.10] |
| 28.1 At 12 months follow up | 1 | 44 | Risk Ratio (M‐H, Fixed, 95% CI) | 1.37 [0.89, 2.10] |
| 29 PMS rate (VAS score) Show forest plot | Other data | No numeric data | ||
| 29.1 At 12 months follow up | Other data | No numeric data | ||
| 30 Improvement in PMS (emotional) Show forest plot | 1 | 36 | Risk Ratio (M‐H, Fixed, 95% CI) | 0.8 [0.45, 1.43] |
| 30.1 At 12 months follow up | 1 | 36 | Risk Ratio (M‐H, Fixed, 95% CI) | 0.8 [0.45, 1.43] |
| 31 Improvement in PMS (physical) Show forest plot | 1 | 36 | Risk Ratio (M‐H, Fixed, 95% CI) | 1.3 [0.72, 2.34] |
| 31.1 At 12 months follow up | 1 | 36 | Risk Ratio (M‐H, Fixed, 95% CI) | 1.3 [0.72, 2.34] |
| 32 Time taken off work (days) Show forest plot | Other data | No numeric data | ||
| 33 Time to resume normal activities (days) Show forest plot | Other data | No numeric data | ||
| 34 Postoperative complication rate Show forest plot | 1 | Risk Ratio (M‐H, Fixed, 95% CI) | Subtotals only | |
| 34.1 Infection (endometritis) | 1 | 73 | Risk Ratio (M‐H, Fixed, 95% CI) | 0.30 [0.06, 1.42] |
| 35 Requirement for further surgery (ablation or hyst) Show forest plot | 3 | Risk Ratio (M‐H, Fixed, 95% CI) | Subtotals only | |
| 35.1 At 6 months follow up | 1 | 53 | Risk Ratio (M‐H, Fixed, 95% CI) | 0.0 [0.0, 0.0] |
| 35.2 At 12 months follow up | 2 | 135 | Risk Ratio (M‐H, Fixed, 95% CI) | 1.36 [0.34, 5.42] |
| 35.3 At 2 to 5 years follow up | 1 | 120 | Risk Ratio (M‐H, Fixed, 95% CI) | 0.72 [0.28, 1.89] |
| 36 Requirement for further surgery (hyst only) Show forest plot | 2 | Risk Ratio (M‐H, Fixed, 95% CI) | Subtotals only | |
| 36.1 At 12 months follow up | 2 | 207 | Risk Ratio (M‐H, Fixed, 95% CI) | 0.59 [0.18, 1.93] |
| 36.2 At 2 to 5 years follow up | 1 | 120 | Risk Ratio (M‐H, Fixed, 95% CI) | 0.77 [0.27, 2.20] |
| Outcome or subgroup title | No. of studies | No. of participants | Statistical method | Effect size |
| 1 Amenorrhoea rate Show forest plot | 1 | Risk Ratio (M‐H, Fixed, 95% CI) | Subtotals only | |
| 1.1 At 6 months follow up | 1 | 277 | Risk Ratio (M‐H, Fixed, 95% CI) | 1.50 [1.07, 2.12] |
| 1.2 At 12 months follow up | 1 | 282 | Risk Ratio (M‐H, Fixed, 95% CI) | 1.10 [0.82, 1.47] |
| 2 PBAC score at 12 months follow up Show forest plot | Other data | No numeric data | ||
| 3 Satisfaction at 12 months follow up Show forest plot | 1 | 278 | Risk Ratio (M‐H, Fixed, 95% CI) | 1.00 [0.88, 1.14] |
| 4 Operative difficulties causing failure Show forest plot | 1 | Risk Ratio (M‐H, Fixed, 95% CI) | Subtotals only | |
| 4.1 Failure of device | 1 | 314 | Risk Ratio (M‐H, Fixed, 95% CI) | 0.09 [0.01, 0.70] |
| 4.2 Unsuitable cavity | 1 | 314 | Risk Ratio (M‐H, Fixed, 95% CI) | 0.75 [0.17, 3.30] |
| 4.3 Device not sterile | 1 | 314 | Risk Ratio (M‐H, Fixed, 95% CI) | 5.0 [0.24, 103.32] |
| 5 Operation time (mins) Show forest plot | 1 | 314 | Mean Difference (IV, Fixed, 95% CI) | ‐6.60 [‐7.36, ‐5.84] |
| 6 Proportion choosing local anaesthesia Show forest plot | 1 | 314 | Risk Ratio (M‐H, Fixed, 95% CI) | 1.01 [0.79, 1.31] |
| 7 Proportion requiring opiate analgesia Show forest plot | 1 | 314 | Risk Ratio (M‐H, Fixed, 95% CI) | 0.92 [0.83, 1.01] |
| 8 Proportion requiring overnight stay Show forest plot | 1 | 314 | Risk Ratio (M‐H, Fixed, 95% CI) | 0.66 [0.42, 1.04] |
| 9 Quality of life scores: EQ5D Show forest plot | 1 | 285 | Mean Difference (IV, Fixed, 95% CI) | 0.02 [‐0.04, 0.08] |
| 10 Quality of life scores: SF12 Show forest plot | 1 | Mean Difference (IV, Fixed, 95% CI) | Subtotals only | |
| 10.1 Physical score | 1 | 285 | Mean Difference (IV, Fixed, 95% CI) | ‐0.70 [‐2.64, 1.24] |
| 10.2 Mental score | 1 | 285 | Mean Difference (IV, Fixed, 95% CI) | ‐1.20 [‐3.67, 1.27] |
| 11 Requirement for further surgery at 12 months follow up (hyst only) Show forest plot | 1 | 285 | Risk Ratio (M‐H, Fixed, 95% CI) | 0.94 [0.31, 2.84] |
| 12 Pain score at 12 months follow up Show forest plot | Other data | No numeric data | ||
| Outcome or subgroup title | No. of studies | No. of participants | Statistical method | Effect size |
| 1 Amenorrhoea rates Show forest plot | 1 | Risk Ratio (M‐H, Fixed, 95% CI) | Subtotals only | |
| 1.1 At 6 months follow up | 1 | 150 | Risk Ratio (M‐H, Fixed, 95% CI) | 2.27 [1.25, 4.12] |
| 1.2 At 12 months follow up | 1 | 146 | Risk Ratio (M‐H, Fixed, 95% CI) | 1.95 [1.21, 3.15] |
| 1.3 2 to 5 years follow up | 1 | 139 | Risk Ratio (M‐H, Fixed, 95% CI) | 1.57 [1.06, 2.31] |
| 2 Satisfaction Show forest plot | 1 | Risk Ratio (M‐H, Fixed, 95% CI) | Subtotals only | |
| 2.1 At 6 months follow up | 1 | 150 | Risk Ratio (M‐H, Fixed, 95% CI) | 1.44 [1.17, 1.77] |
| 2.2 At 12 months follow up | 1 | 146 | Risk Ratio (M‐H, Fixed, 95% CI) | 1.11 [1.02, 1.21] |
| 2.3 2 to 5 years follow up | 1 | 139 | Risk Ratio (M‐H, Fixed, 95% CI) | 1.62 [1.23, 2.13] |
| 3 Absence of dysmenorrhoea Show forest plot | 1 | Risk Ratio (M‐H, Fixed, 95% CI) | Subtotals only | |
| 3.1 At 12 months follow up | 1 | 146 | Risk Ratio (M‐H, Fixed, 95% CI) | 0.92 [0.79, 1.06] |
| 3.2 2 to 5 years follow up | 1 | 139 | Risk Ratio (M‐H, Fixed, 95% CI) | 1.32 [1.00, 1.74] |
| 4 Duration of procedure (mins) Show forest plot | Other data | No numeric data | ||
| 5 Postoperative complications Show forest plot | 1 | Risk Ratio (M‐H, Fixed, 95% CI) | Subtotals only | |
| 5.1 Uterine perforation | 1 | 156 | Risk Ratio (M‐H, Fixed, 95% CI) | 2.71 [0.11, 65.54] |
| 5.2 Saline leakage | 1 | 156 | Risk Ratio (M‐H, Fixed, 95% CI) | 0.13 [0.01, 2.46] |
| 6 Requirement for further surgery (any) Show forest plot | 1 | Risk Ratio (M‐H, Fixed, 95% CI) | Subtotals only | |
| 6.1 At 12 months follow up | 1 | 160 | Risk Ratio (M‐H, Fixed, 95% CI) | 0.28 [0.11, 0.72] |
| 6.2 2 to 5 years follow up | 1 | 136 | Risk Ratio (M‐H, Fixed, 95% CI) | 0.44 [0.23, 0.83] |
| 7 Requirement for further surgery (hyst only) Show forest plot | 1 | Risk Ratio (M‐H, Fixed, 95% CI) | Subtotals only | |
| 7.1 At 12 months follow up | 1 | 160 | Risk Ratio (M‐H, Fixed, 95% CI) | 0.42 [0.14, 1.32] |
| 7.2 2 to 5 years follow up | 1 | 136 | Risk Ratio (M‐H, Fixed, 95% CI) | 0.63 [0.29, 1.38] |
| Outcome or subgroup title | No. of studies | No. of participants | Statistical method | Effect size |
| 1 Amenorrhoea rate Show forest plot | 1 | 100 | Risk Ratio (M‐H, Fixed, 95% CI) | 4.5 [2.33, 8.69] |
| 1.1 At 3 years follow up | 1 | 100 | Risk Ratio (M‐H, Fixed, 95% CI) | 4.5 [2.33, 8.69] |
| 2 Amenorrhoea and normal menses rate Show forest plot | 1 | 100 | Risk Ratio (M‐H, Fixed, 95% CI) | 1.86 [1.30, 2.66] |
| 2.1 At 3 years follow up | 1 | 100 | Risk Ratio (M‐H, Fixed, 95% CI) | 1.86 [1.30, 2.66] |
| 3 Postoperative complications Show forest plot | 1 | Risk Ratio (M‐H, Fixed, 95% CI) | Subtotals only | |
| 3.1 Bleeding | 1 | 100 | Risk Ratio (M‐H, Fixed, 95% CI) | 0.21 [0.07, 0.70] |
| 3.2 Infection/leukorrhea | 1 | 100 | Risk Ratio (M‐H, Fixed, 95% CI) | 0.8 [0.23, 2.81] |
| 3.3 Uterine perforation | 1 | 100 | Risk Ratio (M‐H, Fixed, 95% CI) | 0.14 [0.01, 2.70] |
| 4 Hospital stay (days) Show forest plot | 1 | 100 | Mean Difference (IV, Fixed, 95% CI) | 1.6 [1.18, 2.02] |
| 5 Failure rate of procedure Show forest plot | 1 | 100 | Risk Ratio (M‐H, Fixed, 95% CI) | 0.29 [0.12, 0.74] |
| 6 Requirement for further surgery (hyst only) Show forest plot | 1 | 100 | Risk Ratio (M‐H, Fixed, 95% CI) | 0.42 [0.16, 1.10] |
| 6.1 Within 3 years | 1 | 100 | Risk Ratio (M‐H, Fixed, 95% CI) | 0.42 [0.16, 1.10] |
| Outcome or subgroup title | No. of studies | No. of participants | Statistical method | Effect size |
| 1 Amenorrhoea rate Show forest plot | 12 | Risk Ratio (M‐H, Random, 95% CI) | Subtotals only | |
| 1.1 At 6 months follow up | 1 | 49 | Risk Ratio (M‐H, Random, 95% CI) | 1.27 [0.91, 1.77] |
| 1.2 At 1 year follow up | 12 | 2085 | Risk Ratio (M‐H, Random, 95% CI) | 0.94 [0.74, 1.20] |
| 1.3 At 2 years follow up | 3 | 701 | Risk Ratio (M‐H, Random, 95% CI) | 0.97 [0.72, 1.30] |
| 1.4 At 2 to 5 years follow up | 4 | 672 | Risk Ratio (M‐H, Random, 95% CI) | 1.16 [0.78, 1.72] |
| 1.5 > 5 years follow up | 1 | 189 | Risk Ratio (M‐H, Random, 95% CI) | 0.94 [0.83, 1.05] |
| 2 Satisfaction rate Show forest plot | 13 | Risk Ratio (M‐H, Random, 95% CI) | Subtotals only | |
| 2.1 At 1 year follow up | 11 | 1690 | Risk Ratio (M‐H, Random, 95% CI) | 1.00 [0.97, 1.02] |
| 2.2 At 6 months follow up | 1 | 50 | Risk Ratio (M‐H, Random, 95% CI) | 1.06 [0.93, 1.20] |
| 2.3 At 2 years follow up | 5 | 802 | Risk Ratio (M‐H, Random, 95% CI) | 1.09 [0.99, 1.21] |
| 2.4 At 2 to 5 years follow up | 4 | 672 | Risk Ratio (M‐H, Random, 95% CI) | 1.02 [0.93, 1.13] |
| 2.5 > 5 years follow up | 1 | 263 | Risk Ratio (M‐H, Random, 95% CI) | 1.14 [0.92, 1.42] |
| 3 Success of treatment (PBAC<75 or acceptable improvement) Show forest plot | 6 | Risk Ratio (M‐H, Fixed, 95% CI) | Subtotals only | |
| 3.1 At 12 months follow up | 6 | 1375 | Risk Ratio (M‐H, Fixed, 95% CI) | 1.02 [0.97, 1.08] |
| 3.2 At 2 to 5 years follow up | 1 | 236 | Risk Ratio (M‐H, Fixed, 95% CI) | 1.12 [0.97, 1.28] |
| 3.3 > 5 years follow up | 1 | 263 | Risk Ratio (M‐H, Fixed, 95% CI) | 1.08 [0.87, 1.34] |
| 4 Operative difficulties Show forest plot | 5 | Risk Ratio (M‐H, Random, 95% CI) | Subtotals only | |
| 4.1 Equipment failure | 3 | 384 | Risk Ratio (M‐H, Random, 95% CI) | 4.26 [1.46, 12.43] |
| 4.2 Procedure abandoned | 3 | 629 | Risk Ratio (M‐H, Random, 95% CI) | 1.18 [0.38, 3.67] |
| 5 Duration of operation (mins) Show forest plot | 9 | 1762 | Mean Difference (IV, Random, 95% CI) | ‐14.86 [‐19.68, ‐10.05] |
| 6 Proportion having local anaesthesia (%) Show forest plot | 6 | 1434 | Risk Ratio (M‐H, Random, 95% CI) | 2.78 [1.76, 4.40] |
| 7 Inability to work Show forest plot | 2 | 479 | Risk Ratio (M‐H, Random, 95% CI) | 0.84 [0.30, 2.30] |
| 8 Operative or postoperative complication rate Show forest plot | 11 | Risk Ratio (M‐H, Random, 95% CI) | Subtotals only | |
| 8.1 Fluid overload | 4 | 681 | Risk Ratio (M‐H, Random, 95% CI) | 0.18 [0.04, 0.79] |
| 8.2 Perforation | 8 | 1885 | Risk Ratio (M‐H, Random, 95% CI) | 0.32 [0.10, 1.01] |
| 8.3 Cervical lacerations | 8 | 1676 | Risk Ratio (M‐H, Random, 95% CI) | 0.22 [0.08, 0.61] |
| 8.4 Endometritis | 5 | 1188 | Risk Ratio (M‐H, Random, 95% CI) | 1.25 [0.45, 3.49] |
| 8.5 UTI | 8 | 1834 | Risk Ratio (M‐H, Random, 95% CI) | 0.89 [0.44, 1.80] |
| 8.6 Hematometra | 5 | 1133 | Risk Ratio (M‐H, Random, 95% CI) | 0.32 [0.12, 0.85] |
| 8.7 Hydrosalpinx | 1 | 239 | Risk Ratio (M‐H, Random, 95% CI) | 0.30 [0.01, 7.39] |
| 8.8 Haemorrhage | 5 | 982 | Risk Ratio (M‐H, Random, 95% CI) | 0.74 [0.29, 1.91] |
| 8.9 Muscle fasciculation | 1 | 267 | Risk Ratio (M‐H, Random, 95% CI) | 2.57 [0.11, 62.41] |
| 8.10 Fever | 3 | 671 | Risk Ratio (M‐H, Random, 95% CI) | 0.92 [0.20, 4.29] |
| 8.11 Nausea/vomiting | 4 | 997 | Risk Ratio (M‐H, Random, 95% CI) | 1.98 [1.30, 3.02] |
| 8.12 Myometritis | 1 | 267 | Risk Ratio (M‐H, Random, 95% CI) | 0.29 [0.01, 6.93] |
| 8.13 Pelvic inflammatory disease | 1 | 265 | Risk Ratio (M‐H, Random, 95% CI) | 1.03 [0.09, 11.19] |
| 8.14 Pelvic abscess | 1 | 265 | Risk Ratio (M‐H, Random, 95% CI) | 0.17 [0.01, 4.19] |
| 8.15 Cervical stenosis | 1 | 322 | Risk Ratio (M‐H, Random, 95% CI) | 1.5 [0.06, 36.52] |
| 8.16 Uterine cramping | 2 | 601 | Risk Ratio (M‐H, Random, 95% CI) | 1.21 [1.01, 1.44] |
| 8.17 Severe pelvic pain | 3 | 683 | Risk Ratio (M‐H, Random, 95% CI) | 0.87 [0.19, 3.98] |
| 8.18 External burns | 1 | 269 | Risk Ratio (M‐H, Random, 95% CI) | 2.32 [0.11, 47.89] |
| 8.19 Blood transfusion | 1 | 82 | Risk Ratio (M‐H, Random, 95% CI) | 5.24 [0.26, 105.97] |
| 9 Requirement for any additional surgery Show forest plot | 9 | Risk Ratio (M‐H, Random, 95% CI) | Subtotals only | |
| 9.1 In 1 year follow up | 7 | 1028 | Risk Ratio (M‐H, Random, 95% CI) | 0.77 [0.46, 1.28] |
| 9.2 In 2 years follow up | 5 | 988 | Risk Ratio (M‐H, Random, 95% CI) | 0.83 [0.52, 1.32] |
| 9.3 In 2 to 5 years follow up | 3 | 647 | Risk Ratio (M‐H, Random, 95% CI) | 0.95 [0.72, 1.26] |
| 9.4 > 5 years follow up | 1 | 263 | Risk Ratio (M‐H, Random, 95% CI) | 0.69 [0.48, 0.99] |
| 10 Requirement for further surgery (hyst only) Show forest plot | 9 | Risk Ratio (M‐H, Random, 95% CI) | Subtotals only | |
| 10.1 At 1 year follow up | 4 | 772 | Risk Ratio (M‐H, Random, 95% CI) | 0.72 [0.37, 1.39] |
| 10.2 At 2 years follow up | 4 | 920 | Risk Ratio (M‐H, Random, 95% CI) | 0.86 [0.52, 1.42] |
| 10.3 At 2 to 5 years follow up | 4 | 758 | Risk Ratio (M‐H, Random, 95% CI) | 0.85 [0.59, 1.22] |
| 10.4 > 5 years follow up | 1 | 263 | Risk Ratio (M‐H, Random, 95% CI) | 0.60 [0.38, 0.96] |