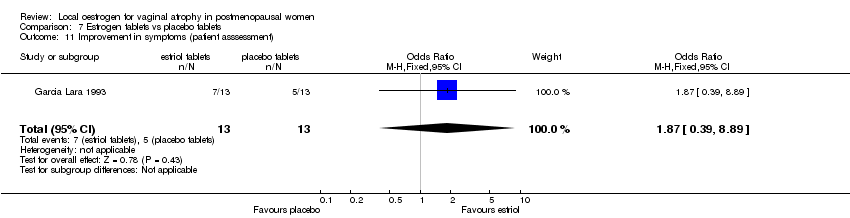
| 1 Improvement in symptoms (patient assessment) | 0 | 0 | Mean Difference (IV, Fixed, 95% CI) | 0.0 [0.0, 0.0] |
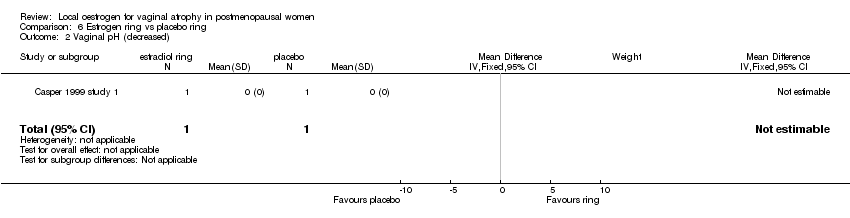
| 2 Vaginal pH (decrease) Show forest plot | 1 | 146 | Mean Difference (IV, Fixed, 95% CI) | ‐0.20 [‐0.38, ‐0.02] |
|
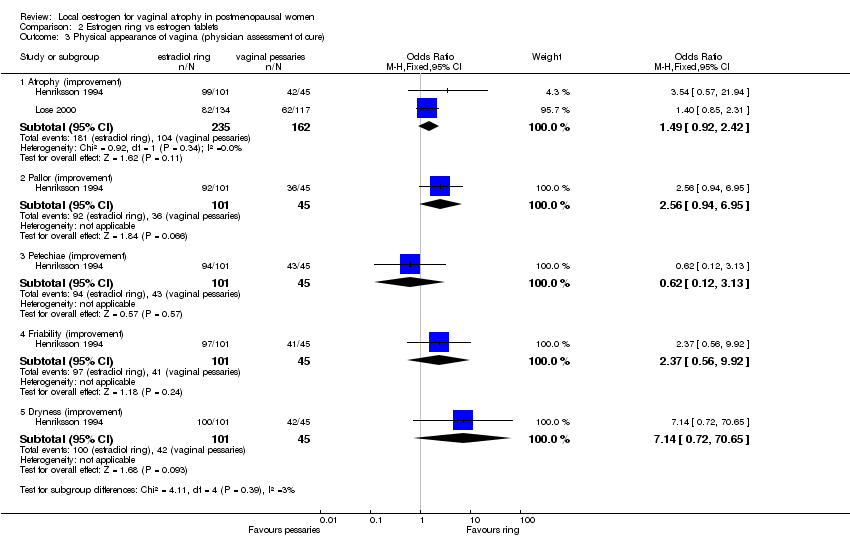
| 3 Physical appearance of vagina (physician assessment of cure) Show forest plot | 2 | | Odds Ratio (M‐H, Fixed, 95% CI) | Subtotals only |
|
| 3.1 Atrophy (improvement) | 2 | 397 | Odds Ratio (M‐H, Fixed, 95% CI) | 1.49 [0.92, 2.42] |
| 3.2 Pallor (improvement) | 1 | 146 | Odds Ratio (M‐H, Fixed, 95% CI) | 2.56 [0.94, 6.95] |
| 3.3 Petechiae (improvement) | 1 | 146 | Odds Ratio (M‐H, Fixed, 95% CI) | 0.62 [0.12, 3.13] |
| 3.4 Friability (improvement) | 1 | 146 | Odds Ratio (M‐H, Fixed, 95% CI) | 2.37 [0.56, 9.92] |
| 3.5 Dryness (improvement) | 1 | 146 | Odds Ratio (M‐H, Fixed, 95% CI) | 7.14 [0.72, 70.65] |
| 4 Symptom improvement or cure (patient assessment) Show forest plot | 3 | | Odds Ratio (M‐H, Fixed, 95% CI) | Subtotals only |
|
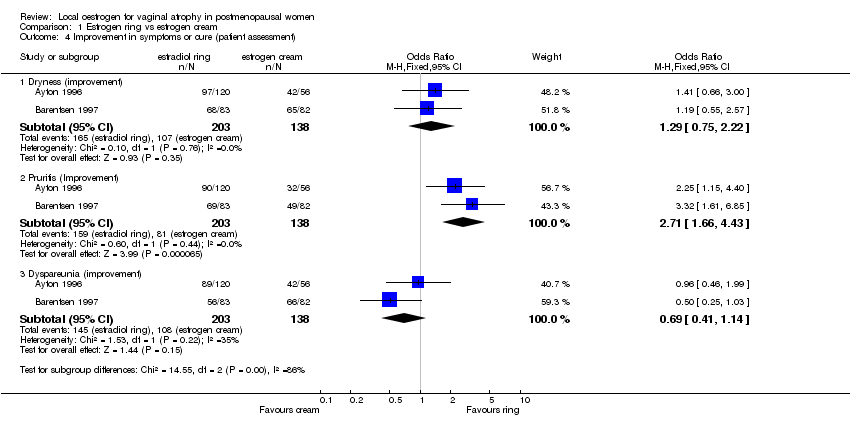
| 4.1 Vaginal dryness | 2 | 397 | Odds Ratio (M‐H, Fixed, 95% CI) | 0.40 [0.24, 0.64] |
| 4.2 Pruritis | 2 | 316 | Odds Ratio (M‐H, Fixed, 95% CI) | 1.59 [0.85, 2.99] |
| 4.3 Dyspareunia | 3 | 567 | Odds Ratio (M‐H, Fixed, 95% CI) | 0.53 [0.36, 0.78] |
| 4.4 Dysuria | 2 | 421 | Odds Ratio (M‐H, Fixed, 95% CI) | 1.16 [0.72, 1.87] |
| 4.5 Nocturia | 1 | 251 | Odds Ratio (M‐H, Fixed, 95% CI) | 0.71 [0.40, 1.24] |
| 4.6 Urgency | 2 | 421 | Odds Ratio (M‐H, Fixed, 95% CI) | 0.79 [0.51, 1.22] |
| 4.7 Frequency | 2 | 421 | Odds Ratio (M‐H, Fixed, 95% CI) | 0.63 [0.41, 0.95] |
| 4.8 Urge incontinence | 1 | 251 | Odds Ratio (M‐H, Fixed, 95% CI) | 0.80 [0.46, 1.40] |
| 4.9 Stress incontinence | 1 | 251 | Odds Ratio (M‐H, Fixed, 95% CI) | 0.63 [0.37, 1.09] |
| 4.10 atrophy(symptom free) | 1 | 170 | Odds Ratio (M‐H, Fixed, 95% CI) | 1.18 [0.62, 2.27] |
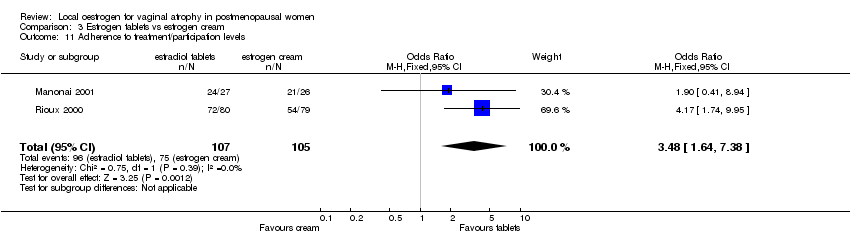
| 5 Adherence to treatment Show forest plot | 1 | 146 | Odds Ratio (M‐H, Fixed, 95% CI) | 1.69 [0.66, 4.31] |
|
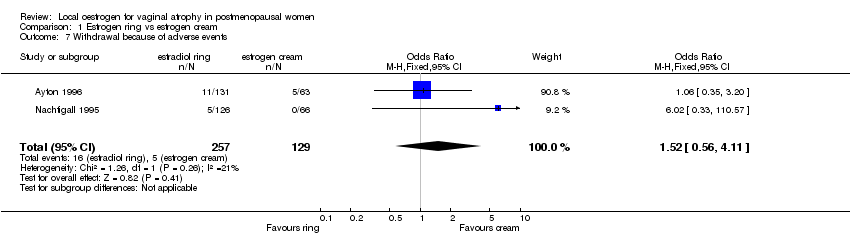
| 6 Withdrawal because of adverse events Show forest plot | 1 | 251 | Odds Ratio (M‐H, Fixed, 95% CI) | 1.47 [0.34, 6.30] |
|
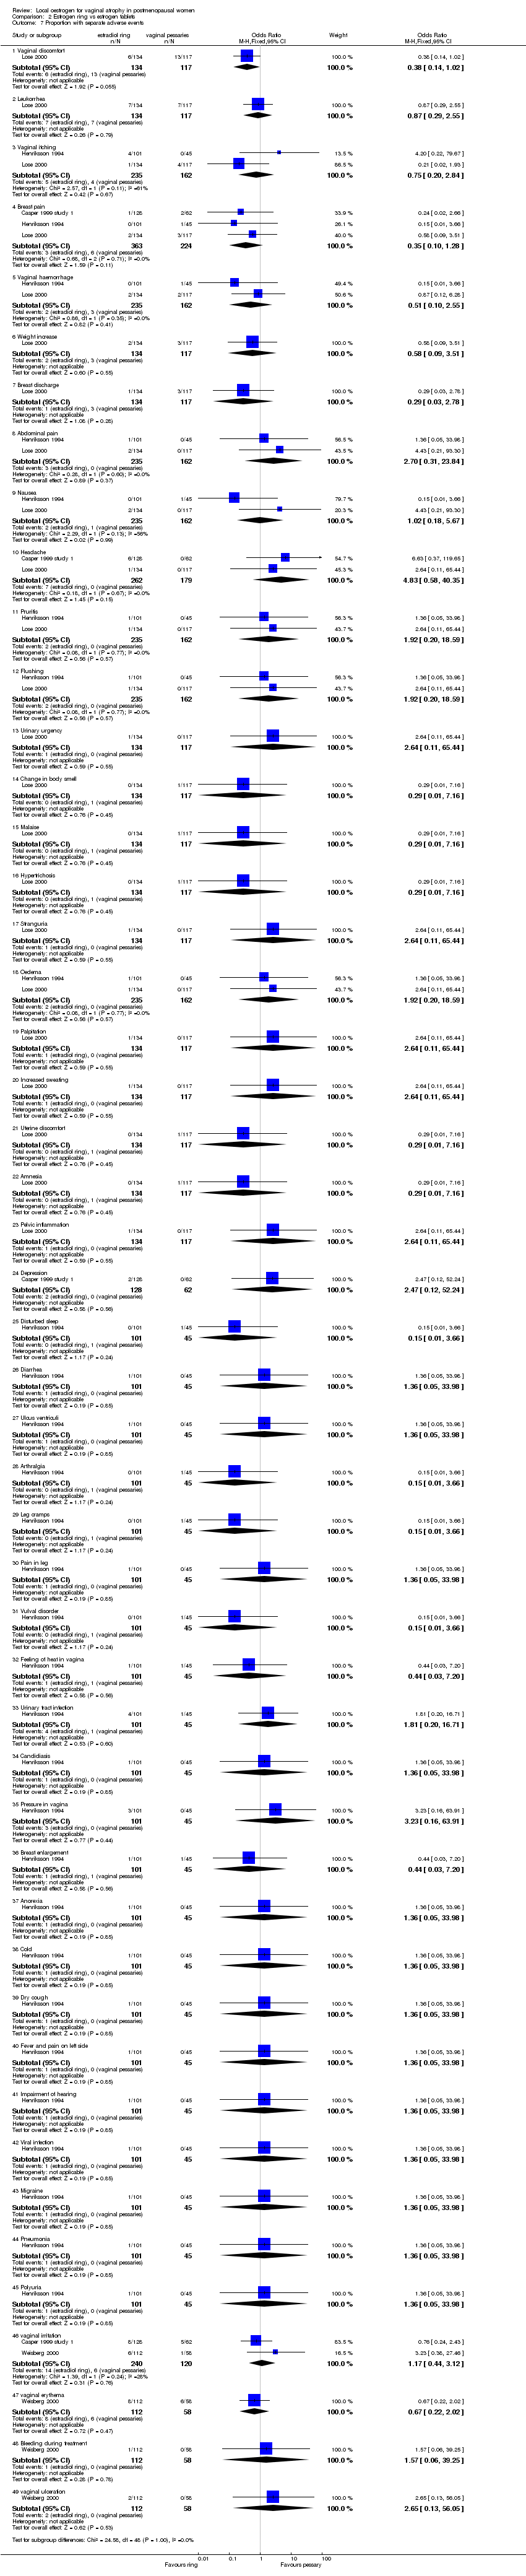
| 7 Proportion with separate adverse events Show forest plot | 4 | | Odds Ratio (M‐H, Fixed, 95% CI) | Subtotals only |
|
| 7.1 Vaginal discomfort | 1 | 251 | Odds Ratio (M‐H, Fixed, 95% CI) | 0.38 [0.14, 1.02] |
| 7.2 Leukorrhea | 1 | 251 | Odds Ratio (M‐H, Fixed, 95% CI) | 0.87 [0.29, 2.55] |
| 7.3 Vaginal itching | 2 | 397 | Odds Ratio (M‐H, Fixed, 95% CI) | 0.75 [0.20, 2.84] |
| 7.4 Breast pain | 3 | 587 | Odds Ratio (M‐H, Fixed, 95% CI) | 0.35 [0.10, 1.28] |
| 7.5 Vaginal haemorrhage | 2 | 397 | Odds Ratio (M‐H, Fixed, 95% CI) | 0.51 [0.10, 2.55] |
| 7.6 Weight increase | 1 | 251 | Odds Ratio (M‐H, Fixed, 95% CI) | 0.58 [0.09, 3.51] |
| 7.7 Breast discharge | 1 | 251 | Odds Ratio (M‐H, Fixed, 95% CI) | 0.29 [0.03, 2.78] |
| 7.8 Abdominal pain | 2 | 397 | Odds Ratio (M‐H, Fixed, 95% CI) | 2.70 [0.31, 23.84] |
| 7.9 Nausea | 2 | 397 | Odds Ratio (M‐H, Fixed, 95% CI) | 1.02 [0.18, 5.67] |
| 7.10 Headache | 2 | 441 | Odds Ratio (M‐H, Fixed, 95% CI) | 4.83 [0.58, 40.35] |
| 7.11 Pruritis | 2 | 397 | Odds Ratio (M‐H, Fixed, 95% CI) | 1.92 [0.20, 18.59] |
| 7.12 Flushing | 2 | 397 | Odds Ratio (M‐H, Fixed, 95% CI) | 1.92 [0.20, 18.59] |
| 7.13 Urinary urgency | 1 | 251 | Odds Ratio (M‐H, Fixed, 95% CI) | 2.64 [0.11, 65.44] |
| 7.14 Change in body smell | 1 | 251 | Odds Ratio (M‐H, Fixed, 95% CI) | 0.29 [0.01, 7.16] |
| 7.15 Malaise | 1 | 251 | Odds Ratio (M‐H, Fixed, 95% CI) | 0.29 [0.01, 7.16] |
| 7.16 Hypertrichosis | 1 | 251 | Odds Ratio (M‐H, Fixed, 95% CI) | 0.29 [0.01, 7.16] |
| 7.17 Stranguria | 1 | 251 | Odds Ratio (M‐H, Fixed, 95% CI) | 2.64 [0.11, 65.44] |
| 7.18 Oedema | 2 | 397 | Odds Ratio (M‐H, Fixed, 95% CI) | 1.92 [0.20, 18.59] |
| 7.19 Palpitation | 1 | 251 | Odds Ratio (M‐H, Fixed, 95% CI) | 2.64 [0.11, 65.44] |
| 7.20 Increased sweating | 1 | 251 | Odds Ratio (M‐H, Fixed, 95% CI) | 2.64 [0.11, 65.44] |
| 7.21 Uterine discomfort | 1 | 251 | Odds Ratio (M‐H, Fixed, 95% CI) | 0.29 [0.01, 7.16] |
| 7.22 Amnesia | 1 | 251 | Odds Ratio (M‐H, Fixed, 95% CI) | 0.29 [0.01, 7.16] |
| 7.23 Pelvic inflammation | 1 | 251 | Odds Ratio (M‐H, Fixed, 95% CI) | 2.64 [0.11, 65.44] |
| 7.24 Depression | 1 | 190 | Odds Ratio (M‐H, Fixed, 95% CI) | 2.47 [0.12, 52.24] |
| 7.25 Disturbed sleep | 1 | 146 | Odds Ratio (M‐H, Fixed, 95% CI) | 0.15 [0.01, 3.66] |
| 7.26 Diarrhea | 1 | 146 | Odds Ratio (M‐H, Fixed, 95% CI) | 1.36 [0.05, 33.98] |
| 7.27 Ulcus ventriculi | 1 | 146 | Odds Ratio (M‐H, Fixed, 95% CI) | 1.36 [0.05, 33.98] |
| 7.28 Arthralgia | 1 | 146 | Odds Ratio (M‐H, Fixed, 95% CI) | 0.15 [0.01, 3.66] |
| 7.29 Leg cramps | 1 | 146 | Odds Ratio (M‐H, Fixed, 95% CI) | 0.15 [0.01, 3.66] |
| 7.30 Pain in leg | 1 | 146 | Odds Ratio (M‐H, Fixed, 95% CI) | 1.36 [0.05, 33.98] |
| 7.31 Vulval disorder | 1 | 146 | Odds Ratio (M‐H, Fixed, 95% CI) | 0.15 [0.01, 3.66] |
| 7.32 Feeling of heat in vagina | 1 | 146 | Odds Ratio (M‐H, Fixed, 95% CI) | 0.44 [0.03, 7.20] |
| 7.33 Urinary tract infection | 1 | 146 | Odds Ratio (M‐H, Fixed, 95% CI) | 1.81 [0.20, 16.71] |
| 7.34 Candidiasis | 1 | 146 | Odds Ratio (M‐H, Fixed, 95% CI) | 1.36 [0.05, 33.98] |
| 7.35 Pressure in vagina | 1 | 146 | Odds Ratio (M‐H, Fixed, 95% CI) | 3.23 [0.16, 63.91] |
| 7.36 Breast enlargement | 1 | 146 | Odds Ratio (M‐H, Fixed, 95% CI) | 0.44 [0.03, 7.20] |
| 7.37 Anorexia | 1 | 146 | Odds Ratio (M‐H, Fixed, 95% CI) | 1.36 [0.05, 33.98] |
| 7.38 Cold | 1 | 146 | Odds Ratio (M‐H, Fixed, 95% CI) | 1.36 [0.05, 33.98] |
| 7.39 Dry cough | 1 | 146 | Odds Ratio (M‐H, Fixed, 95% CI) | 1.36 [0.05, 33.98] |
| 7.40 Fever and pain on left side | 1 | 146 | Odds Ratio (M‐H, Fixed, 95% CI) | 1.36 [0.05, 33.98] |
| 7.41 Impairment of hearing | 1 | 146 | Odds Ratio (M‐H, Fixed, 95% CI) | 1.36 [0.05, 33.98] |
| 7.42 Viral infection | 1 | 146 | Odds Ratio (M‐H, Fixed, 95% CI) | 1.36 [0.05, 33.98] |
| 7.43 Migraine | 1 | 146 | Odds Ratio (M‐H, Fixed, 95% CI) | 1.36 [0.05, 33.98] |
| 7.44 Pneumonia | 1 | 146 | Odds Ratio (M‐H, Fixed, 95% CI) | 1.36 [0.05, 33.98] |
| 7.45 Polyuria | 1 | 146 | Odds Ratio (M‐H, Fixed, 95% CI) | 1.36 [0.05, 33.98] |
| 7.46 vaginal irritation | 2 | 360 | Odds Ratio (M‐H, Fixed, 95% CI) | 1.17 [0.44, 3.12] |
| 7.47 vaginal erythema | 1 | 170 | Odds Ratio (M‐H, Fixed, 95% CI) | 0.67 [0.22, 2.02] |
| 7.48 Bleeding during treatment | 1 | 170 | Odds Ratio (M‐H, Fixed, 95% CI) | 1.57 [0.06, 39.25] |
| 7.49 vaginal ulceration | 1 | 170 | Odds Ratio (M‐H, Fixed, 95% CI) | 2.65 [0.13, 56.05] |
| 8 Acceptability of treatment delivery system (excellent or good) Show forest plot | 4 | 698 | Odds Ratio (M‐H, Fixed, 95% CI) | 4.55 [3.17, 6.53] |
|
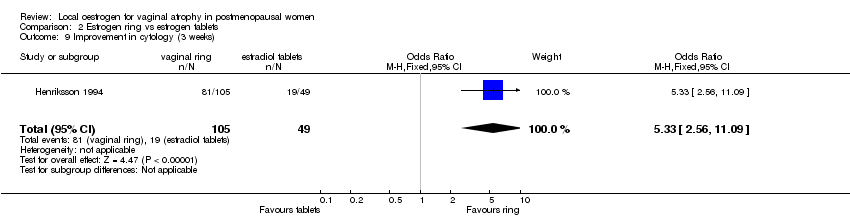
| 9 Improvement in cytology (3 weeks) Show forest plot | 1 | 154 | Odds Ratio (M‐H, Fixed, 95% CI) | 5.33 [2.56, 11.09] |
|
| 10 Plasma estradiol levels (pmol/L) at 48 weeks Show forest plot | 1 | 146 | Mean Difference (IV, Fixed, 95% CI) | ‐16.0 [‐31.74, ‐0.26] |
|