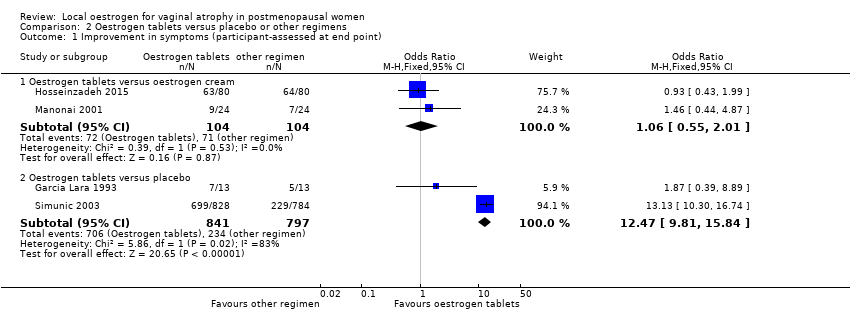
| 1 Improvement in symptoms (participant‐assessed at end point) Show forest plot | 6 | | Odds Ratio (M‐H, Fixed, 95% CI) | Subtotals only |
|
| 1.1 Oestrogen ring versus oestrogen cream | 2 | 341 | Odds Ratio (M‐H, Fixed, 95% CI) | 1.33 [0.80, 2.19] |
| 1.2 Oestrogen ring versus oestrogen tablets | 3 | 567 | Odds Ratio (M‐H, Fixed, 95% CI) | 0.78 [0.53, 1.15] |
| 1.3 Oestrogen ring versus placebo | 1 | 67 | Odds Ratio (M‐H, Fixed, 95% CI) | 12.67 [3.23, 49.66] |
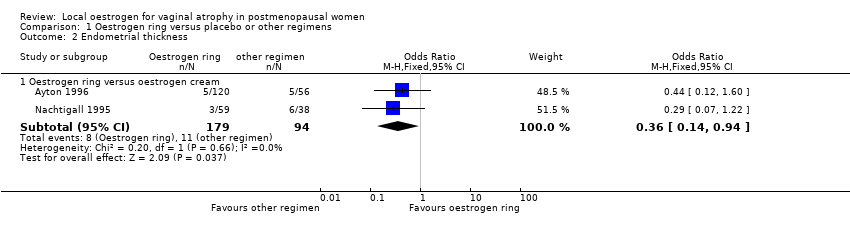
| 2 Endometrial thickness Show forest plot | 2 | | Odds Ratio (M‐H, Fixed, 95% CI) | Subtotals only |
|
| 2.1 Oestrogen ring versus oestrogen cream | 2 | 273 | Odds Ratio (M‐H, Fixed, 95% CI) | 0.36 [0.14, 0.94] |
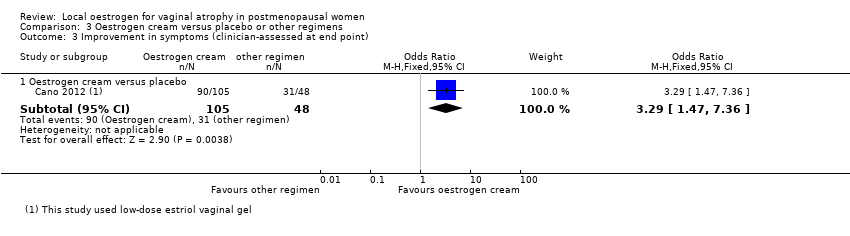
| 3 Improvement in symptoms (clinician‐assessed at end point) Show forest plot | 6 | | Odds Ratio (M‐H, Fixed, 95% CI) | Subtotals only |
|
| 3.1 Oestrogen ring versus oestrogen cream | 3 | 533 | Odds Ratio (M‐H, Fixed, 95% CI) | 1.04 [0.70, 1.53] |
| 3.2 Oestrogen ring versus oestrogen tablets | 2 | 397 | Odds Ratio (M‐H, Fixed, 95% CI) | 1.45 [0.90, 2.32] |
| 3.3 Oestrogen ring versus placebo | 1 | 49 | Odds Ratio (M‐H, Fixed, 95% CI) | 2.0 [0.55, 7.31] |
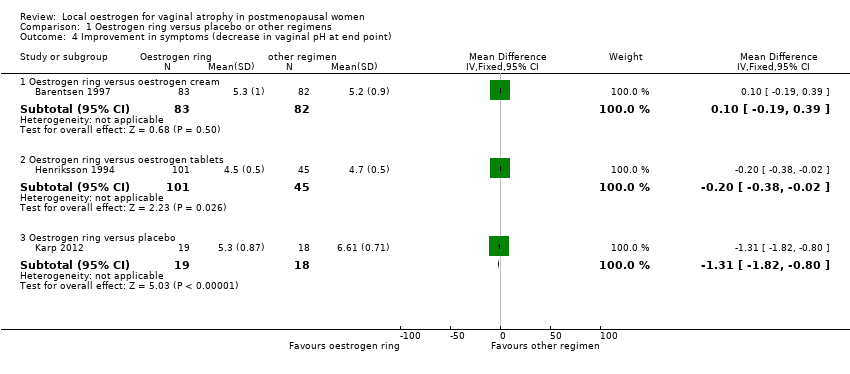
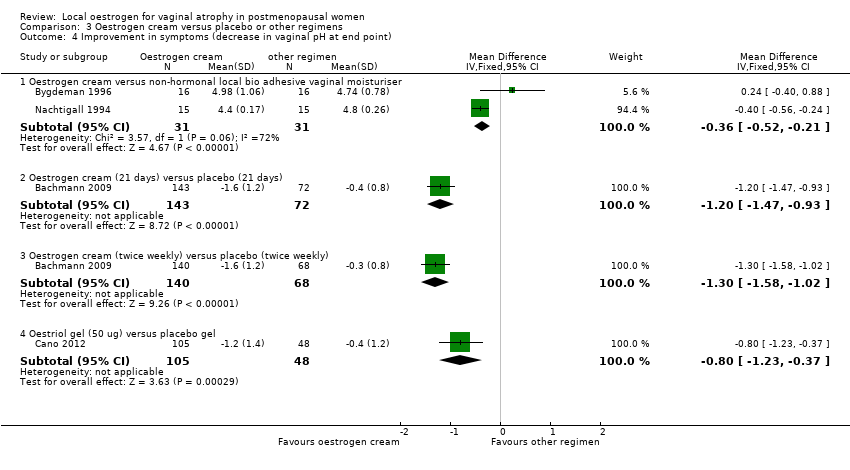
| 4 Improvement in symptoms (decrease in vaginal pH at end point) Show forest plot | 3 | | Mean Difference (IV, Fixed, 95% CI) | Subtotals only |
|
| 4.1 Oestrogen ring versus oestrogen cream | 1 | 165 | Mean Difference (IV, Fixed, 95% CI) | 0.10 [‐0.19, 0.39] |
| 4.2 Oestrogen ring versus oestrogen tablets | 1 | 146 | Mean Difference (IV, Fixed, 95% CI) | ‐0.20 [‐0.38, ‐0.02] |
| 4.3 Oestrogen ring versus placebo | 1 | 37 | Mean Difference (IV, Fixed, 95% CI) | ‐1.31 [‐1.82, ‐0.80] |
| 5 Improvement in symptoms (increase in maturation indices at end point) Show forest plot | 3 | | Mean Difference (IV, Fixed, 95% CI) | Subtotals only |
|
| 5.1 Oestrogen ring versus oestrogen cream | 2 | 341 | Mean Difference (IV, Fixed, 95% CI) | 0.79 [‐1.52, 3.09] |
| 5.2 Oestrogen ring (7.5 ug) versus placebo | 0 | 0 | Mean Difference (IV, Fixed, 95% CI) | 0.0 [0.0, 0.0] |
| 5.3 Oestrogen ring (100 ug) versus placebo | 0 | 0 | Mean Difference (IV, Fixed, 95% CI) | 0.0 [0.0, 0.0] |
| 5.4 Oestrogen ring (50 ug) versus placebo | 0 | 0 | Mean Difference (IV, Fixed, 95% CI) | 0.0 [0.0, 0.0] |
| 5.5 Oestrogen ring (unspecified dose) versus placebo | 1 | 37 | Mean Difference (IV, Fixed, 95% CI) | 24.4 [15.25, 33.55] |
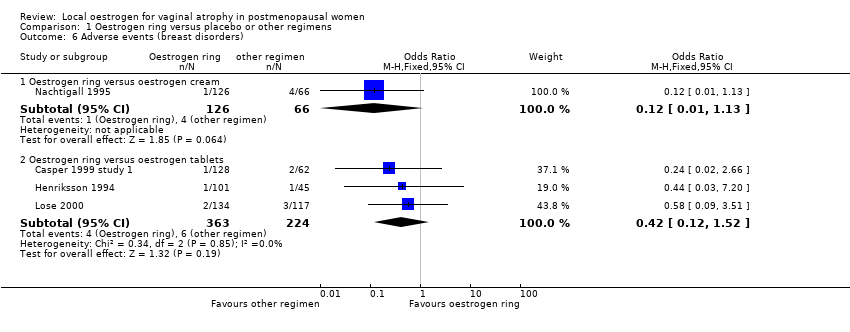
| 6 Adverse events (breast disorders) Show forest plot | 4 | | Odds Ratio (M‐H, Fixed, 95% CI) | Subtotals only |
|
| 6.1 Oestrogen ring versus oestrogen cream | 1 | 192 | Odds Ratio (M‐H, Fixed, 95% CI) | 0.12 [0.01, 1.13] |
| 6.2 Oestrogen ring versus oestrogen tablets | 3 | 587 | Odds Ratio (M‐H, Fixed, 95% CI) | 0.42 [0.12, 1.52] |
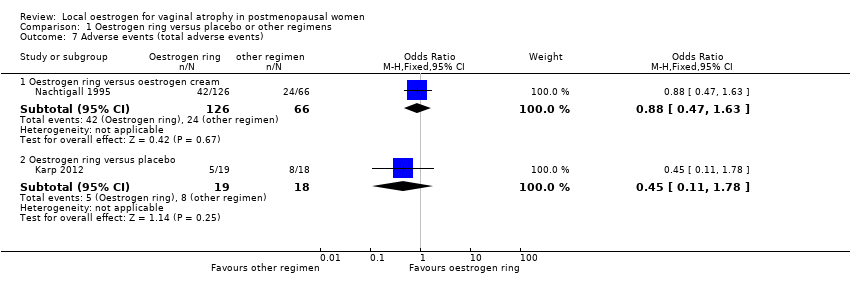
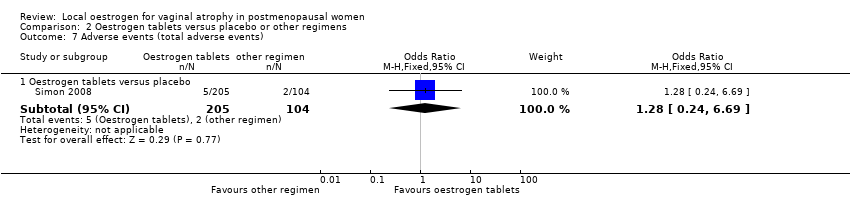
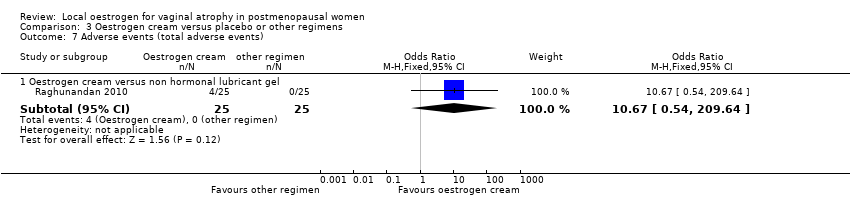
| 7 Adverse events (total adverse events) Show forest plot | 2 | | Odds Ratio (M‐H, Fixed, 95% CI) | Subtotals only |
|
| 7.1 Oestrogen ring versus oestrogen cream | 1 | 192 | Odds Ratio (M‐H, Fixed, 95% CI) | 0.88 [0.47, 1.63] |
| 7.2 Oestrogen ring versus placebo | 1 | 37 | Odds Ratio (M‐H, Fixed, 95% CI) | 0.45 [0.11, 1.78] |
| 8 Adherence to treatment Show forest plot | 3 | | Odds Ratio (M‐H, Fixed, 95% CI) | Subtotals only |
|
| 8.1 Oestrogen ring versus oestrogen cream | 2 | 350 | Odds Ratio (M‐H, Fixed, 95% CI) | 2.23 [1.31, 3.80] |
| 8.2 Oestrogen ring versus oestrogen tablets | 1 | 146 | Odds Ratio (M‐H, Fixed, 95% CI) | 1.69 [0.66, 4.31] |