Estrógenos locales para la atrofia vaginal en mujeres posmenopáusicas
Información
- DOI:
- https://doi.org/10.1002/14651858.CD001500.pub3Copiar DOI

- Base de datos:
-
- Cochrane Database of Systematic Reviews
- Versión publicada:
-
- 31 agosto 2016see what's new
- Tipo:
-
- Intervention
- Etapa:
-
- Review
- Grupo Editorial Cochrane:
-
Grupo Cochrane de Ginecología y fertilidad
- Copyright:
-
- Copyright © 2016 The Cochrane Collaboration. Published by John Wiley & Sons, Ltd.
Cifras del artículo
Altmetric:
Citado por:
Autores
Contributions of authors
In the 2016 update, Anne Lethaby and Reuben Ayeleke selected trials for inclusion, performed independent data extraction, quality assessment of the included trials, data entry and updating of the review's text. Helen Roberts provided clinical advice and commented on the review.
In the earlier versions of the review:
Jane Suckling performed initial searches of databases for trials, was involved in selecting trials for inclusion, performed independent data extraction and quality assessment of the included trials, and was responsible for statistical analysis and interpretation of the data.
Anne Lethaby was involved in writing the protocol, performed initial searches of databases for trials, was involved in selecting trials for inclusion, performed independent data extraction and quality assessment of the included trials, and commented on drafts of the review.
Ray Kennedy was involved in writing the protocol and selecting trials for inclusion.
Helen Roberts provided clinical expertise and assisted in writing implications for practice and research.
Sources of support
Internal sources
-
Department of Obstetrics and Gynaecology, University of Auckland, New Zealand.
External sources
-
Health Research Council, Auckland, New Zealand.
Declarations of interest
Anne Lethaby: no conflicts of interest to declare
Reuben Ayeleke: no conflicts of interest to declare
Helen Roberts: no conflicts of interest to declare
Acknowledgements
Thanks to members of the Editorial office of Cochrane Gynaecology and Fertility who assisted at all stages of the review. The authors thank Dr Ray Kennedy and Dr Jane Suckling for their contributions to previous versions of this review.
Version history
| Published | Title | Stage | Authors | Version |
| 2016 Aug 31 | Local oestrogen for vaginal atrophy in postmenopausal women | Review | Anne Lethaby, Reuben Olugbenga Ayeleke, Helen Roberts | |
| 2006 Oct 18 | Local oestrogen for vaginal atrophy in postmenopausal women | Review | Jane A Suckling, Ray Kennedy, Anne Lethaby, Helen Roberts | |
| 2003 Oct 20 | Local oestrogen for vaginal atrophy in postmenopausal women | Review | Jane A Suckling, Anne Lethaby, Ray Kennedy | |
Differences between protocol and review
In the 2016 update the authors re‐evaluated the importance of the outcomes and specified that they were either primary or secondary. Improvement of vaginal symptoms according to participants' own assessment was made a primary outcome, as this reflects the participants’ own experiences. The primary safety outcome became endometrial thickness, as this is an important concern relating to local oestrogen administration. Other outcomes were specified as secondary: improvement in symptoms according to clinician assessment or laboratory parameters, other adverse events and adherence to treatment. The 2016 update also grouped symptoms so the assessed outcome was an aggregate measure. Previous versions of the review assessed individual symptoms and did not distinguish between primary and secondary outcomes.
Keywords
MeSH
Medical Subject Headings (MeSH) Keywords
- Administration, Intravaginal;
- Atrophy [drug therapy];
- Estradiol [administration & dosage];
- Estrogens [*administration & dosage, adverse effects];
- Hydrogen‐Ion Concentration;
- Isoflavones [administration & dosage];
- Postmenopause;
- Randomized Controlled Trials as Topic;
- Tablets [administration & dosage];
- Vagina [chemistry, *pathology];
- Vaginal Creams, Foams, and Jellies [administration & dosage];
- Vaginitis [*drug therapy];
Medical Subject Headings Check Words
Aged; Female; Humans; Middle Aged;
PICO
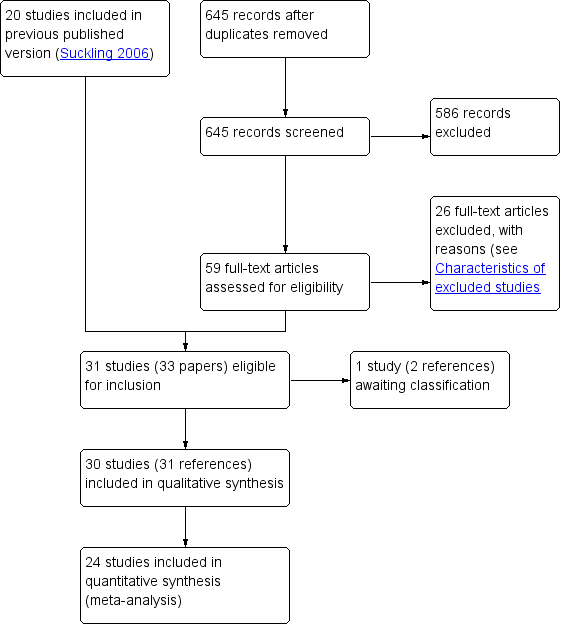
Study flow diagram

Risk of bias graph: review authors' judgements about each risk of bias item presented as percentages across all included studies
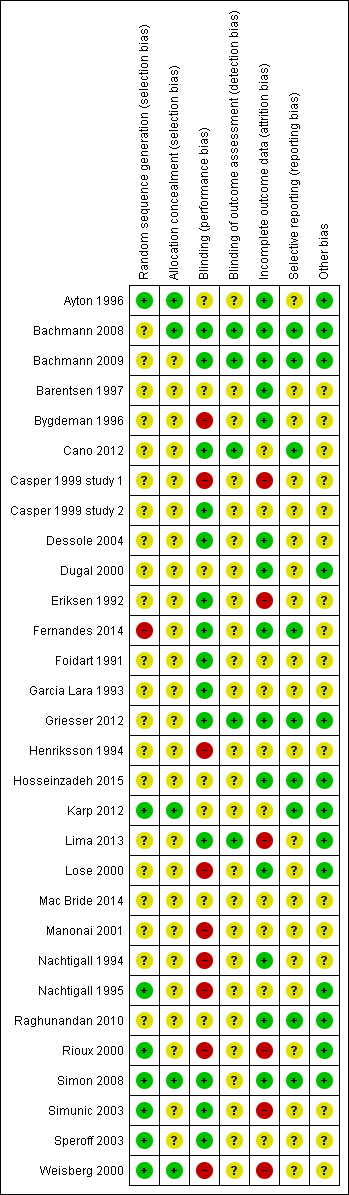
Risk of bias summary: review authors' judgements about each risk of bias item for each included study

Forest plot of comparison: 1 Oestrogen ring versus placebo or other regimens, outcome: 1.1 Improvement in symptoms (participant‐assessed at end point).

Forest plot of comparison: 2 Oestrogen tablets versus placebo or other regimens, outcome: 2.1 Improvement in symptoms (participant‐assessed at end point).

Forest plot of comparison: 3 Oestrogen cream versus placebo or other regimens, outcome: 3.1 Improvement in symptoms (participant‐assessed at end point).

Comparison 1 Oestrogen ring versus placebo or other regimens, Outcome 1 Improvement in symptoms (participant‐assessed at end point).
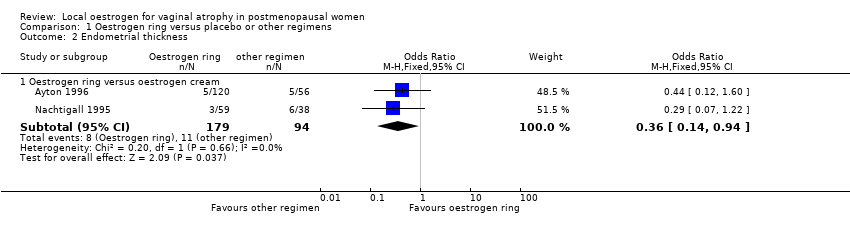
Comparison 1 Oestrogen ring versus placebo or other regimens, Outcome 2 Endometrial thickness.

Comparison 1 Oestrogen ring versus placebo or other regimens, Outcome 3 Improvement in symptoms (clinician‐assessed at end point).
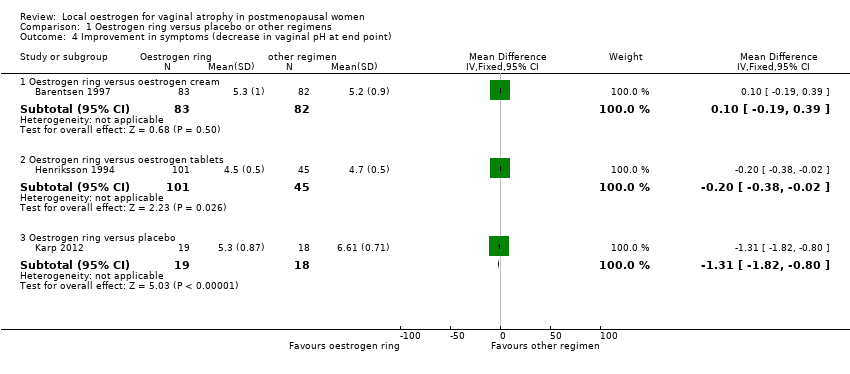
Comparison 1 Oestrogen ring versus placebo or other regimens, Outcome 4 Improvement in symptoms (decrease in vaginal pH at end point).

Comparison 1 Oestrogen ring versus placebo or other regimens, Outcome 5 Improvement in symptoms (increase in maturation indices at end point).
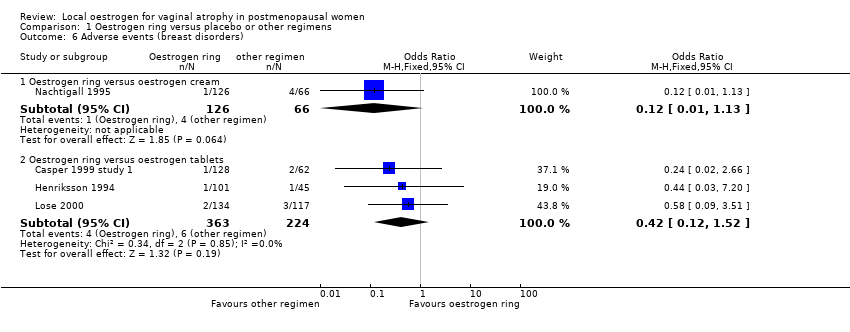
Comparison 1 Oestrogen ring versus placebo or other regimens, Outcome 6 Adverse events (breast disorders).
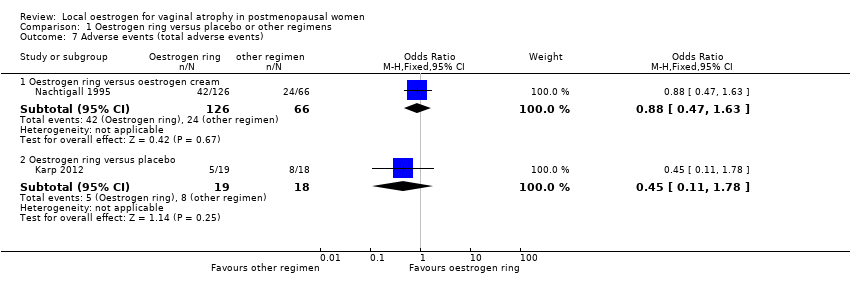
Comparison 1 Oestrogen ring versus placebo or other regimens, Outcome 7 Adverse events (total adverse events).

Comparison 1 Oestrogen ring versus placebo or other regimens, Outcome 8 Adherence to treatment.
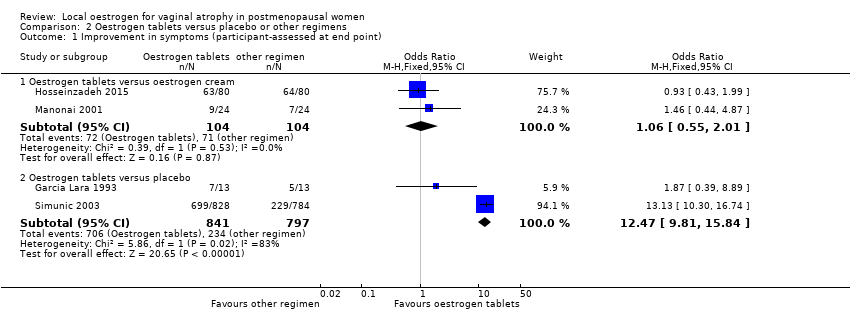
Comparison 2 Oestrogen tablets versus placebo or other regimens, Outcome 1 Improvement in symptoms (participant‐assessed at end point).

Comparison 2 Oestrogen tablets versus placebo or other regimens, Outcome 2 Endometrial thickness.

Comparison 2 Oestrogen tablets versus placebo or other regimens, Outcome 3 Improvement in symptoms (clinician‐assessed at end point).

Comparison 2 Oestrogen tablets versus placebo or other regimens, Outcome 4 Improvement in symptoms (decrease in vaginal pH at end point).

Comparison 2 Oestrogen tablets versus placebo or other regimens, Outcome 5 Improvement in symptoms (increase in maturation indices at end point).

Comparison 2 Oestrogen tablets versus placebo or other regimens, Outcome 6 Adverse events (breast disorders).
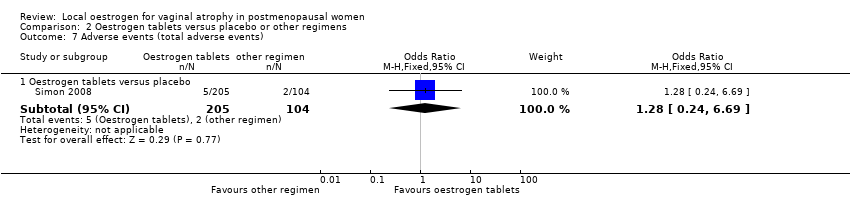
Comparison 2 Oestrogen tablets versus placebo or other regimens, Outcome 7 Adverse events (total adverse events).

Comparison 2 Oestrogen tablets versus placebo or other regimens, Outcome 8 Adherence to treatment.

Comparison 3 Oestrogen cream versus placebo or other regimens, Outcome 1 Improvement in symptoms (participant‐assessed at end point).
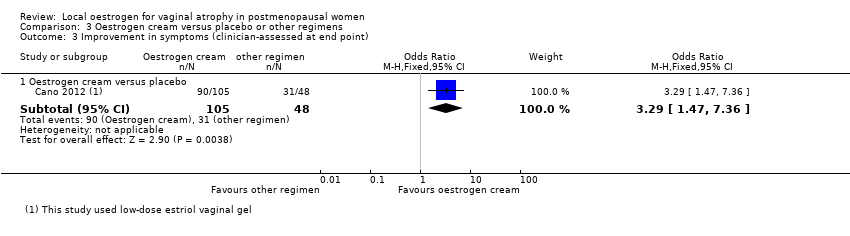
Comparison 3 Oestrogen cream versus placebo or other regimens, Outcome 3 Improvement in symptoms (clinician‐assessed at end point).
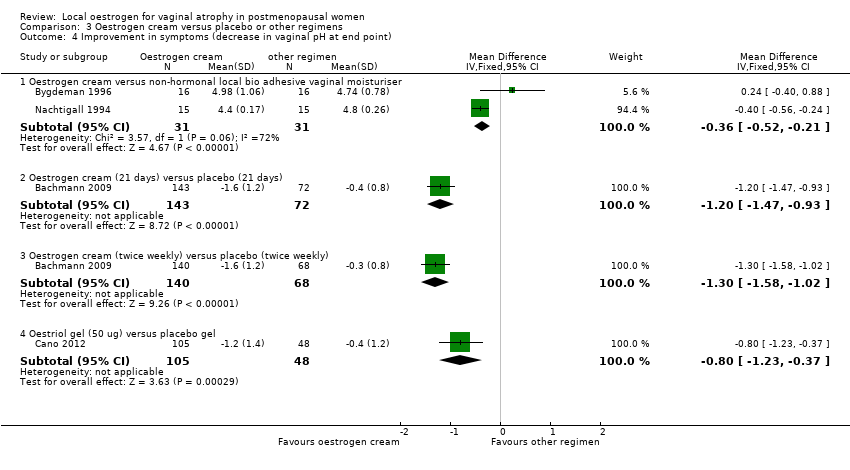
Comparison 3 Oestrogen cream versus placebo or other regimens, Outcome 4 Improvement in symptoms (decrease in vaginal pH at end point).

Comparison 3 Oestrogen cream versus placebo or other regimens, Outcome 5 Improvement in symptoms (increase in maturation indices at end point).
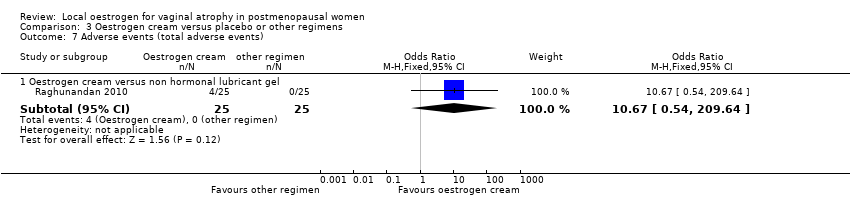
Comparison 3 Oestrogen cream versus placebo or other regimens, Outcome 7 Adverse events (total adverse events).
| Oestrogen ring compared to other regimens for vaginal atrophy in postmenopausal women | ||||||
| Patient or population: postmenopausal women with vaginal atrophy | ||||||
| Outcomes | Illustrative comparative risks* (95% CI) | Relative effect | No of Participants | Quality of the evidence | Comments | |
| Assumed risk | Corresponding risk | |||||
| Other regimen | Oestrogen ring | |||||
| Improvement in symptoms (participant‐assessed) (oestrogen ring vs oestrogen cream) | 717 per 1000 | 771 per 1000 | OR 1.33 | 341 | ⊕⊕⊝⊝ | |
| Improvement in symptoms (participant‐assessed) (oestrogen ring vs oestrogen tablets) | 582 per 1000 | 521 per 1000 | OR 0.78 | 567 | ⊕⊕⊝⊝ | |
| Endometrial thickness (oestrogen ring vs oestrogen cream) | 117 per 1000 | 46 per 1000 | OR 0.36 | 273 | ⊕⊕⊝⊝ | |
| Improvement in symptoms (clinician‐assessed) (oestrogen ring vs oestrogen cream) | 706 per 1000 | 714 per 1000 | OR 1.04 | 533 | ⊕⊕⊝⊝ | |
| Improvement in symptoms (clinician‐assessed) (oestrogen ring vs oestrogen tablets) | 636 per 1000 | 717 per 1000 | OR 1.45 | 397 | ⊕⊕⊝⊝ | |
| Adverse events (total adverse events) (oestrogen ring vs oestrogen cream) | 364 per 1000 | 335 per 1000 | OR 0.88 | 192 | ⊕⊕⊝⊝ | |
| Adverse events (total adverse events) (oestrogen ring vs placebo) | 444 per 1000 | 264 per 1000 | OR 0.45 | 37 | ⊕⊕⊕⊝ | |
| *The basis for the assumed risk is the median control group risk across studies. The corresponding risk (and its 95% confidence interval) is based on the assumed risk in the comparison group and the relative effect of the intervention (and its 95% CI). | ||||||
| GRADE Working Group grades of evidence | ||||||
| 1 Downgraded by 1 level as most risk of bias domains were rated either as unclear or high | ||||||
| Oestrogen tablets compared to other regimens for vaginal atrophy in postmenopausal women | ||||||
| Patient or population: postmenopausal women with vaginal atrophy | ||||||
| Outcomes | Illustrative comparative risks* (95% CI) | Relative effect | No of Participants | Quality of the evidence | Comments | |
| Assumed risk | Corresponding risk | |||||
| Other regimen | Oestrogen tablets | |||||
| Improvement in symptoms (participant‐assessed) (oestrogen tablets vs oestrogen cream) | 683 per 1000 | 695 per 1000 | OR 1.06 | 208 | ⊕⊕⊝⊝ | |
| Improvement in symptoms (participant‐assessed) (oestrogen tablets vs placebo) | 294 per 1000 | 839 per 1000 | OR 12.47 | 1638 | ⊕⊕⊝⊝ | Using a random effects model, there was no evidence of a difference in effect: OR 5.80, 95% CI 0.88 to 38.29 |
| Endometrial thickness (oestrogen tablets vs oestrogen cream) | 80 per 1000 | 26 per 1000 | OR 0.31 | 151 | ⊕⊕⊝⊝ | |
| Improvement in symptoms (clinician‐assessed) (oestrogen tablets vs oestrogen cream) | 697 per 1000 | 699 per 1000 | OR 1.03 | 528 | ⊕⊕⊝⊝ | |
| Improvement in symptoms (clinician‐assessed) (oestrogen tablets vs placebo) | 262 per 1000 | 820 per 1000 | OR 12.85 | 2078 | ⊕⊕⊝⊝ | |
| Adverse events (total adverse events) (oestrogen tablets vs placebo) | 19 per 1000 | 24 per 1000 | OR 1.27 | 309 | ⊕⊕⊕⊝ | |
| *The basis for the assumed risk is the median control group risk across studies. The corresponding risk (and its 95% confidence interval) is based on the assumed risk in the comparison group and the relative effect of the intervention (and its 95% CI). | ||||||
| GRADE Working Group grades of evidence | ||||||
| 1 Downgraded by 1 level as most risk of bias domains were assessed either as unclear or high | ||||||
| Oestrogen cream compared to other regimens for vaginal atrophy in postmenopausal women | ||||||
| Patient or population: postmenopausal women with vaginal atrophy | ||||||
| Outcomes | Illustrative comparative risks* (95% CI) | Relative effect | No of Participants | Quality of the evidence | Comments | |
| Assumed risk | Corresponding risk | |||||
| Other regimen | Oestrogen cream | |||||
| Improvement in symptoms (participant‐assessed) (oestrogen cream vs isoflavone gel) | 967 per 1000 | 984 per 1000 | OR 2.08 | 50 | ⊕⊕⊝⊝ | |
| Improvement in symptoms (participant‐assessed) oestrogen cream vs placebo) | 685 per 1000 | 899 per 1000 | OR 4.10 | 198 | ⊕⊕⊝⊝ | |
| Endometrial thickness not reported | ‐ | ‐ | Not estimable | ‐ | ‐ | |
| Improvement in symptoms (clinician‐assessed) (oestrogen cream vs placebo) | 646 per 1000 | 857 per 1000 | OR 3.29 | 153 | ⊕⊕⊝⊝ | |
| Adverse events (total adverse events) (oestrogen cream vs non‐hormonal lubricant gel) | ‐ | ‐ | OR 10.67 | 50 | ⊕⊕⊝⊝ | |
| *The basis for the assumed risk is the median control group risk across studies. The corresponding risk (and its 95% confidence interval) is based on the assumed risk in the comparison group and the relative effect of the intervention (and its 95% CI). | ||||||
| GRADE Working Group grades of evidence | ||||||
| 1 Downgraded by 1 level as most risk of bias domains were assessed either as unclear or high | ||||||
| Outcome or subgroup title | No. of studies | No. of participants | Statistical method | Effect size |
| 1 Improvement in symptoms (participant‐assessed at end point) Show forest plot | 6 | Odds Ratio (M‐H, Fixed, 95% CI) | Subtotals only | |
| 1.1 Oestrogen ring versus oestrogen cream | 2 | 341 | Odds Ratio (M‐H, Fixed, 95% CI) | 1.33 [0.80, 2.19] |
| 1.2 Oestrogen ring versus oestrogen tablets | 3 | 567 | Odds Ratio (M‐H, Fixed, 95% CI) | 0.78 [0.53, 1.15] |
| 1.3 Oestrogen ring versus placebo | 1 | 67 | Odds Ratio (M‐H, Fixed, 95% CI) | 12.67 [3.23, 49.66] |
| 2 Endometrial thickness Show forest plot | 2 | Odds Ratio (M‐H, Fixed, 95% CI) | Subtotals only | |
| 2.1 Oestrogen ring versus oestrogen cream | 2 | 273 | Odds Ratio (M‐H, Fixed, 95% CI) | 0.36 [0.14, 0.94] |
| 3 Improvement in symptoms (clinician‐assessed at end point) Show forest plot | 6 | Odds Ratio (M‐H, Fixed, 95% CI) | Subtotals only | |
| 3.1 Oestrogen ring versus oestrogen cream | 3 | 533 | Odds Ratio (M‐H, Fixed, 95% CI) | 1.04 [0.70, 1.53] |
| 3.2 Oestrogen ring versus oestrogen tablets | 2 | 397 | Odds Ratio (M‐H, Fixed, 95% CI) | 1.45 [0.90, 2.32] |
| 3.3 Oestrogen ring versus placebo | 1 | 49 | Odds Ratio (M‐H, Fixed, 95% CI) | 2.0 [0.55, 7.31] |
| 4 Improvement in symptoms (decrease in vaginal pH at end point) Show forest plot | 3 | Mean Difference (IV, Fixed, 95% CI) | Subtotals only | |
| 4.1 Oestrogen ring versus oestrogen cream | 1 | 165 | Mean Difference (IV, Fixed, 95% CI) | 0.10 [‐0.19, 0.39] |
| 4.2 Oestrogen ring versus oestrogen tablets | 1 | 146 | Mean Difference (IV, Fixed, 95% CI) | ‐0.20 [‐0.38, ‐0.02] |
| 4.3 Oestrogen ring versus placebo | 1 | 37 | Mean Difference (IV, Fixed, 95% CI) | ‐1.31 [‐1.82, ‐0.80] |
| 5 Improvement in symptoms (increase in maturation indices at end point) Show forest plot | 3 | Mean Difference (IV, Fixed, 95% CI) | Subtotals only | |
| 5.1 Oestrogen ring versus oestrogen cream | 2 | 341 | Mean Difference (IV, Fixed, 95% CI) | 0.79 [‐1.52, 3.09] |
| 5.2 Oestrogen ring (7.5 ug) versus placebo | 0 | 0 | Mean Difference (IV, Fixed, 95% CI) | 0.0 [0.0, 0.0] |
| 5.3 Oestrogen ring (100 ug) versus placebo | 0 | 0 | Mean Difference (IV, Fixed, 95% CI) | 0.0 [0.0, 0.0] |
| 5.4 Oestrogen ring (50 ug) versus placebo | 0 | 0 | Mean Difference (IV, Fixed, 95% CI) | 0.0 [0.0, 0.0] |
| 5.5 Oestrogen ring (unspecified dose) versus placebo | 1 | 37 | Mean Difference (IV, Fixed, 95% CI) | 24.4 [15.25, 33.55] |
| 6 Adverse events (breast disorders) Show forest plot | 4 | Odds Ratio (M‐H, Fixed, 95% CI) | Subtotals only | |
| 6.1 Oestrogen ring versus oestrogen cream | 1 | 192 | Odds Ratio (M‐H, Fixed, 95% CI) | 0.12 [0.01, 1.13] |
| 6.2 Oestrogen ring versus oestrogen tablets | 3 | 587 | Odds Ratio (M‐H, Fixed, 95% CI) | 0.42 [0.12, 1.52] |
| 7 Adverse events (total adverse events) Show forest plot | 2 | Odds Ratio (M‐H, Fixed, 95% CI) | Subtotals only | |
| 7.1 Oestrogen ring versus oestrogen cream | 1 | 192 | Odds Ratio (M‐H, Fixed, 95% CI) | 0.88 [0.47, 1.63] |
| 7.2 Oestrogen ring versus placebo | 1 | 37 | Odds Ratio (M‐H, Fixed, 95% CI) | 0.45 [0.11, 1.78] |
| 8 Adherence to treatment Show forest plot | 3 | Odds Ratio (M‐H, Fixed, 95% CI) | Subtotals only | |
| 8.1 Oestrogen ring versus oestrogen cream | 2 | 350 | Odds Ratio (M‐H, Fixed, 95% CI) | 2.23 [1.31, 3.80] |
| 8.2 Oestrogen ring versus oestrogen tablets | 1 | 146 | Odds Ratio (M‐H, Fixed, 95% CI) | 1.69 [0.66, 4.31] |
| Outcome or subgroup title | No. of studies | No. of participants | Statistical method | Effect size |
| 1 Improvement in symptoms (participant‐assessed at end point) Show forest plot | 4 | Odds Ratio (M‐H, Fixed, 95% CI) | Subtotals only | |
| 1.1 Oestrogen tablets versus oestrogen cream | 2 | 208 | Odds Ratio (M‐H, Fixed, 95% CI) | 1.06 [0.55, 2.01] |
| 1.2 Oestrogen tablets versus placebo | 2 | 1638 | Odds Ratio (M‐H, Fixed, 95% CI) | 12.47 [9.81, 15.84] |
| 2 Endometrial thickness Show forest plot | 2 | Odds Ratio (M‐H, Fixed, 95% CI) | Subtotals only | |
| 2.1 Oestrogen tablets versus oestrogen cream | 2 | 151 | Odds Ratio (M‐H, Fixed, 95% CI) | 0.31 [0.06, 1.60] |
| 3 Improvement in symptoms (clinician‐assessed at end point) Show forest plot | 6 | Odds Ratio (M‐H, Fixed, 95% CI) | Subtotals only | |
| 3.1 Oestrogen tablets versus oestrogen cream | 3 | 528 | Odds Ratio (M‐H, Fixed, 95% CI) | 1.03 [0.70, 1.52] |
| 3.2 Oestrogen tablets versus placebo | 3 | 2078 | Odds Ratio (M‐H, Fixed, 95% CI) | 12.85 [10.39, 15.89] |
| 4 Improvement in symptoms (decrease in vaginal pH at end point) Show forest plot | 3 | Mean Difference (IV, Fixed, 95% CI) | Subtotals only | |
| 4.1 Oestrogen tablets versus oestrogen cream | 1 | 48 | Mean Difference (IV, Fixed, 95% CI) | 0.20 [‐0.12, 0.52] |
| 4.2 Oestrogen tablets versus placebo | 2 | 524 | Mean Difference (IV, Fixed, 95% CI) | ‐0.95 [‐1.10, ‐0.80] |
| 5 Improvement in symptoms (increase in maturation indices at end point) Show forest plot | 2 | Mean Difference (IV, Fixed, 95% CI) | Subtotals only | |
| 5.1 Oestrogen tablets versus oestrogen cream | 1 | 48 | Mean Difference (IV, Fixed, 95% CI) | ‐4.69 [‐13.58, 4.20] |
| 5.2 Oestrogen tablets versus placebo | 1 | 436 | Mean Difference (IV, Fixed, 95% CI) | 18.63 [14.57, 22.69] |
| 6 Adverse events (breast disorders) Show forest plot | 1 | Odds Ratio (M‐H, Fixed, 95% CI) | Subtotals only | |
| 6.1 Oestradiol tablets versus oestriol tablets | 1 | 96 | Odds Ratio (M‐H, Fixed, 95% CI) | 3.06 [0.12, 77.09] |
| 7 Adverse events (total adverse events) Show forest plot | 1 | Odds Ratio (M‐H, Fixed, 95% CI) | Subtotals only | |
| 7.1 Oestrogen tablets versus placebo | 1 | 309 | Odds Ratio (M‐H, Fixed, 95% CI) | 1.28 [0.24, 6.69] |
| 8 Adherence to treatment Show forest plot | 2 | Odds Ratio (M‐H, Fixed, 95% CI) | Subtotals only | |
| 8.1 Oestrogen tablets versus oestrogen cream | 1 | 53 | Odds Ratio (M‐H, Fixed, 95% CI) | 1.90 [0.41, 8.94] |
| 8.2 Oestradiol tablets versus oestriol tablets | 1 | 96 | Odds Ratio (M‐H, Fixed, 95% CI) | 2.69 [1.15, 6.31] |
| Outcome or subgroup title | No. of studies | No. of participants | Statistical method | Effect size |
| 1 Improvement in symptoms (participant‐assessed at end point) Show forest plot | 2 | Odds Ratio (M‐H, Fixed, 95% CI) | Subtotals only | |
| 1.1 Oestrogen cream versus isoflavone gel | 1 | 50 | Odds Ratio (M‐H, Fixed, 95% CI) | 2.08 [0.08, 53.76] |
| 1.2 Oestrogen cream versus placebo | 2 | 198 | Odds Ratio (M‐H, Fixed, 95% CI) | 4.10 [1.88, 8.93] |
| 2 Endometrial thickness | 0 | Odds Ratio (M‐H, Fixed, 95% CI) | Subtotals only | |
| 3 Improvement in symptoms (clinician‐assessed at end point) Show forest plot | 1 | Odds Ratio (M‐H, Fixed, 95% CI) | Subtotals only | |
| 3.1 Oestrogen cream versus placebo | 1 | 153 | Odds Ratio (M‐H, Fixed, 95% CI) | 3.29 [1.47, 7.36] |
| 4 Improvement in symptoms (decrease in vaginal pH at end point) Show forest plot | 4 | Mean Difference (IV, Fixed, 95% CI) | Subtotals only | |
| 4.1 Oestrogen cream versus non‐hormonal local bio adhesive vaginal moisturiser | 2 | 62 | Mean Difference (IV, Fixed, 95% CI) | ‐0.36 [‐0.52, ‐0.21] |
| 4.2 Oestrogen cream (21 days) versus placebo (21 days) | 1 | 215 | Mean Difference (IV, Fixed, 95% CI) | ‐1.20 [‐1.47, ‐0.93] |
| 4.3 Oestrogen cream (twice weekly) versus placebo (twice weekly) | 1 | 208 | Mean Difference (IV, Fixed, 95% CI) | ‐1.30 [‐1.58, ‐1.02] |
| 4.4 Oestriol gel (50 ug) versus placebo gel | 1 | 153 | Mean Difference (IV, Fixed, 95% CI) | ‐0.8 [‐1.23, ‐0.37] |
| 5 Improvement in symptoms (increase in maturation indices at end point) Show forest plot | 1 | Mean Difference (IV, Fixed, 95% CI) | Subtotals only | |
| 5.1 Oestrogen cream versus placebo | 1 | 153 | Mean Difference (IV, Fixed, 95% CI) | 23.7 [17.25, 30.15] |
| 6 Adverse events (breast disorders) | 0 | Odds Ratio (M‐H, Fixed, 95% CI) | Subtotals only | |
| 7 Adverse events (total adverse events) Show forest plot | 1 | Odds Ratio (M‐H, Fixed, 95% CI) | Subtotals only | |
| 7.1 Oestrogen cream versus non hormonal lubricant gel | 1 | 50 | Odds Ratio (M‐H, Fixed, 95% CI) | 10.67 [0.54, 209.64] |
| 8 Adherence to treatment | 0 | Odds Ratio (M‐H, Fixed, 95% CI) | Subtotals only | |