| 1 Death Show forest plot | 6 | | Risk Ratio (M‐H, Fixed, 95% CI) | Subtotals only |
|
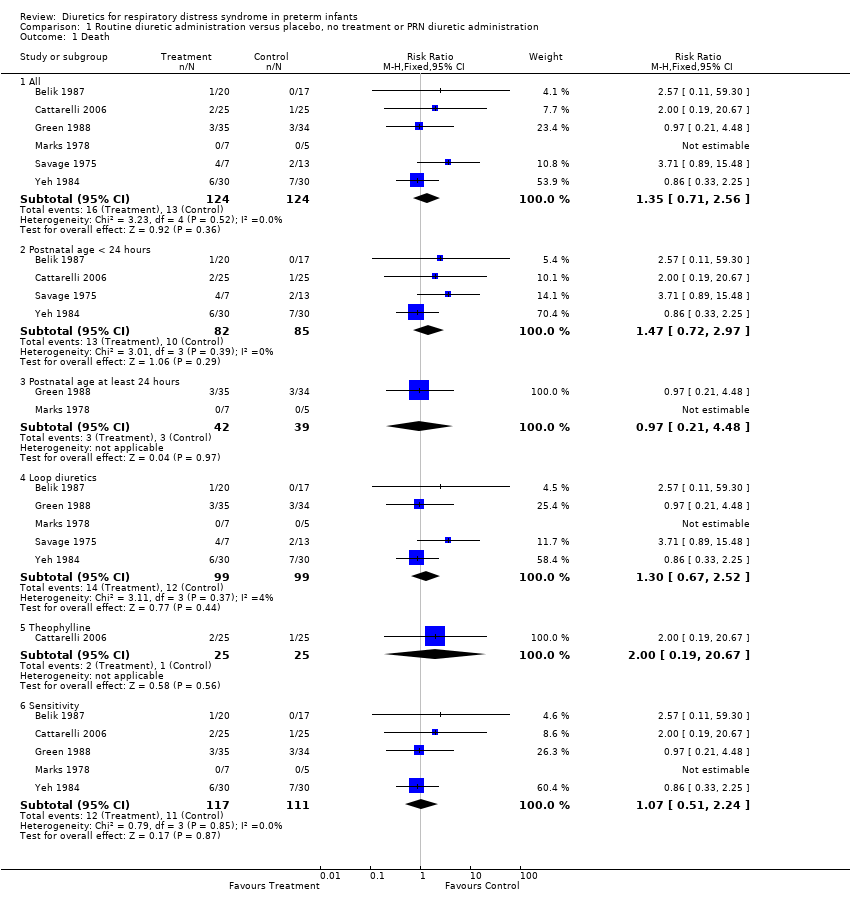
| 1.1 All | 6 | 248 | Risk Ratio (M‐H, Fixed, 95% CI) | 1.35 [0.71, 2.56] |
| 1.2 Postnatal age < 24 hours | 4 | 167 | Risk Ratio (M‐H, Fixed, 95% CI) | 1.47 [0.72, 2.97] |
| 1.3 Postnatal age at least 24 hours | 2 | 81 | Risk Ratio (M‐H, Fixed, 95% CI) | 0.97 [0.21, 4.48] |
| 1.4 Loop diuretics | 5 | 198 | Risk Ratio (M‐H, Fixed, 95% CI) | 1.30 [0.67, 2.52] |
| 1.5 Theophylline | 1 | 50 | Risk Ratio (M‐H, Fixed, 95% CI) | 2.0 [0.19, 20.67] |
| 1.6 Sensitivity | 5 | 228 | Risk Ratio (M‐H, Fixed, 95% CI) | 1.07 [0.51, 2.24] |
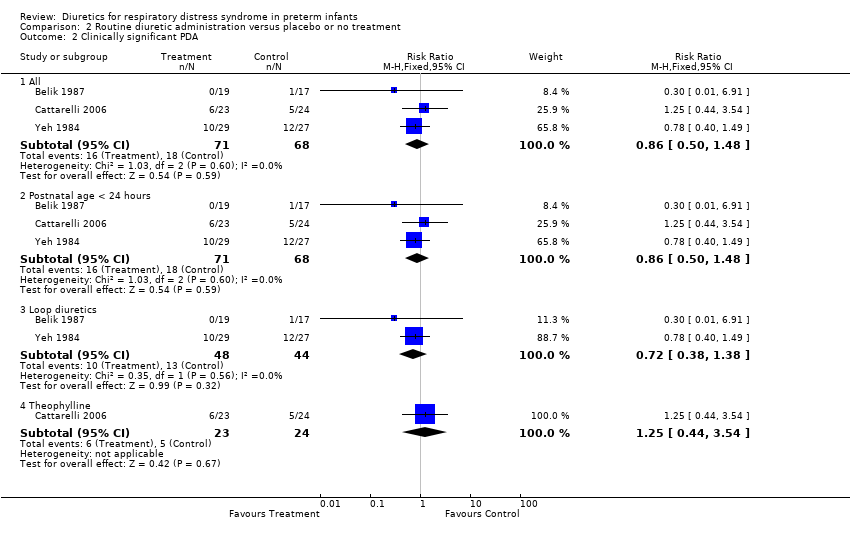
| 2 Clinically significant PDA Show forest plot | 4 | | Risk Ratio (M‐H, Fixed, 95% CI) | Subtotals only |
|
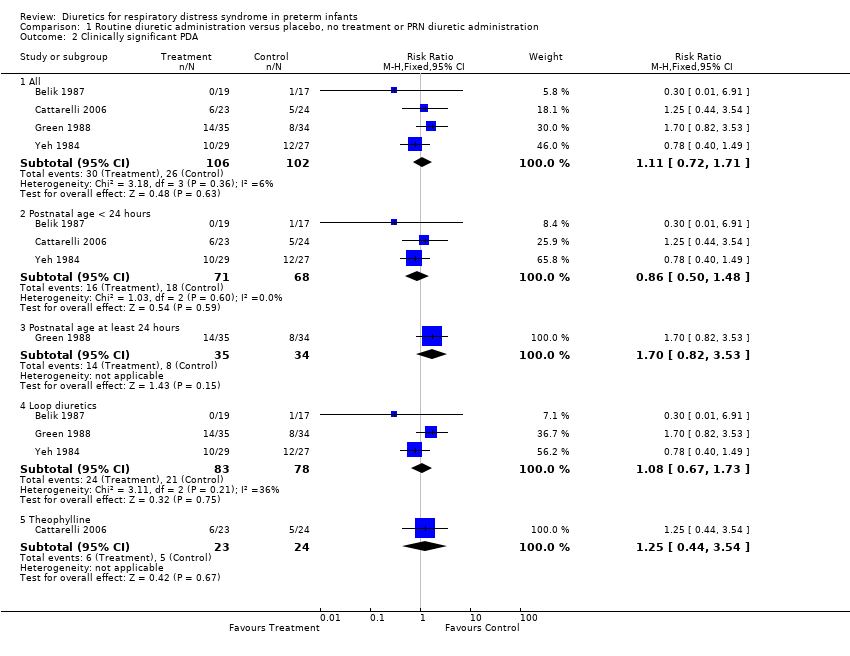
| 2.1 All | 4 | 208 | Risk Ratio (M‐H, Fixed, 95% CI) | 1.11 [0.72, 1.71] |
| 2.2 Postnatal age < 24 hours | 3 | 139 | Risk Ratio (M‐H, Fixed, 95% CI) | 0.86 [0.50, 1.48] |
| 2.3 Postnatal age at least 24 hours | 1 | 69 | Risk Ratio (M‐H, Fixed, 95% CI) | 1.7 [0.82, 3.53] |
| 2.4 Loop diuretics | 3 | 161 | Risk Ratio (M‐H, Fixed, 95% CI) | 1.08 [0.67, 1.73] |
| 2.5 Theophylline | 1 | 47 | Risk Ratio (M‐H, Fixed, 95% CI) | 1.25 [0.44, 3.54] |
| 3 Hypovolemic shock Show forest plot | 1 | 12 | Risk Ratio (M‐H, Fixed, 95% CI) | 4.0 [0.20, 82.01] |
|
| 3.1 Postnatal age at least 24 hours | 1 | 12 | Risk Ratio (M‐H, Fixed, 95% CI) | 4.0 [0.20, 82.01] |
| 4 Change in plasma volume (ml/kg) from 48 to 96 hours of life Show forest plot | 1 | 69 | Mean Difference (IV, Fixed, 95% CI) | ‐7.7 [‐11.74, ‐3.66] |
|
| 4.1 Postnatal age at least 24 hours | 1 | 69 | Mean Difference (IV, Fixed, 95% CI) | ‐7.7 [‐11.74, ‐3.66] |
| 5 Change in cardiovascular stability index from 48 to 96 hours of life Show forest plot | 1 | 69 | Mean Difference (IV, Fixed, 95% CI) | 0.77 [‐0.14, 1.68] |
|
| 5.1 Postnatal age at least 24 hours | 1 | 69 | Mean Difference (IV, Fixed, 95% CI) | 0.77 [‐0.14, 1.68] |
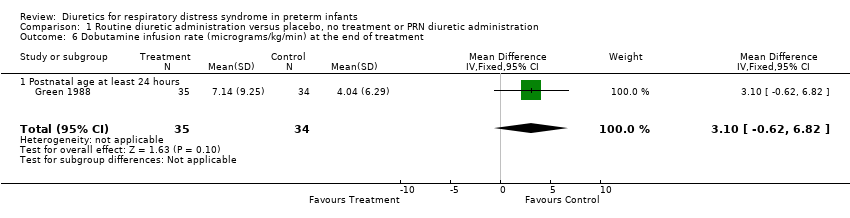
| 6 Dobutamine infusion rate (micrograms/kg/min) at the end of treatment Show forest plot | 1 | 69 | Mean Difference (IV, Fixed, 95% CI) | 3.10 [‐0.62, 6.82] |
|
| 6.1 Postnatal age at least 24 hours | 1 | 69 | Mean Difference (IV, Fixed, 95% CI) | 3.10 [‐0.62, 6.82] |
| 7 Dopamine infusion rate (micrograms/kg/min) at the end of treatment Show forest plot | 1 | 69 | Mean Difference (IV, Fixed, 95% CI) | 2.41 [‐0.07, 4.89] |
|
| 7.1 Postnatal age at least 24 hours | 1 | 69 | Mean Difference (IV, Fixed, 95% CI) | 2.41 [‐0.07, 4.89] |
| 8 Change in colloid infusion rate (ml/kg/hour) at the end of treatment Show forest plot | 1 | 69 | Mean Difference (IV, Fixed, 95% CI) | ‐0.86 [‐4.30, 2.58] |
|
| 8.1 Postnatal age at least 24 hours | 1 | 69 | Mean Difference (IV, Fixed, 95% CI) | ‐0.86 [‐4.30, 2.58] |
| 9 Failure to extubate within 3 days after study entry Show forest plot | 1 | 56 | Risk Ratio (M‐H, Fixed, 95% CI) | 0.65 [0.45, 0.93] |
|
| 9.1 Postnatal age < 24 hours | 1 | 56 | Risk Ratio (M‐H, Fixed, 95% CI) | 0.65 [0.45, 0.93] |
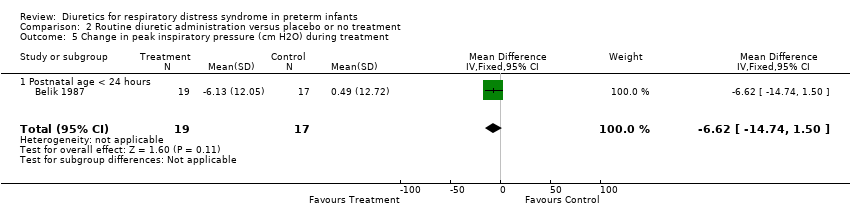
| 10 Change in peak inspiratory pressure (cm H2O) during treatment Show forest plot | 1 | 36 | Mean Difference (IV, Fixed, 95% CI) | ‐6.62 [‐14.74, 1.50] |
|
| 10.1 Postnatal age < 24 hours | 1 | 36 | Mean Difference (IV, Fixed, 95% CI) | ‐6.62 [‐14.74, 1.50] |
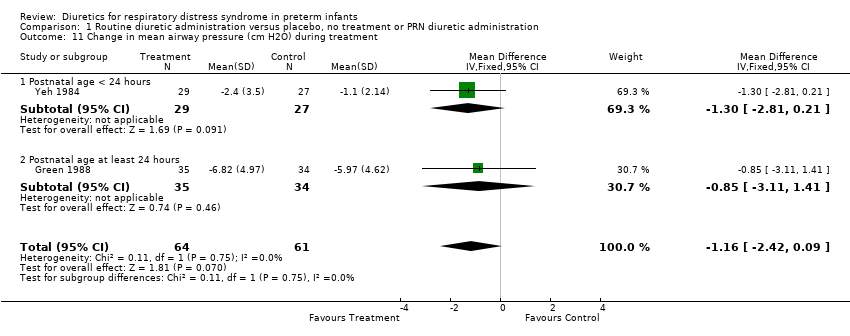
| 11 Change in mean airway pressure (cm H2O) during treatment Show forest plot | 2 | 125 | Mean Difference (IV, Fixed, 95% CI) | ‐1.16 [‐2.42, 0.09] |
|
| 11.1 Postnatal age < 24 hours | 1 | 56 | Mean Difference (IV, Fixed, 95% CI) | ‐1.30 [‐2.81, 0.21] |
| 11.2 Postnatal age at least 24 hours | 1 | 69 | Mean Difference (IV, Fixed, 95% CI) | ‐0.85 [‐3.11, 1.41] |
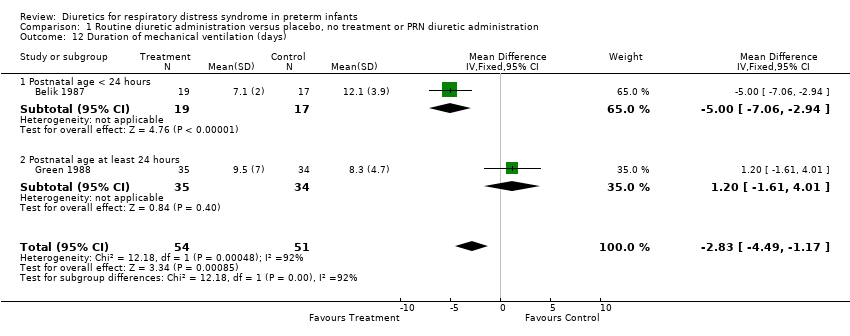
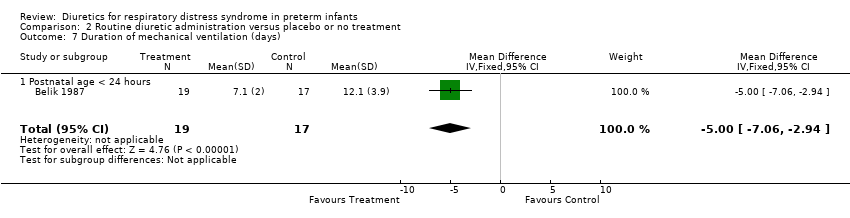
| 12 Duration of mechanical ventilation (days) Show forest plot | 2 | 105 | Mean Difference (IV, Fixed, 95% CI) | ‐2.83 [‐4.49, ‐1.17] |
|
| 12.1 Postnatal age < 24 hours | 1 | 36 | Mean Difference (IV, Fixed, 95% CI) | ‐5.0 [‐7.06, ‐2.94] |
| 12.2 Postnatal age at least 24 hours | 1 | 69 | Mean Difference (IV, Fixed, 95% CI) | 1.20 [‐1.61, 4.01] |
| 13 Change in FiO2 during treatment Show forest plot | 2 | 92 | Mean Difference (IV, Fixed, 95% CI) | ‐0.05 [‐0.13, 0.03] |
|
| 13.1 Postnatal age < 24 hours | 2 | 92 | Mean Difference (IV, Fixed, 95% CI) | ‐0.05 [‐0.13, 0.03] |
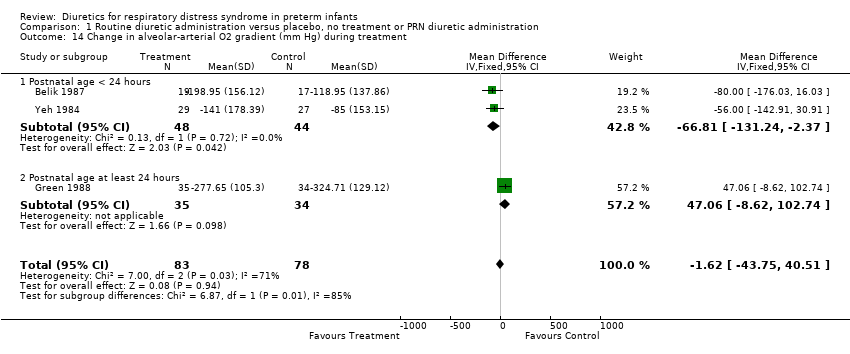
| 14 Change in alveolar‐arterial O2 gradient (mm Hg) during treatment Show forest plot | 3 | 161 | Mean Difference (IV, Fixed, 95% CI) | ‐1.62 [‐43.75, 40.51] |
|
| 14.1 Postnatal age < 24 hours | 2 | 92 | Mean Difference (IV, Fixed, 95% CI) | ‐66.81 [‐131.24, ‐2.37] |
| 14.2 Postnatal age at least 24 hours | 1 | 69 | Mean Difference (IV, Fixed, 95% CI) | 47.06 [‐8.62, 102.74] |
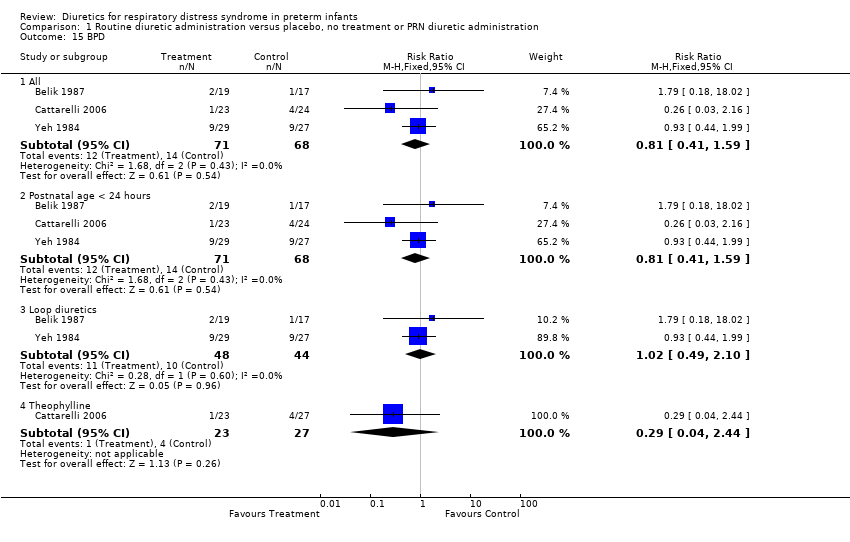
| 15 BPD Show forest plot | 3 | | Risk Ratio (M‐H, Fixed, 95% CI) | Subtotals only |
|
| 15.1 All | 3 | 139 | Risk Ratio (M‐H, Fixed, 95% CI) | 0.81 [0.41, 1.59] |
| 15.2 Postnatal age < 24 hours | 3 | 139 | Risk Ratio (M‐H, Fixed, 95% CI) | 0.81 [0.41, 1.59] |
| 15.3 Loop diuretics | 2 | 92 | Risk Ratio (M‐H, Fixed, 95% CI) | 1.02 [0.49, 2.10] |
| 15.4 Theophylline | 1 | 50 | Risk Ratio (M‐H, Fixed, 95% CI) | 0.29 [0.04, 2.44] |
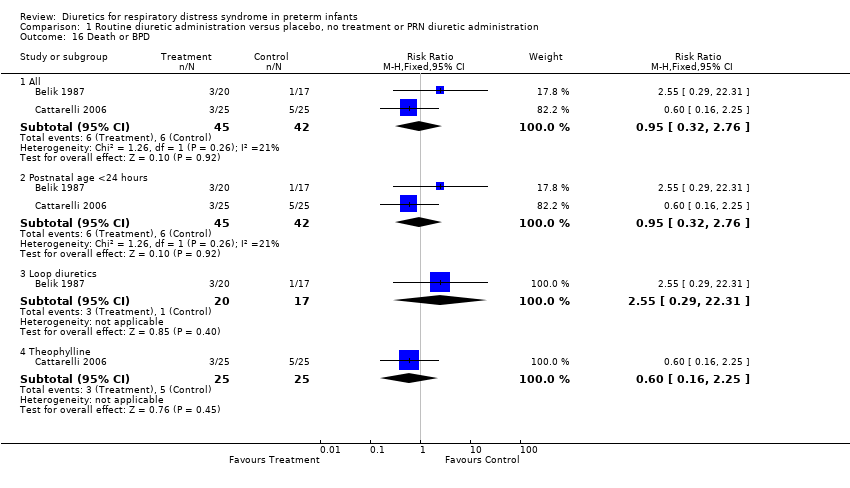
| 16 Death or BPD Show forest plot | 2 | | Risk Ratio (M‐H, Fixed, 95% CI) | Subtotals only |
|
| 16.1 All | 2 | 87 | Risk Ratio (M‐H, Fixed, 95% CI) | 0.95 [0.32, 2.76] |
| 16.2 Postnatal age <24 hours | 2 | 87 | Risk Ratio (M‐H, Fixed, 95% CI) | 0.95 [0.32, 2.76] |
| 16.3 Loop diuretics | 1 | 37 | Risk Ratio (M‐H, Fixed, 95% CI) | 2.55 [0.29, 22.31] |
| 16.4 Theophylline | 1 | 50 | Risk Ratio (M‐H, Fixed, 95% CI) | 0.6 [0.16, 2.25] |
| 17 Duration of oxygen supplementation (days) Show forest plot | 3 | 161 | Mean Difference (IV, Fixed, 95% CI) | ‐0.50 [‐2.51, 1.50] |
|
| 17.1 Postnatal age < 24 hours | 2 | 92 | Mean Difference (IV, Fixed, 95% CI) | ‐0.22 [‐2.40, 1.96] |
| 17.2 Postnatal age at least 24 hours | 1 | 69 | Mean Difference (IV, Fixed, 95% CI) | ‐2.10 [‐7.28, 3.08] |
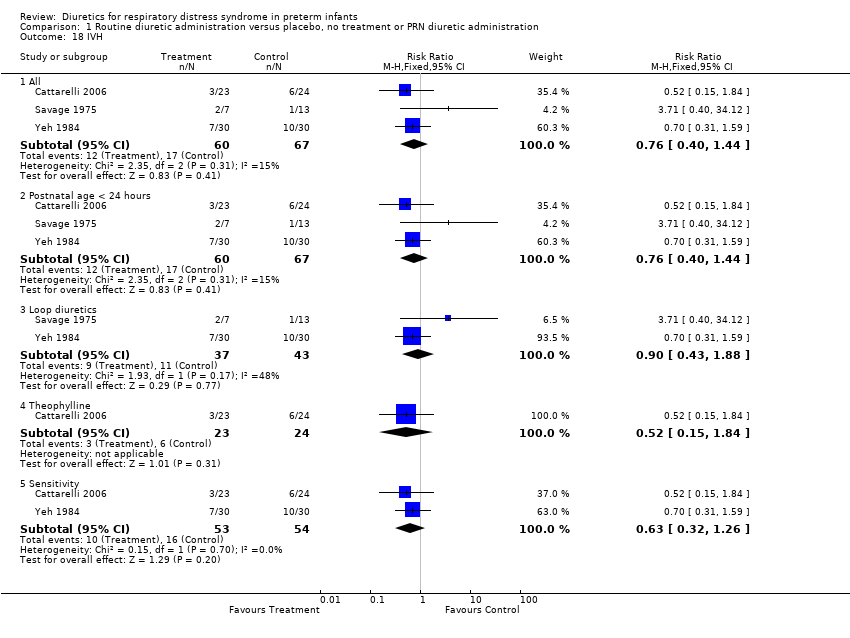
| 18 IVH Show forest plot | 3 | | Risk Ratio (M‐H, Fixed, 95% CI) | Subtotals only |
|
| 18.1 All | 3 | 127 | Risk Ratio (M‐H, Fixed, 95% CI) | 0.76 [0.40, 1.44] |
| 18.2 Postnatal age < 24 hours | 3 | 127 | Risk Ratio (M‐H, Fixed, 95% CI) | 0.76 [0.40, 1.44] |
| 18.3 Loop diuretics | 2 | 80 | Risk Ratio (M‐H, Fixed, 95% CI) | 0.90 [0.43, 1.88] |
| 18.4 Theophylline | 1 | 47 | Risk Ratio (M‐H, Fixed, 95% CI) | 0.52 [0.15, 1.84] |
| 18.5 Sensitivity | 2 | 107 | Risk Ratio (M‐H, Fixed, 95% CI) | 0.63 [0.32, 1.26] |
| 19 Severe IVH (grade III or IV) Show forest plot | 1 | 47 | Risk Ratio (M‐H, Fixed, 95% CI) | 1.04 [0.07, 15.72] |
|
| 19.1 All studies | 1 | 47 | Risk Ratio (M‐H, Fixed, 95% CI) | 1.04 [0.07, 15.72] |
| 20 Duration of hospitalization (days) Show forest plot | 2 | | Mean Difference (IV, Fixed, 95% CI) | Subtotals only |
|
| 20.1 All | 2 | 103 | Mean Difference (IV, Fixed, 95% CI) | 2.43 [‐10.71, 15.57] |
| 20.2 Postnatal age < 24 hours | 2 | 103 | Mean Difference (IV, Fixed, 95% CI) | 2.43 [‐10.71, 15.57] |
| 20.3 Loop diuretics | 1 | 56 | Mean Difference (IV, Fixed, 95% CI) | 6.60 [‐16.38, 29.58] |
| 20.4 Theophylline | 1 | 47 | Mean Difference (IV, Fixed, 95% CI) | 0.40 [‐15.62, 16.42] |
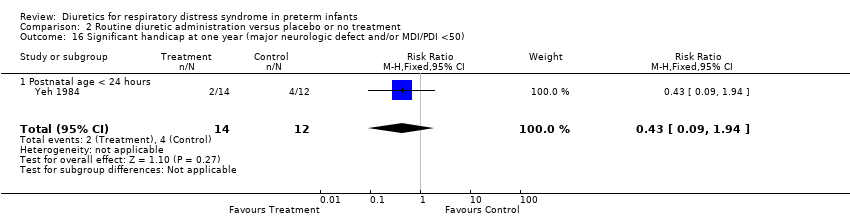
| 21 Significant handicap at one year (major neurologic defect and/or MDI/PDI <50) Show forest plot | 1 | 26 | Risk Ratio (M‐H, Fixed, 95% CI) | 0.43 [0.09, 1.94] |
|
| 21.1 Postnatal age < 24 hours | 1 | 26 | Risk Ratio (M‐H, Fixed, 95% CI) | 0.43 [0.09, 1.94] |
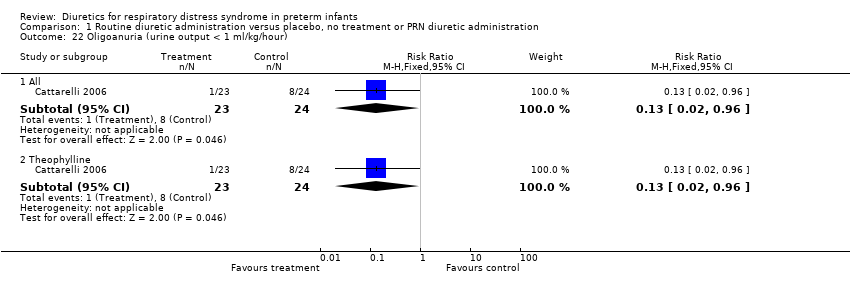
| 22 Oligoanuria (urine output < 1 ml/kg/hour) Show forest plot | 1 | | Risk Ratio (M‐H, Fixed, 95% CI) | Subtotals only |
|
| 22.1 All | 1 | 47 | Risk Ratio (M‐H, Fixed, 95% CI) | 0.13 [0.02, 0.96] |
| 22.2 Theophylline | 1 | 47 | Risk Ratio (M‐H, Fixed, 95% CI) | 0.13 [0.02, 0.96] |
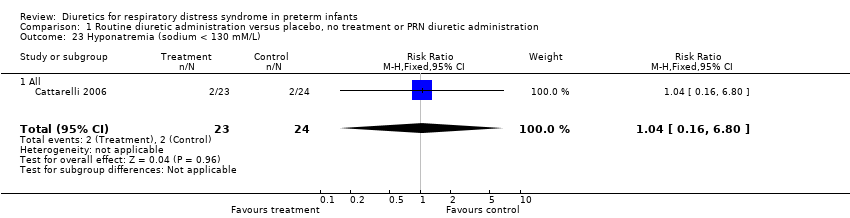
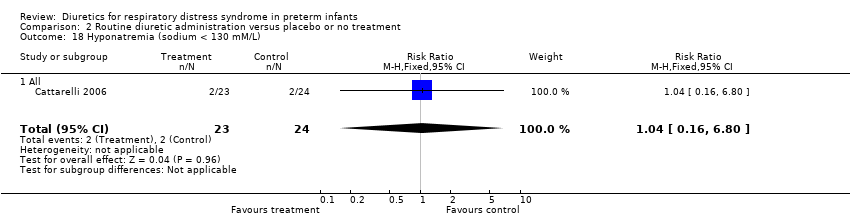
| 23 Hyponatremia (sodium < 130 mM/L) Show forest plot | 1 | 47 | Risk Ratio (M‐H, Fixed, 95% CI) | 1.04 [0.16, 6.80] |
|
| 23.1 All | 1 | 47 | Risk Ratio (M‐H, Fixed, 95% CI) | 1.04 [0.16, 6.80] |
| 24 Hyperkalemia (potassium > 6.5 mM/L) Show forest plot | 1 | 47 | Risk Ratio (M‐H, Fixed, 95% CI) | 1.57 [0.29, 8.53] |
|
| 24.1 All | 1 | 47 | Risk Ratio (M‐H, Fixed, 95% CI) | 1.57 [0.29, 8.53] |