Diuréticos para el síndrome de dificultad respiratoria en recién nacidos prematuros
Referencias
References to studies included in this review
References to studies excluded from this review
Additional references
References to other published versions of this review
Characteristics of studies
Characteristics of included studies [ordered by study ID]
Ir a:
| Methods | Blinding of randomization: No. Thirty‐nine infants were entered into the study. Within each of 3 birthweight categories (< 1,000 g, 1,000‐1,500 g and >1,500 g), patients were randomized by blocks of 2: within each block, one patient was randomly allocated to treatment or control, and the other patient was entered into the other group. The method of randomization is not documented. | |
| Participants | Total number of patients entered into the study: 39 | |
| Interventions | Four doses of furosemide versus control. | |
| Outcomes | Major outcomes: urine output to intake ratio (O/I) per 8‐hour period, ventilator requirement, duration of oxygen therapy | |
| Notes | The authors used two‐way analysis of variance followed by Scheffe post‐hoc test. | |
| Risk of bias | ||
| Bias | Authors' judgement | Support for judgement |
| Random sequence generation (selection bias) | Unclear risk | The method of randomization is not documented |
| Allocation concealment (selection bias) | High risk | Blinding of randomization: No. Thirty‐nine infants were entered into the study. Within each of 3 birthweight categories (< 1,000 g, 1,000‐1,500 g and >1,500 g), patients were randomized by blocks of 2: within each block, one patient was randomly allocated to treatment or control, and the other patient was entered into the other group. |
| Blinding (performance bias and detection bias) | High risk | Blinding of intervention: no. Control patients did not receive a placebo. Blinding of outcome: not documented |
| Incomplete outcome data (attrition bias) | Unclear risk | Complete follow‐up: No. Three infants were excluded from the analysis. Of 39 randomized infants, 2 infants had an exclusion criterion described in the protocol of the study, i.e., proven sepsis (one in the treatment group, one in the control group). The third infant (treatment group) died of massive intracranial hemorrhage at 24 hours of life. Thus, after removing two infants who met criteria for exclusion, the number of patients randomized to furosemide was 20 and the number of patients in the control group was 17. |
| Methods | Blinding of randomization: yes. Randomization was done by computer. | |
| Participants | Of 54 eligible patients, 50 were entered into the study and randomly allocated to placebo or to theophylline. | |
| Interventions | Patients in the treatment group were allocated to receive i.v. theophylline 1 mg/kg daily; controls were allocated to receive an equal volume of placebo (5% dextrose in water) for three days. The first dose was given soon after it had been confirmed that inclusion criteria had been met. | |
| Outcomes | Death, BPD, Death or BPD, PDA, IVH, severe IVH, oligoanuria (urine output <1 ml per kg per hour) , serial measurements of urine output, serial serum creatinine values, blood urea nitrogen, hyponatremia, hyperkalemia, periventricular leukomalacia, retinopathy of prematurity, necrotizing enterocolitis, length of stay. | |
| Notes | Several infants received other medications that could affect outcomes of interest in this review. Eight infants in the theophylline group and twelve in the control group received furosemide, 21 in each group received dopamine, nine in the theophylline group and twelve controls received dobutamine, six in the theophylline group and four controls received ibuprofen, one control received indomethacin, and eight in the theophylline group and nine controls received caffeine. | |
| Risk of bias | ||
| Bias | Authors' judgement | Support for judgement |
| Random sequence generation (selection bias) | Low risk | Randomization was done by computer |
| Allocation concealment (selection bias) | Low risk | Blinding of randomization: yes |
| Blinding (performance bias and detection bias) | Low risk | Blinding of intervention: yes. Theophylline or placebo was prepared by a doctor from the neonatology section, not involved in patient care, using syringes with identical appearance. Blindness of outcome: yes. The medical and nursing staff were blinded to the patient assignment. |
| Incomplete outcome data (attrition bias) | Low risk | Complete follow‐up: yes |
| Methods | Blinding of randomization: yes. Randomization was done by computer. | |
| Participants | Total number of patients entered into the study: 99 | |
| Interventions | PRN furosemide vs PRN chlorothiazide. | |
| Outcomes | Major outcome variable: PDA (NEJM), survival (J Pediatr). | |
| Notes | The study was designed as (1) a sequential analysis of PDA scores in pairs of furosemide‐treated and chlorothiazide‐treated patients (NEJM) and (2) multivariate analysis of factors associated with survival (J Pediatr). | |
| Risk of bias | ||
| Bias | Authors' judgement | Support for judgement |
| Random sequence generation (selection bias) | Low risk | Randomization was done by computer |
| Allocation concealment (selection bias) | Low risk | Blinding of randomization: yes |
| Blinding (performance bias and detection bias) | Low risk | Blinding of intervention: yes. Diuretic solutions were prepared in the pharmacy and were only identified by patient name and number. |
| Incomplete outcome data (attrition bias) | High risk | Complete follow‐up: no. Of 128 infants with RDS, 27 were ineligible either because they were older than 72 hours or had already received a diuretics. Of 101 enrolled patients, 2 were dropped from the study, one because of coarctation of the aorta and the other because of inaudible heart sounds secondary to severe lung disease. Most information is available only in 66 of the randomized patients, i.e., those who effectively received diuretics (33 furosemide and 33 chlorothiazide). |
| Methods | Blinding of randomization: yes. Method of randomization is not provided. | |
| Participants | Total number of patients entered into the study: 69 | |
| Interventions | Prophylactic and PRN furosemide vs PRN furosemide | |
| Outcomes | Major outcome: mean airway pressure on day 7, incidence of hemodynamic instability, requirement for inotropic therapy, hypovolemia, mortality. | |
| Notes | The study design included sequential analysis of mean airway pressure on day 7. The study was terminated after enrolling 50 patients, because an interim analysis showed a strong suggestion of adverse cardiovascular effects in the treatment group. | |
| Risk of bias | ||
| Bias | Authors' judgement | Support for judgement |
| Random sequence generation (selection bias) | Unclear risk | Method of randomization is not provided |
| Allocation concealment (selection bias) | Low risk | Blinding of randomization: yes |
| Blinding (performance bias and detection bias) | Low risk | Blinding of intervention: yes. Furosemide and placebo was dispensed in numbered vials. Blinding of outcome: yes |
| Incomplete outcome data (attrition bias) | Low risk | Complete follow‐up: yes |
| Methods | Blinding of randomization: yes. Randomization was done using a random sampling of numbers. | |
| Participants | Total number of patients entered into the study: 12 | |
| Interventions | Single dose of furosemide vs placebo | |
| Outcomes | Blood gases, urine output, echographic measurement of the PDA. | |
| Notes | ||
| Risk of bias | ||
| Bias | Authors' judgement | Support for judgement |
| Random sequence generation (selection bias) | Low risk | Randomization was done using a random sampling of numbers |
| Allocation concealment (selection bias) | Low risk | Blinding of randomization: yes |
| Blinding (performance bias and detection bias) | Low risk | Blinding of intervention: yes. Drug and placebo were drawn up in the pharmacy and administered without the knowledge of the investigators. |
| Incomplete outcome data (attrition bias) | Low risk | Complete follow‐up: yes |
| Methods | Blinding of randomization: not documented. The method of randomization is not provided. | |
| Participants | Total number of patients entered into the study: 20 | |
| Interventions | Three doses of furosemide vs control | |
| Outcomes | Outcome variables included blood gas analyses, mortality and fluid balance. No information is provided on mean airway pressure, duration of mechanical ventilation or O2 administration. | |
| Notes | Values of blood PO2 and PCO2 before and after treatment are provided in the furosemide group but no comparable data are provided in the control group. | |
| Risk of bias | ||
| Bias | Authors' judgement | Support for judgement |
| Random sequence generation (selection bias) | Unclear risk | The method of randomization is not provided |
| Allocation concealment (selection bias) | Unclear risk | Blinding of randomization: not documented |
| Blinding (performance bias and detection bias) | High risk | Blinding of intervention: no. Control patients did not receive a placebo. Blinding of outcome: not documented |
| Incomplete outcome data (attrition bias) | Low risk | Complete follow‐up: yes |
| Methods | Blinding of randomization: yes. Sixty envelopes were prepared and kept under the control of an independent observer. | |
| Participants | Total number of patients entered into the study: 60 | |
| Interventions | Three doses of furosemide vs control. | |
| Outcomes | Major outcome: failure to extubate at 72 hours | |
| Notes | No echographic results are presented. Treatment for PDA is not documented. | |
| Risk of bias | ||
| Bias | Authors' judgement | Support for judgement |
| Random sequence generation (selection bias) | Low risk | Sixty envelopes were prepared and kept under the control of an independent observer. |
| Allocation concealment (selection bias) | Low risk | Blinding of randomization: yes |
| Blinding (performance bias and detection bias) | Unclear risk | Blinding of intervention: unclear. Control patients were treated similarly to experimental patients but did not receive furosemide. The authors do not mention whether control patients received a placebo. Blinding of outcome: not documented |
| Incomplete outcome data (attrition bias) | Unclear risk | Complete follow‐up: no. Sixty patients were randomized. Four patients were excluded from the study before analysis: 2 patients (one in each group) with group B streptococcus sepsis, and 2 patients in the control group who died within 24 hours after birth with IVH and seizures. |
Characteristics of excluded studies [ordered by study ID]
Ir a:
| Study | Reason for exclusion |
| Respiratory distress syndrome was not listed as inclusion criterion | |
| Not a controlled study | |
| Retrospective study | |
| Enrollment criteria included infants less than 10 days of age | |
| Respiratory distress syndrome was not listed as inclusion criterion | |
| Respiratory distress syndrome was not listed as inclusion criterion | |
| Not a randomized study | |
| Not a randomized study | |
| No assessment of any of the major outcome variables selected for this systematic review | |
| Enrollment criteria included either apnea or respiratory distress syndrome |
Data and analyses
| Outcome or subgroup title | No. of studies | No. of participants | Statistical method | Effect size |
| 1 Death Show forest plot | 6 | Risk Ratio (M‐H, Fixed, 95% CI) | Subtotals only | |
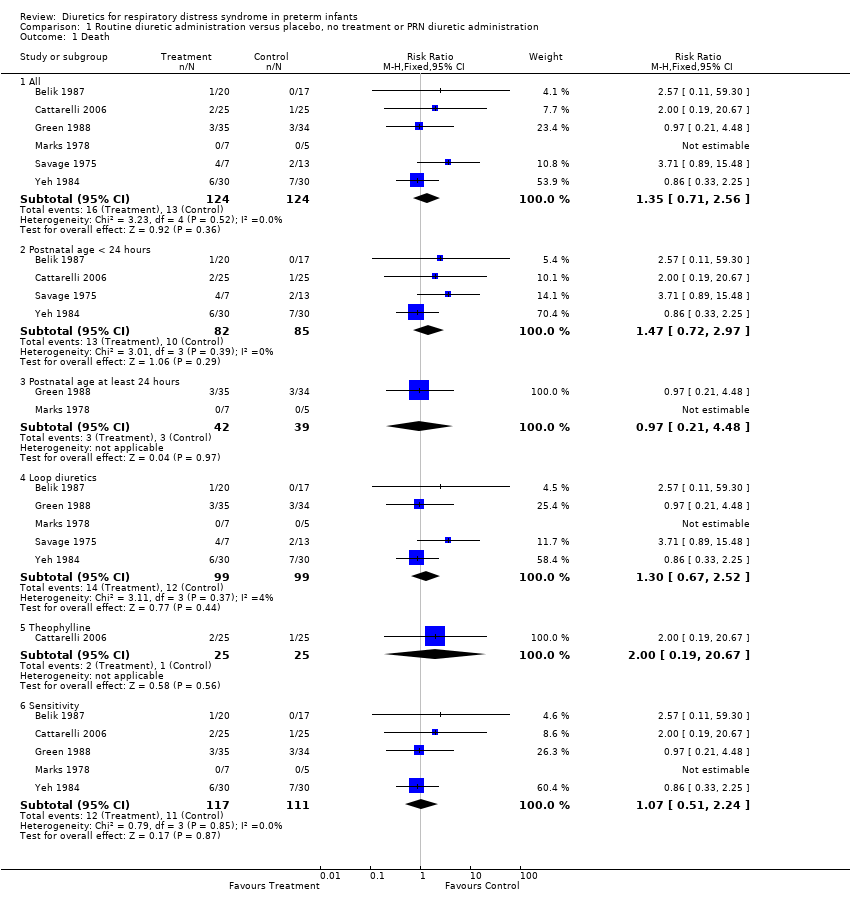
| Analysis 1.1  Comparison 1 Routine diuretic administration versus placebo, no treatment or PRN diuretic administration, Outcome 1 Death. | ||||
| 1.1 All | 6 | 248 | Risk Ratio (M‐H, Fixed, 95% CI) | 1.35 [0.71, 2.56] |
| 1.2 Postnatal age < 24 hours | 4 | 167 | Risk Ratio (M‐H, Fixed, 95% CI) | 1.47 [0.72, 2.97] |
| 1.3 Postnatal age at least 24 hours | 2 | 81 | Risk Ratio (M‐H, Fixed, 95% CI) | 0.97 [0.21, 4.48] |
| 1.4 Loop diuretics | 5 | 198 | Risk Ratio (M‐H, Fixed, 95% CI) | 1.30 [0.67, 2.52] |
| 1.5 Theophylline | 1 | 50 | Risk Ratio (M‐H, Fixed, 95% CI) | 2.0 [0.19, 20.67] |
| 1.6 Sensitivity | 5 | 228 | Risk Ratio (M‐H, Fixed, 95% CI) | 1.07 [0.51, 2.24] |
| 2 Clinically significant PDA Show forest plot | 4 | Risk Ratio (M‐H, Fixed, 95% CI) | Subtotals only | |
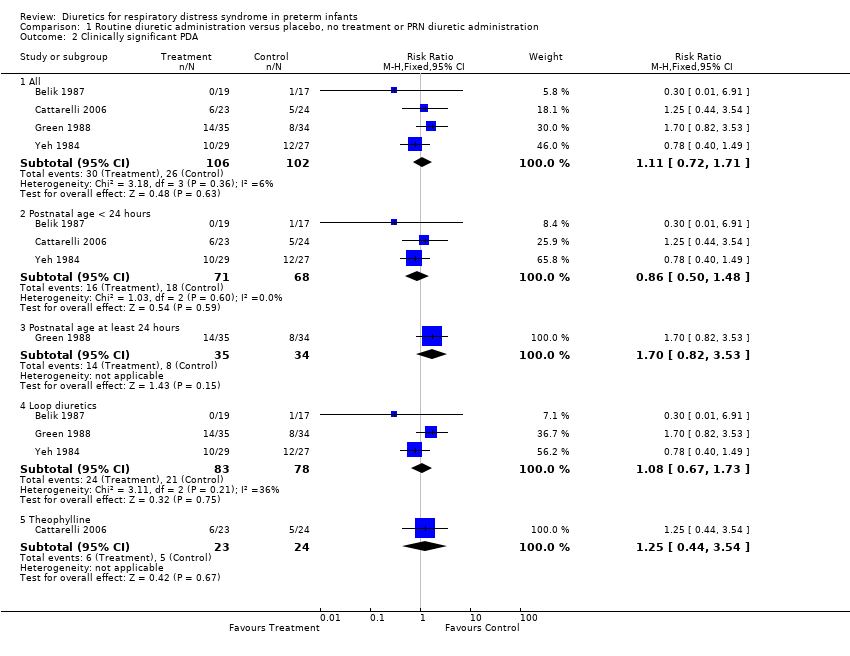
| Analysis 1.2  Comparison 1 Routine diuretic administration versus placebo, no treatment or PRN diuretic administration, Outcome 2 Clinically significant PDA. | ||||
| 2.1 All | 4 | 208 | Risk Ratio (M‐H, Fixed, 95% CI) | 1.11 [0.72, 1.71] |
| 2.2 Postnatal age < 24 hours | 3 | 139 | Risk Ratio (M‐H, Fixed, 95% CI) | 0.86 [0.50, 1.48] |
| 2.3 Postnatal age at least 24 hours | 1 | 69 | Risk Ratio (M‐H, Fixed, 95% CI) | 1.7 [0.82, 3.53] |
| 2.4 Loop diuretics | 3 | 161 | Risk Ratio (M‐H, Fixed, 95% CI) | 1.08 [0.67, 1.73] |
| 2.5 Theophylline | 1 | 47 | Risk Ratio (M‐H, Fixed, 95% CI) | 1.25 [0.44, 3.54] |
| 3 Hypovolemic shock Show forest plot | 1 | 12 | Risk Ratio (M‐H, Fixed, 95% CI) | 4.0 [0.20, 82.01] |
| Analysis 1.3  Comparison 1 Routine diuretic administration versus placebo, no treatment or PRN diuretic administration, Outcome 3 Hypovolemic shock. | ||||
| 3.1 Postnatal age at least 24 hours | 1 | 12 | Risk Ratio (M‐H, Fixed, 95% CI) | 4.0 [0.20, 82.01] |
| 4 Change in plasma volume (ml/kg) from 48 to 96 hours of life Show forest plot | 1 | 69 | Mean Difference (IV, Fixed, 95% CI) | ‐7.7 [‐11.74, ‐3.66] |
| Analysis 1.4  Comparison 1 Routine diuretic administration versus placebo, no treatment or PRN diuretic administration, Outcome 4 Change in plasma volume (ml/kg) from 48 to 96 hours of life. | ||||
| 4.1 Postnatal age at least 24 hours | 1 | 69 | Mean Difference (IV, Fixed, 95% CI) | ‐7.7 [‐11.74, ‐3.66] |
| 5 Change in cardiovascular stability index from 48 to 96 hours of life Show forest plot | 1 | 69 | Mean Difference (IV, Fixed, 95% CI) | 0.77 [‐0.14, 1.68] |
| Analysis 1.5  Comparison 1 Routine diuretic administration versus placebo, no treatment or PRN diuretic administration, Outcome 5 Change in cardiovascular stability index from 48 to 96 hours of life. | ||||
| 5.1 Postnatal age at least 24 hours | 1 | 69 | Mean Difference (IV, Fixed, 95% CI) | 0.77 [‐0.14, 1.68] |
| 6 Dobutamine infusion rate (micrograms/kg/min) at the end of treatment Show forest plot | 1 | 69 | Mean Difference (IV, Fixed, 95% CI) | 3.10 [‐0.62, 6.82] |
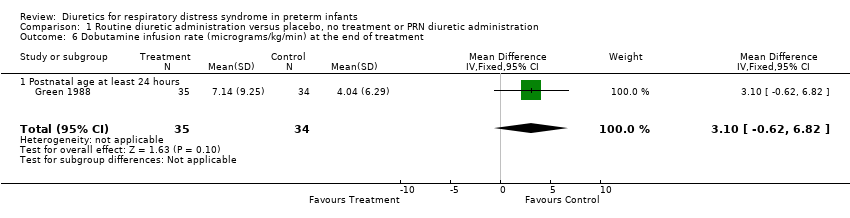
| Analysis 1.6  Comparison 1 Routine diuretic administration versus placebo, no treatment or PRN diuretic administration, Outcome 6 Dobutamine infusion rate (micrograms/kg/min) at the end of treatment. | ||||
| 6.1 Postnatal age at least 24 hours | 1 | 69 | Mean Difference (IV, Fixed, 95% CI) | 3.10 [‐0.62, 6.82] |
| 7 Dopamine infusion rate (micrograms/kg/min) at the end of treatment Show forest plot | 1 | 69 | Mean Difference (IV, Fixed, 95% CI) | 2.41 [‐0.07, 4.89] |
| Analysis 1.7  Comparison 1 Routine diuretic administration versus placebo, no treatment or PRN diuretic administration, Outcome 7 Dopamine infusion rate (micrograms/kg/min) at the end of treatment. | ||||
| 7.1 Postnatal age at least 24 hours | 1 | 69 | Mean Difference (IV, Fixed, 95% CI) | 2.41 [‐0.07, 4.89] |
| 8 Change in colloid infusion rate (ml/kg/hour) at the end of treatment Show forest plot | 1 | 69 | Mean Difference (IV, Fixed, 95% CI) | ‐0.86 [‐4.30, 2.58] |
| Analysis 1.8  Comparison 1 Routine diuretic administration versus placebo, no treatment or PRN diuretic administration, Outcome 8 Change in colloid infusion rate (ml/kg/hour) at the end of treatment. | ||||
| 8.1 Postnatal age at least 24 hours | 1 | 69 | Mean Difference (IV, Fixed, 95% CI) | ‐0.86 [‐4.30, 2.58] |
| 9 Failure to extubate within 3 days after study entry Show forest plot | 1 | 56 | Risk Ratio (M‐H, Fixed, 95% CI) | 0.65 [0.45, 0.93] |
| Analysis 1.9  Comparison 1 Routine diuretic administration versus placebo, no treatment or PRN diuretic administration, Outcome 9 Failure to extubate within 3 days after study entry. | ||||
| 9.1 Postnatal age < 24 hours | 1 | 56 | Risk Ratio (M‐H, Fixed, 95% CI) | 0.65 [0.45, 0.93] |
| 10 Change in peak inspiratory pressure (cm H2O) during treatment Show forest plot | 1 | 36 | Mean Difference (IV, Fixed, 95% CI) | ‐6.62 [‐14.74, 1.50] |
| Analysis 1.10  Comparison 1 Routine diuretic administration versus placebo, no treatment or PRN diuretic administration, Outcome 10 Change in peak inspiratory pressure (cm H2O) during treatment. | ||||
| 10.1 Postnatal age < 24 hours | 1 | 36 | Mean Difference (IV, Fixed, 95% CI) | ‐6.62 [‐14.74, 1.50] |
| 11 Change in mean airway pressure (cm H2O) during treatment Show forest plot | 2 | 125 | Mean Difference (IV, Fixed, 95% CI) | ‐1.16 [‐2.42, 0.09] |
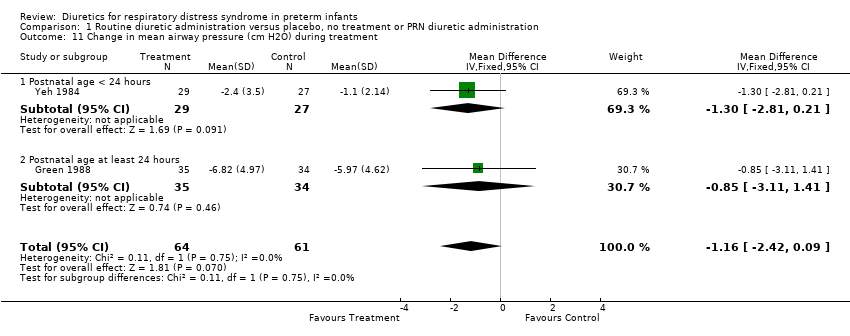
| Analysis 1.11  Comparison 1 Routine diuretic administration versus placebo, no treatment or PRN diuretic administration, Outcome 11 Change in mean airway pressure (cm H2O) during treatment. | ||||
| 11.1 Postnatal age < 24 hours | 1 | 56 | Mean Difference (IV, Fixed, 95% CI) | ‐1.30 [‐2.81, 0.21] |
| 11.2 Postnatal age at least 24 hours | 1 | 69 | Mean Difference (IV, Fixed, 95% CI) | ‐0.85 [‐3.11, 1.41] |
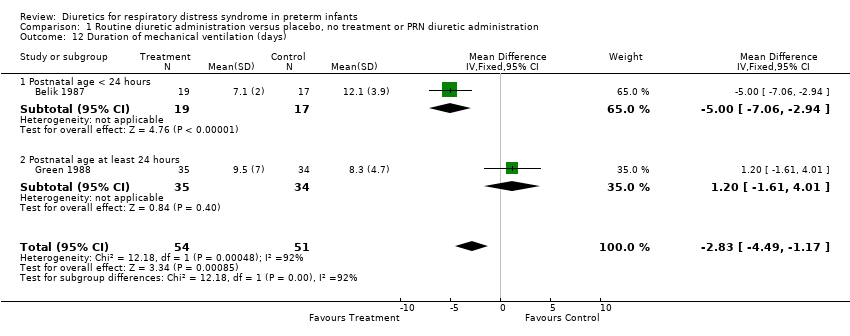
| 12 Duration of mechanical ventilation (days) Show forest plot | 2 | 105 | Mean Difference (IV, Fixed, 95% CI) | ‐2.83 [‐4.49, ‐1.17] |
| Analysis 1.12  Comparison 1 Routine diuretic administration versus placebo, no treatment or PRN diuretic administration, Outcome 12 Duration of mechanical ventilation (days). | ||||
| 12.1 Postnatal age < 24 hours | 1 | 36 | Mean Difference (IV, Fixed, 95% CI) | ‐5.0 [‐7.06, ‐2.94] |
| 12.2 Postnatal age at least 24 hours | 1 | 69 | Mean Difference (IV, Fixed, 95% CI) | 1.20 [‐1.61, 4.01] |
| 13 Change in FiO2 during treatment Show forest plot | 2 | 92 | Mean Difference (IV, Fixed, 95% CI) | ‐0.05 [‐0.13, 0.03] |
| Analysis 1.13  Comparison 1 Routine diuretic administration versus placebo, no treatment or PRN diuretic administration, Outcome 13 Change in FiO2 during treatment. | ||||
| 13.1 Postnatal age < 24 hours | 2 | 92 | Mean Difference (IV, Fixed, 95% CI) | ‐0.05 [‐0.13, 0.03] |
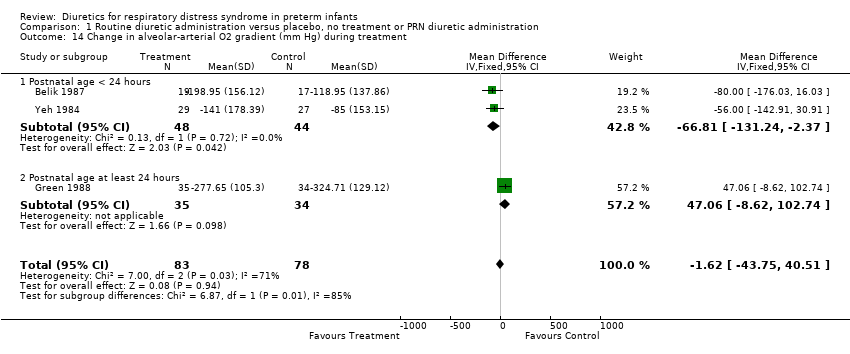
| 14 Change in alveolar‐arterial O2 gradient (mm Hg) during treatment Show forest plot | 3 | 161 | Mean Difference (IV, Fixed, 95% CI) | ‐1.62 [‐43.75, 40.51] |
| Analysis 1.14  Comparison 1 Routine diuretic administration versus placebo, no treatment or PRN diuretic administration, Outcome 14 Change in alveolar‐arterial O2 gradient (mm Hg) during treatment. | ||||
| 14.1 Postnatal age < 24 hours | 2 | 92 | Mean Difference (IV, Fixed, 95% CI) | ‐66.81 [‐131.24, ‐2.37] |
| 14.2 Postnatal age at least 24 hours | 1 | 69 | Mean Difference (IV, Fixed, 95% CI) | 47.06 [‐8.62, 102.74] |
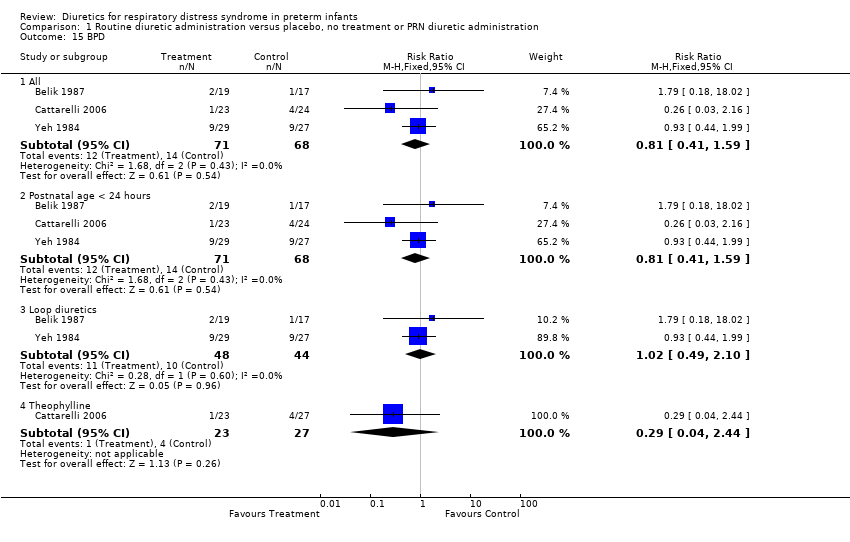
| 15 BPD Show forest plot | 3 | Risk Ratio (M‐H, Fixed, 95% CI) | Subtotals only | |
| Analysis 1.15  Comparison 1 Routine diuretic administration versus placebo, no treatment or PRN diuretic administration, Outcome 15 BPD. | ||||
| 15.1 All | 3 | 139 | Risk Ratio (M‐H, Fixed, 95% CI) | 0.81 [0.41, 1.59] |
| 15.2 Postnatal age < 24 hours | 3 | 139 | Risk Ratio (M‐H, Fixed, 95% CI) | 0.81 [0.41, 1.59] |
| 15.3 Loop diuretics | 2 | 92 | Risk Ratio (M‐H, Fixed, 95% CI) | 1.02 [0.49, 2.10] |
| 15.4 Theophylline | 1 | 50 | Risk Ratio (M‐H, Fixed, 95% CI) | 0.29 [0.04, 2.44] |
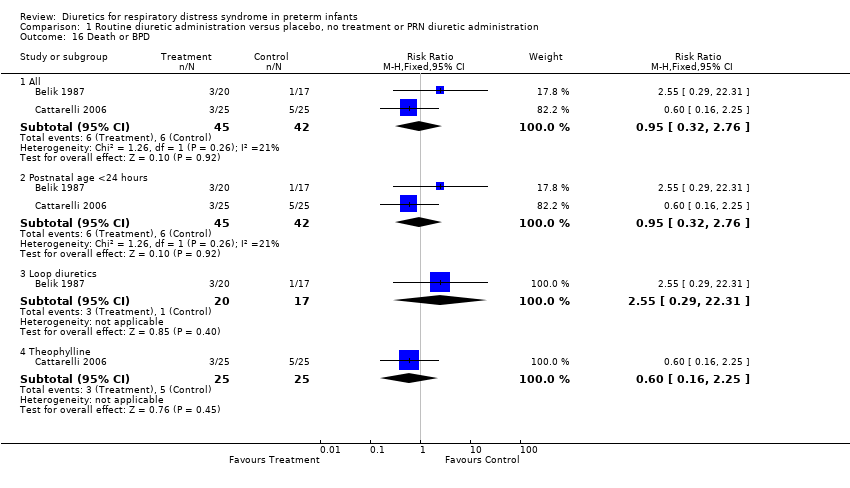
| 16 Death or BPD Show forest plot | 2 | Risk Ratio (M‐H, Fixed, 95% CI) | Subtotals only | |
| Analysis 1.16  Comparison 1 Routine diuretic administration versus placebo, no treatment or PRN diuretic administration, Outcome 16 Death or BPD. | ||||
| 16.1 All | 2 | 87 | Risk Ratio (M‐H, Fixed, 95% CI) | 0.95 [0.32, 2.76] |
| 16.2 Postnatal age <24 hours | 2 | 87 | Risk Ratio (M‐H, Fixed, 95% CI) | 0.95 [0.32, 2.76] |
| 16.3 Loop diuretics | 1 | 37 | Risk Ratio (M‐H, Fixed, 95% CI) | 2.55 [0.29, 22.31] |
| 16.4 Theophylline | 1 | 50 | Risk Ratio (M‐H, Fixed, 95% CI) | 0.6 [0.16, 2.25] |
| 17 Duration of oxygen supplementation (days) Show forest plot | 3 | 161 | Mean Difference (IV, Fixed, 95% CI) | ‐0.50 [‐2.51, 1.50] |
| Analysis 1.17  Comparison 1 Routine diuretic administration versus placebo, no treatment or PRN diuretic administration, Outcome 17 Duration of oxygen supplementation (days). | ||||
| 17.1 Postnatal age < 24 hours | 2 | 92 | Mean Difference (IV, Fixed, 95% CI) | ‐0.22 [‐2.40, 1.96] |
| 17.2 Postnatal age at least 24 hours | 1 | 69 | Mean Difference (IV, Fixed, 95% CI) | ‐2.10 [‐7.28, 3.08] |
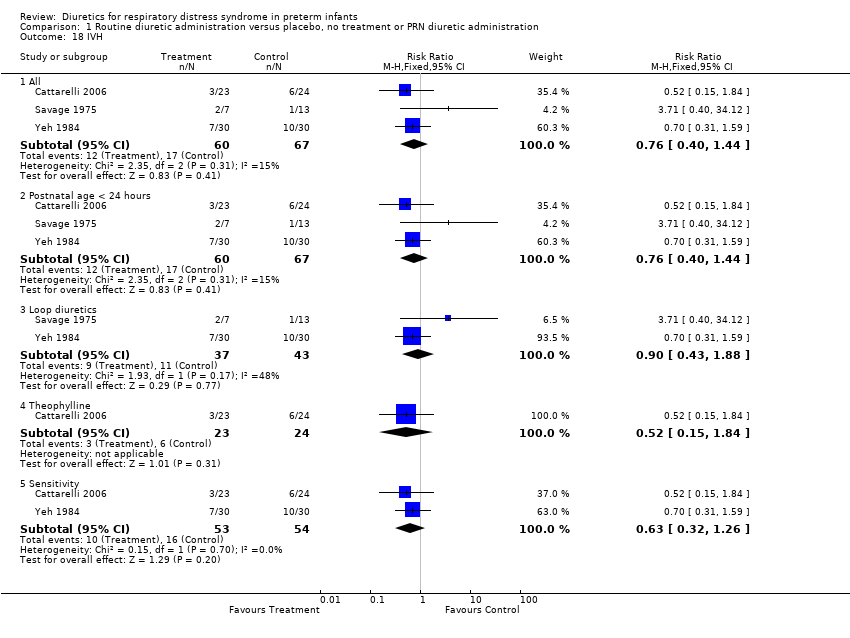
| 18 IVH Show forest plot | 3 | Risk Ratio (M‐H, Fixed, 95% CI) | Subtotals only | |
| Analysis 1.18  Comparison 1 Routine diuretic administration versus placebo, no treatment or PRN diuretic administration, Outcome 18 IVH. | ||||
| 18.1 All | 3 | 127 | Risk Ratio (M‐H, Fixed, 95% CI) | 0.76 [0.40, 1.44] |
| 18.2 Postnatal age < 24 hours | 3 | 127 | Risk Ratio (M‐H, Fixed, 95% CI) | 0.76 [0.40, 1.44] |
| 18.3 Loop diuretics | 2 | 80 | Risk Ratio (M‐H, Fixed, 95% CI) | 0.90 [0.43, 1.88] |
| 18.4 Theophylline | 1 | 47 | Risk Ratio (M‐H, Fixed, 95% CI) | 0.52 [0.15, 1.84] |
| 18.5 Sensitivity | 2 | 107 | Risk Ratio (M‐H, Fixed, 95% CI) | 0.63 [0.32, 1.26] |
| 19 Severe IVH (grade III or IV) Show forest plot | 1 | 47 | Risk Ratio (M‐H, Fixed, 95% CI) | 1.04 [0.07, 15.72] |
| Analysis 1.19  Comparison 1 Routine diuretic administration versus placebo, no treatment or PRN diuretic administration, Outcome 19 Severe IVH (grade III or IV). | ||||
| 19.1 All studies | 1 | 47 | Risk Ratio (M‐H, Fixed, 95% CI) | 1.04 [0.07, 15.72] |
| 20 Duration of hospitalization (days) Show forest plot | 2 | Mean Difference (IV, Fixed, 95% CI) | Subtotals only | |
| Analysis 1.20  Comparison 1 Routine diuretic administration versus placebo, no treatment or PRN diuretic administration, Outcome 20 Duration of hospitalization (days). | ||||
| 20.1 All | 2 | 103 | Mean Difference (IV, Fixed, 95% CI) | 2.43 [‐10.71, 15.57] |
| 20.2 Postnatal age < 24 hours | 2 | 103 | Mean Difference (IV, Fixed, 95% CI) | 2.43 [‐10.71, 15.57] |
| 20.3 Loop diuretics | 1 | 56 | Mean Difference (IV, Fixed, 95% CI) | 6.60 [‐16.38, 29.58] |
| 20.4 Theophylline | 1 | 47 | Mean Difference (IV, Fixed, 95% CI) | 0.40 [‐15.62, 16.42] |
| 21 Significant handicap at one year (major neurologic defect and/or MDI/PDI <50) Show forest plot | 1 | 26 | Risk Ratio (M‐H, Fixed, 95% CI) | 0.43 [0.09, 1.94] |
| Analysis 1.21  Comparison 1 Routine diuretic administration versus placebo, no treatment or PRN diuretic administration, Outcome 21 Significant handicap at one year (major neurologic defect and/or MDI/PDI <50). | ||||
| 21.1 Postnatal age < 24 hours | 1 | 26 | Risk Ratio (M‐H, Fixed, 95% CI) | 0.43 [0.09, 1.94] |
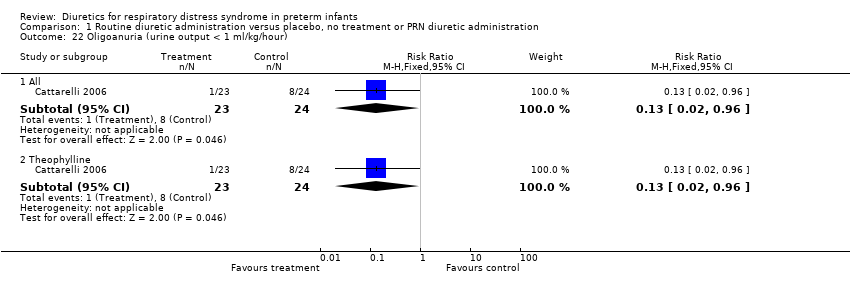
| 22 Oligoanuria (urine output < 1 ml/kg/hour) Show forest plot | 1 | Risk Ratio (M‐H, Fixed, 95% CI) | Subtotals only | |
| Analysis 1.22  Comparison 1 Routine diuretic administration versus placebo, no treatment or PRN diuretic administration, Outcome 22 Oligoanuria (urine output < 1 ml/kg/hour). | ||||
| 22.1 All | 1 | 47 | Risk Ratio (M‐H, Fixed, 95% CI) | 0.13 [0.02, 0.96] |
| 22.2 Theophylline | 1 | 47 | Risk Ratio (M‐H, Fixed, 95% CI) | 0.13 [0.02, 0.96] |
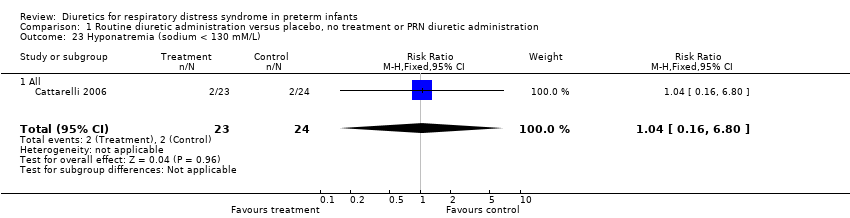
| 23 Hyponatremia (sodium < 130 mM/L) Show forest plot | 1 | 47 | Risk Ratio (M‐H, Fixed, 95% CI) | 1.04 [0.16, 6.80] |
| Analysis 1.23  Comparison 1 Routine diuretic administration versus placebo, no treatment or PRN diuretic administration, Outcome 23 Hyponatremia (sodium < 130 mM/L). | ||||
| 23.1 All | 1 | 47 | Risk Ratio (M‐H, Fixed, 95% CI) | 1.04 [0.16, 6.80] |
| 24 Hyperkalemia (potassium > 6.5 mM/L) Show forest plot | 1 | 47 | Risk Ratio (M‐H, Fixed, 95% CI) | 1.57 [0.29, 8.53] |
| Analysis 1.24  Comparison 1 Routine diuretic administration versus placebo, no treatment or PRN diuretic administration, Outcome 24 Hyperkalemia (potassium > 6.5 mM/L). | ||||
| 24.1 All | 1 | 47 | Risk Ratio (M‐H, Fixed, 95% CI) | 1.57 [0.29, 8.53] |
| Outcome or subgroup title | No. of studies | No. of participants | Statistical method | Effect size |
| 1 Death Show forest plot | 5 | Risk Ratio (M‐H, Fixed, 95% CI) | Subtotals only | |
| Analysis 2.1  Comparison 2 Routine diuretic administration versus placebo or no treatment, Outcome 1 Death. | ||||
| 1.1 All | 5 | 179 | Risk Ratio (M‐H, Fixed, 95% CI) | 1.47 [0.72, 2.97] |
| 1.2 Postnatal age < 24 hours | 4 | 167 | Risk Ratio (M‐H, Fixed, 95% CI) | 1.47 [0.72, 2.97] |
| 1.3 Postnatal age at least 24 hours | 1 | 12 | Risk Ratio (M‐H, Fixed, 95% CI) | 0.0 [0.0, 0.0] |
| 1.4 Loop diuretics | 4 | 129 | Risk Ratio (M‐H, Fixed, 95% CI) | 1.41 [0.67, 2.95] |
| 1.5 Theophylline | 1 | 50 | Risk Ratio (M‐H, Fixed, 95% CI) | 2.0 [0.19, 20.67] |
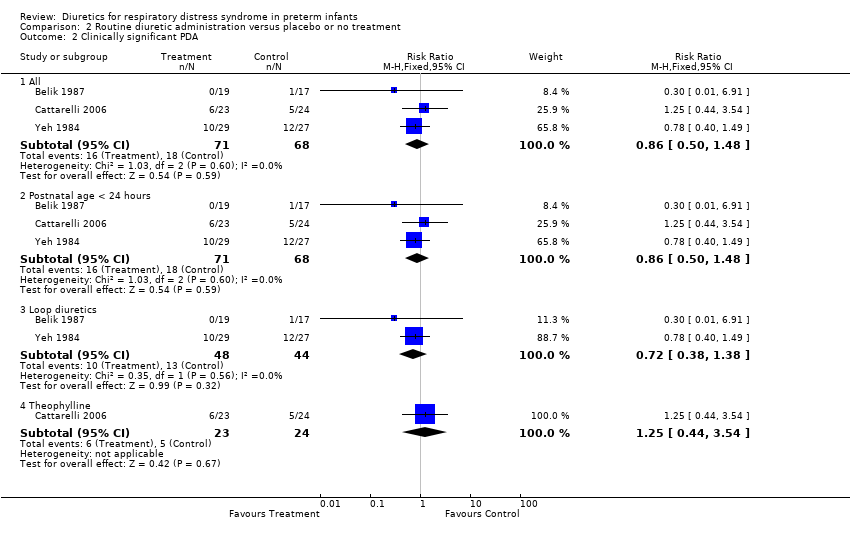
| 2 Clinically significant PDA Show forest plot | 3 | Risk Ratio (M‐H, Fixed, 95% CI) | Subtotals only | |
| Analysis 2.2  Comparison 2 Routine diuretic administration versus placebo or no treatment, Outcome 2 Clinically significant PDA. | ||||
| 2.1 All | 3 | 139 | Risk Ratio (M‐H, Fixed, 95% CI) | 0.86 [0.50, 1.48] |
| 2.2 Postnatal age < 24 hours | 3 | 139 | Risk Ratio (M‐H, Fixed, 95% CI) | 0.86 [0.50, 1.48] |
| 2.3 Loop diuretics | 2 | 92 | Risk Ratio (M‐H, Fixed, 95% CI) | 0.72 [0.38, 1.38] |
| 2.4 Theophylline | 1 | 47 | Risk Ratio (M‐H, Fixed, 95% CI) | 1.25 [0.44, 3.54] |
| 3 Hypovolemic shock Show forest plot | 1 | 12 | Risk Ratio (M‐H, Fixed, 95% CI) | 4.0 [0.20, 82.01] |
| Analysis 2.3  Comparison 2 Routine diuretic administration versus placebo or no treatment, Outcome 3 Hypovolemic shock. | ||||
| 3.1 Postnatal age at least 24 hours | 1 | 12 | Risk Ratio (M‐H, Fixed, 95% CI) | 4.0 [0.20, 82.01] |
| 4 Failure to extubate within 3 days after study entry Show forest plot | 1 | 56 | Risk Ratio (M‐H, Fixed, 95% CI) | 0.65 [0.45, 0.93] |
| Analysis 2.4  Comparison 2 Routine diuretic administration versus placebo or no treatment, Outcome 4 Failure to extubate within 3 days after study entry. | ||||
| 4.1 Postnatal age < 24 hours | 1 | 56 | Risk Ratio (M‐H, Fixed, 95% CI) | 0.65 [0.45, 0.93] |
| 5 Change in peak inspiratory pressure (cm H2O) during treatment Show forest plot | 1 | 36 | Mean Difference (IV, Fixed, 95% CI) | ‐6.62 [‐14.74, 1.50] |
| Analysis 2.5  Comparison 2 Routine diuretic administration versus placebo or no treatment, Outcome 5 Change in peak inspiratory pressure (cm H2O) during treatment. | ||||
| 5.1 Postnatal age < 24 hours | 1 | 36 | Mean Difference (IV, Fixed, 95% CI) | ‐6.62 [‐14.74, 1.50] |
| 6 Change in mean airway pressure (cm H2O) during treatment Show forest plot | 1 | 56 | Mean Difference (IV, Fixed, 95% CI) | ‐1.30 [‐2.81, 0.21] |
| Analysis 2.6  Comparison 2 Routine diuretic administration versus placebo or no treatment, Outcome 6 Change in mean airway pressure (cm H2O) during treatment. | ||||
| 6.1 Postnatal age < 24 hours | 1 | 56 | Mean Difference (IV, Fixed, 95% CI) | ‐1.30 [‐2.81, 0.21] |
| 7 Duration of mechanical ventilation (days) Show forest plot | 1 | 36 | Mean Difference (IV, Fixed, 95% CI) | ‐5.0 [‐7.06, ‐2.94] |
| Analysis 2.7  Comparison 2 Routine diuretic administration versus placebo or no treatment, Outcome 7 Duration of mechanical ventilation (days). | ||||
| 7.1 Postnatal age < 24 hours | 1 | 36 | Mean Difference (IV, Fixed, 95% CI) | ‐5.0 [‐7.06, ‐2.94] |
| 8 Change in FiO2 during treatment Show forest plot | 2 | 92 | Mean Difference (IV, Fixed, 95% CI) | ‐0.05 [‐0.13, 0.03] |
| Analysis 2.8  Comparison 2 Routine diuretic administration versus placebo or no treatment, Outcome 8 Change in FiO2 during treatment. | ||||
| 8.1 Postnatal age < 24 hours | 2 | 92 | Mean Difference (IV, Fixed, 95% CI) | ‐0.05 [‐0.13, 0.03] |
| 9 Change in alveolar‐arterial O2 gradient (mm Hg) during treatment Show forest plot | 2 | 92 | Mean Difference (IV, Fixed, 95% CI) | ‐66.81 [‐131.24, ‐2.37] |
| Analysis 2.9  Comparison 2 Routine diuretic administration versus placebo or no treatment, Outcome 9 Change in alveolar‐arterial O2 gradient (mm Hg) during treatment. | ||||
| 9.1 Postnatal age < 24 hours | 2 | 92 | Mean Difference (IV, Fixed, 95% CI) | ‐66.81 [‐131.24, ‐2.37] |
| 10 BPD Show forest plot | 3 | Risk Ratio (M‐H, Fixed, 95% CI) | Subtotals only | |
| Analysis 2.10  Comparison 2 Routine diuretic administration versus placebo or no treatment, Outcome 10 BPD. | ||||
| 10.1 All | 3 | 139 | Risk Ratio (M‐H, Fixed, 95% CI) | 0.81 [0.41, 1.59] |
| 10.2 Postnatal age < 24 hours | 3 | 139 | Risk Ratio (M‐H, Fixed, 95% CI) | 0.81 [0.41, 1.59] |
| 10.3 Loop diuretics | 2 | 92 | Risk Ratio (M‐H, Fixed, 95% CI) | 1.02 [0.49, 2.10] |
| 10.4 Theophylline | 1 | 47 | Risk Ratio (M‐H, Fixed, 95% CI) | 0.26 [0.03, 2.16] |
| 11 Death or BPD Show forest plot | 2 | Risk Ratio (M‐H, Fixed, 95% CI) | Subtotals only | |
| Analysis 2.11  Comparison 2 Routine diuretic administration versus placebo or no treatment, Outcome 11 Death or BPD. | ||||
| 11.1 All | 2 | 87 | Risk Ratio (M‐H, Fixed, 95% CI) | 0.95 [0.32, 2.76] |
| 11.2 Postnatal age <24 hours | 2 | 87 | Risk Ratio (M‐H, Fixed, 95% CI) | 0.95 [0.32, 2.76] |
| 11.3 Loop diuretics | 1 | 37 | Risk Ratio (M‐H, Fixed, 95% CI) | 2.55 [0.29, 22.31] |
| 11.4 Theophylline | 1 | 50 | Risk Ratio (M‐H, Fixed, 95% CI) | 0.6 [0.16, 2.25] |
| 12 Duration of oxygen supplementation (days) Show forest plot | 2 | 92 | Mean Difference (IV, Fixed, 95% CI) | ‐0.22 [‐2.40, 1.96] |
| Analysis 2.12  Comparison 2 Routine diuretic administration versus placebo or no treatment, Outcome 12 Duration of oxygen supplementation (days). | ||||
| 12.1 Postnatal age < 24 hours | 2 | 92 | Mean Difference (IV, Fixed, 95% CI) | ‐0.22 [‐2.40, 1.96] |
| 13 IVH Show forest plot | 3 | Risk Ratio (M‐H, Fixed, 95% CI) | Subtotals only | |
| Analysis 2.13  Comparison 2 Routine diuretic administration versus placebo or no treatment, Outcome 13 IVH. | ||||
| 13.1 All | 3 | 127 | Risk Ratio (M‐H, Fixed, 95% CI) | 0.76 [0.40, 1.44] |
| 13.2 Postnatal age < 24 hours | 3 | 127 | Risk Ratio (M‐H, Fixed, 95% CI) | 0.76 [0.40, 1.44] |
| 13.3 Loop diuretics | 2 | 80 | Risk Ratio (M‐H, Fixed, 95% CI) | 0.90 [0.43, 1.88] |
| 13.4 Theophylline | 1 | 47 | Risk Ratio (M‐H, Fixed, 95% CI) | 0.52 [0.15, 1.84] |
| 14 Severe IVH (grade III or IV) Show forest plot | 1 | 47 | Risk Ratio (M‐H, Fixed, 95% CI) | 1.04 [0.07, 15.72] |
| Analysis 2.14  Comparison 2 Routine diuretic administration versus placebo or no treatment, Outcome 14 Severe IVH (grade III or IV). | ||||
| 14.1 All | 1 | 47 | Risk Ratio (M‐H, Fixed, 95% CI) | 1.04 [0.07, 15.72] |
| 15 Duration of hospitalization (days) Show forest plot | 2 | Mean Difference (IV, Fixed, 95% CI) | Subtotals only | |
| Analysis 2.15  Comparison 2 Routine diuretic administration versus placebo or no treatment, Outcome 15 Duration of hospitalization (days). | ||||
| 15.1 All | 2 | 103 | Mean Difference (IV, Fixed, 95% CI) | 2.43 [‐10.71, 15.57] |
| 15.2 Postnatal age < 24 hours | 2 | 103 | Mean Difference (IV, Fixed, 95% CI) | 2.43 [‐10.71, 15.57] |
| 15.3 Loop diuretics | 1 | 56 | Mean Difference (IV, Fixed, 95% CI) | 6.60 [‐16.38, 29.58] |
| 15.4 Theophylline | 1 | 47 | Mean Difference (IV, Fixed, 95% CI) | 0.40 [‐15.62, 16.42] |
| 16 Significant handicap at one year (major neurologic defect and/or MDI/PDI <50) Show forest plot | 1 | 26 | Risk Ratio (M‐H, Fixed, 95% CI) | 0.43 [0.09, 1.94] |
| Analysis 2.16  Comparison 2 Routine diuretic administration versus placebo or no treatment, Outcome 16 Significant handicap at one year (major neurologic defect and/or MDI/PDI <50). | ||||
| 16.1 Postnatal age < 24 hours | 1 | 26 | Risk Ratio (M‐H, Fixed, 95% CI) | 0.43 [0.09, 1.94] |
| 17 Oligoanuria (urine output < 1 ml/kg/hour) Show forest plot | 1 | Risk Ratio (M‐H, Fixed, 95% CI) | Subtotals only | |
| Analysis 2.17  Comparison 2 Routine diuretic administration versus placebo or no treatment, Outcome 17 Oligoanuria (urine output < 1 ml/kg/hour). | ||||
| 17.1 All | 1 | 47 | Risk Ratio (M‐H, Fixed, 95% CI) | 0.13 [0.02, 0.96] |
| 17.2 Theophylline | 1 | 47 | Risk Ratio (M‐H, Fixed, 95% CI) | 0.13 [0.02, 0.96] |
| 18 Hyponatremia (sodium < 130 mM/L) Show forest plot | 1 | 47 | Risk Ratio (M‐H, Fixed, 95% CI) | 1.04 [0.16, 6.80] |
| Analysis 2.18  Comparison 2 Routine diuretic administration versus placebo or no treatment, Outcome 18 Hyponatremia (sodium < 130 mM/L). | ||||
| 18.1 All | 1 | 47 | Risk Ratio (M‐H, Fixed, 95% CI) | 1.04 [0.16, 6.80] |
| 19 Hyperkalemia (potassium > 6.5 mM/L) Show forest plot | 1 | 47 | Risk Ratio (M‐H, Fixed, 95% CI) | 1.57 [0.29, 8.53] |
| Analysis 2.19  Comparison 2 Routine diuretic administration versus placebo or no treatment, Outcome 19 Hyperkalemia (potassium > 6.5 mM/L). | ||||
| 19.1 All | 1 | 47 | Risk Ratio (M‐H, Fixed, 95% CI) | 1.57 [0.29, 8.53] |
| Outcome or subgroup title | No. of studies | No. of participants | Statistical method | Effect size |
| 1 Death Show forest plot | 1 | 66 | Risk Ratio (M‐H, Fixed, 95% CI) | 0.62 [0.29, 1.29] |
| Analysis 3.1  Comparison 3 PRN furosemide versus PRN chlorothiazide, Outcome 1 Death. | ||||
| 2 Clinical diagnosis of PDA during the study Show forest plot | 1 | 66 | Risk Ratio (M‐H, Fixed, 95% CI) | 2.25 [1.14, 4.44] |
| Analysis 3.2  Comparison 3 PRN furosemide versus PRN chlorothiazide, Outcome 2 Clinical diagnosis of PDA during the study. | ||||
| 3 Clinical diagnosis of PDA (during the study or later) Show forest plot | 1 | 66 | Risk Ratio (M‐H, Fixed, 95% CI) | 3.0 [1.58, 5.68] |
| Analysis 3.3  Comparison 3 PRN furosemide versus PRN chlorothiazide, Outcome 3 Clinical diagnosis of PDA (during the study or later). | ||||
| 4 BPD Show forest plot | 1 | 45 | Risk Ratio (M‐H, Fixed, 95% CI) | 0.8 [0.18, 3.54] |
| Analysis 3.4  Comparison 3 PRN furosemide versus PRN chlorothiazide, Outcome 4 BPD. | ||||
| 5 Death or BPD Show forest plot | 1 | 66 | Risk Ratio (M‐H, Fixed, 95% CI) | 0.69 [0.38, 1.25] |
| Analysis 3.5  Comparison 3 PRN furosemide versus PRN chlorothiazide, Outcome 5 Death or BPD. | ||||
| 6 IVH Show forest plot | 1 | 66 | Risk Ratio (M‐H, Fixed, 95% CI) | 1.18 [0.62, 2.25] |
| Analysis 3.6  Comparison 3 PRN furosemide versus PRN chlorothiazide, Outcome 6 IVH. | ||||
| 7 Duration of mechanical ventilation in survivors (days) Show forest plot | 1 | 45 | Mean Difference (IV, Fixed, 95% CI) | 3.20 [‐1.31, 7.71] |
| Analysis 3.7  Comparison 3 PRN furosemide versus PRN chlorothiazide, Outcome 7 Duration of mechanical ventilation in survivors (days). | ||||
| 8 Duration of hospitalization (days) Show forest plot | 1 | 45 | Mean Difference (IV, Fixed, 95% CI) | ‐8.0 [‐33.33, 17.33] |
| Analysis 3.8  Comparison 3 PRN furosemide versus PRN chlorothiazide, Outcome 8 Duration of hospitalization (days). | ||||
Comparison 1 Routine diuretic administration versus placebo, no treatment or PRN diuretic administration, Outcome 1 Death.
Comparison 1 Routine diuretic administration versus placebo, no treatment or PRN diuretic administration, Outcome 2 Clinically significant PDA.

Comparison 1 Routine diuretic administration versus placebo, no treatment or PRN diuretic administration, Outcome 3 Hypovolemic shock.

Comparison 1 Routine diuretic administration versus placebo, no treatment or PRN diuretic administration, Outcome 4 Change in plasma volume (ml/kg) from 48 to 96 hours of life.

Comparison 1 Routine diuretic administration versus placebo, no treatment or PRN diuretic administration, Outcome 5 Change in cardiovascular stability index from 48 to 96 hours of life.
Comparison 1 Routine diuretic administration versus placebo, no treatment or PRN diuretic administration, Outcome 6 Dobutamine infusion rate (micrograms/kg/min) at the end of treatment.

Comparison 1 Routine diuretic administration versus placebo, no treatment or PRN diuretic administration, Outcome 7 Dopamine infusion rate (micrograms/kg/min) at the end of treatment.

Comparison 1 Routine diuretic administration versus placebo, no treatment or PRN diuretic administration, Outcome 8 Change in colloid infusion rate (ml/kg/hour) at the end of treatment.

Comparison 1 Routine diuretic administration versus placebo, no treatment or PRN diuretic administration, Outcome 9 Failure to extubate within 3 days after study entry.

Comparison 1 Routine diuretic administration versus placebo, no treatment or PRN diuretic administration, Outcome 10 Change in peak inspiratory pressure (cm H2O) during treatment.
Comparison 1 Routine diuretic administration versus placebo, no treatment or PRN diuretic administration, Outcome 11 Change in mean airway pressure (cm H2O) during treatment.
Comparison 1 Routine diuretic administration versus placebo, no treatment or PRN diuretic administration, Outcome 12 Duration of mechanical ventilation (days).

Comparison 1 Routine diuretic administration versus placebo, no treatment or PRN diuretic administration, Outcome 13 Change in FiO2 during treatment.
Comparison 1 Routine diuretic administration versus placebo, no treatment or PRN diuretic administration, Outcome 14 Change in alveolar‐arterial O2 gradient (mm Hg) during treatment.
Comparison 1 Routine diuretic administration versus placebo, no treatment or PRN diuretic administration, Outcome 15 BPD.
Comparison 1 Routine diuretic administration versus placebo, no treatment or PRN diuretic administration, Outcome 16 Death or BPD.

Comparison 1 Routine diuretic administration versus placebo, no treatment or PRN diuretic administration, Outcome 17 Duration of oxygen supplementation (days).
Comparison 1 Routine diuretic administration versus placebo, no treatment or PRN diuretic administration, Outcome 18 IVH.

Comparison 1 Routine diuretic administration versus placebo, no treatment or PRN diuretic administration, Outcome 19 Severe IVH (grade III or IV).

Comparison 1 Routine diuretic administration versus placebo, no treatment or PRN diuretic administration, Outcome 20 Duration of hospitalization (days).

Comparison 1 Routine diuretic administration versus placebo, no treatment or PRN diuretic administration, Outcome 21 Significant handicap at one year (major neurologic defect and/or MDI/PDI <50).
Comparison 1 Routine diuretic administration versus placebo, no treatment or PRN diuretic administration, Outcome 22 Oligoanuria (urine output < 1 ml/kg/hour).
Comparison 1 Routine diuretic administration versus placebo, no treatment or PRN diuretic administration, Outcome 23 Hyponatremia (sodium < 130 mM/L).

Comparison 1 Routine diuretic administration versus placebo, no treatment or PRN diuretic administration, Outcome 24 Hyperkalemia (potassium > 6.5 mM/L).

Comparison 2 Routine diuretic administration versus placebo or no treatment, Outcome 1 Death.
Comparison 2 Routine diuretic administration versus placebo or no treatment, Outcome 2 Clinically significant PDA.

Comparison 2 Routine diuretic administration versus placebo or no treatment, Outcome 3 Hypovolemic shock.

Comparison 2 Routine diuretic administration versus placebo or no treatment, Outcome 4 Failure to extubate within 3 days after study entry.
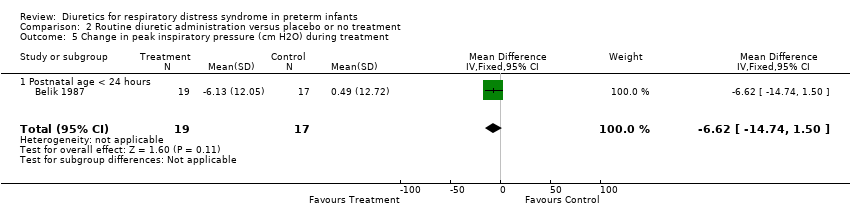
Comparison 2 Routine diuretic administration versus placebo or no treatment, Outcome 5 Change in peak inspiratory pressure (cm H2O) during treatment.

Comparison 2 Routine diuretic administration versus placebo or no treatment, Outcome 6 Change in mean airway pressure (cm H2O) during treatment.
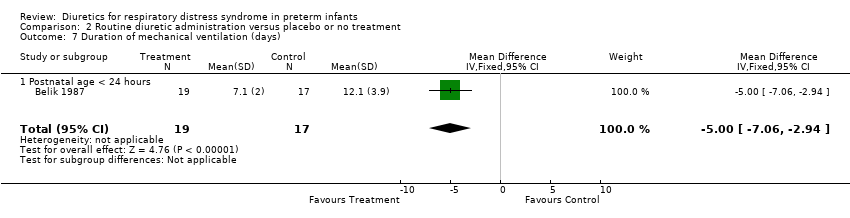
Comparison 2 Routine diuretic administration versus placebo or no treatment, Outcome 7 Duration of mechanical ventilation (days).

Comparison 2 Routine diuretic administration versus placebo or no treatment, Outcome 8 Change in FiO2 during treatment.

Comparison 2 Routine diuretic administration versus placebo or no treatment, Outcome 9 Change in alveolar‐arterial O2 gradient (mm Hg) during treatment.

Comparison 2 Routine diuretic administration versus placebo or no treatment, Outcome 10 BPD.

Comparison 2 Routine diuretic administration versus placebo or no treatment, Outcome 11 Death or BPD.

Comparison 2 Routine diuretic administration versus placebo or no treatment, Outcome 12 Duration of oxygen supplementation (days).

Comparison 2 Routine diuretic administration versus placebo or no treatment, Outcome 13 IVH.

Comparison 2 Routine diuretic administration versus placebo or no treatment, Outcome 14 Severe IVH (grade III or IV).

Comparison 2 Routine diuretic administration versus placebo or no treatment, Outcome 15 Duration of hospitalization (days).
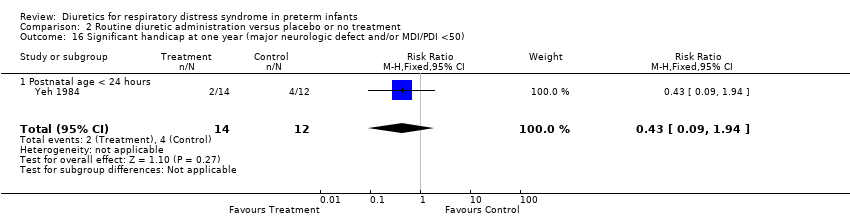
Comparison 2 Routine diuretic administration versus placebo or no treatment, Outcome 16 Significant handicap at one year (major neurologic defect and/or MDI/PDI <50).

Comparison 2 Routine diuretic administration versus placebo or no treatment, Outcome 17 Oligoanuria (urine output < 1 ml/kg/hour).
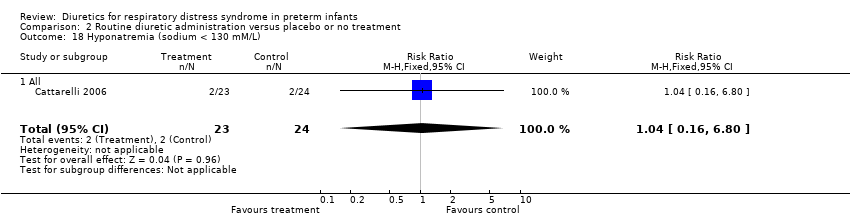
Comparison 2 Routine diuretic administration versus placebo or no treatment, Outcome 18 Hyponatremia (sodium < 130 mM/L).

Comparison 2 Routine diuretic administration versus placebo or no treatment, Outcome 19 Hyperkalemia (potassium > 6.5 mM/L).
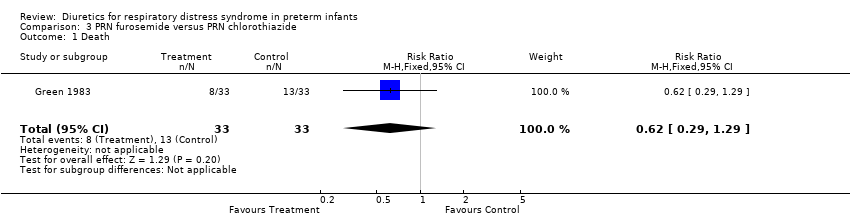
Comparison 3 PRN furosemide versus PRN chlorothiazide, Outcome 1 Death.

Comparison 3 PRN furosemide versus PRN chlorothiazide, Outcome 2 Clinical diagnosis of PDA during the study.

Comparison 3 PRN furosemide versus PRN chlorothiazide, Outcome 3 Clinical diagnosis of PDA (during the study or later).
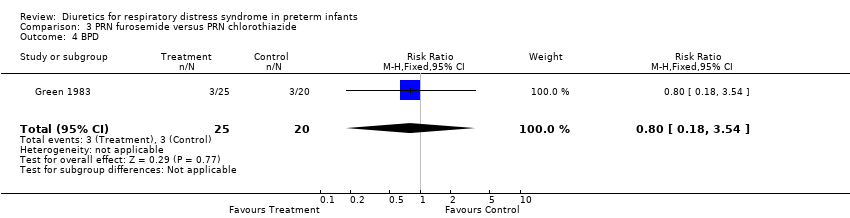
Comparison 3 PRN furosemide versus PRN chlorothiazide, Outcome 4 BPD.
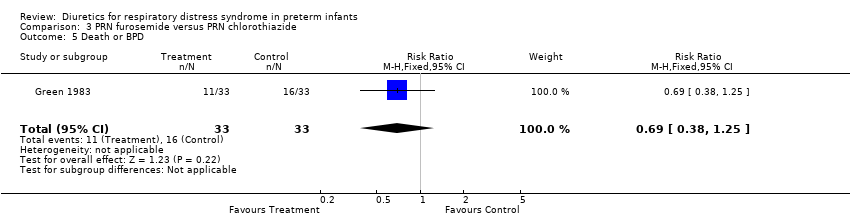
Comparison 3 PRN furosemide versus PRN chlorothiazide, Outcome 5 Death or BPD.

Comparison 3 PRN furosemide versus PRN chlorothiazide, Outcome 6 IVH.

Comparison 3 PRN furosemide versus PRN chlorothiazide, Outcome 7 Duration of mechanical ventilation in survivors (days).

Comparison 3 PRN furosemide versus PRN chlorothiazide, Outcome 8 Duration of hospitalization (days).
| Outcome or subgroup title | No. of studies | No. of participants | Statistical method | Effect size |
| 1 Death Show forest plot | 6 | Risk Ratio (M‐H, Fixed, 95% CI) | Subtotals only | |
| 1.1 All | 6 | 248 | Risk Ratio (M‐H, Fixed, 95% CI) | 1.35 [0.71, 2.56] |
| 1.2 Postnatal age < 24 hours | 4 | 167 | Risk Ratio (M‐H, Fixed, 95% CI) | 1.47 [0.72, 2.97] |
| 1.3 Postnatal age at least 24 hours | 2 | 81 | Risk Ratio (M‐H, Fixed, 95% CI) | 0.97 [0.21, 4.48] |
| 1.4 Loop diuretics | 5 | 198 | Risk Ratio (M‐H, Fixed, 95% CI) | 1.30 [0.67, 2.52] |
| 1.5 Theophylline | 1 | 50 | Risk Ratio (M‐H, Fixed, 95% CI) | 2.0 [0.19, 20.67] |
| 1.6 Sensitivity | 5 | 228 | Risk Ratio (M‐H, Fixed, 95% CI) | 1.07 [0.51, 2.24] |
| 2 Clinically significant PDA Show forest plot | 4 | Risk Ratio (M‐H, Fixed, 95% CI) | Subtotals only | |
| 2.1 All | 4 | 208 | Risk Ratio (M‐H, Fixed, 95% CI) | 1.11 [0.72, 1.71] |
| 2.2 Postnatal age < 24 hours | 3 | 139 | Risk Ratio (M‐H, Fixed, 95% CI) | 0.86 [0.50, 1.48] |
| 2.3 Postnatal age at least 24 hours | 1 | 69 | Risk Ratio (M‐H, Fixed, 95% CI) | 1.7 [0.82, 3.53] |
| 2.4 Loop diuretics | 3 | 161 | Risk Ratio (M‐H, Fixed, 95% CI) | 1.08 [0.67, 1.73] |
| 2.5 Theophylline | 1 | 47 | Risk Ratio (M‐H, Fixed, 95% CI) | 1.25 [0.44, 3.54] |
| 3 Hypovolemic shock Show forest plot | 1 | 12 | Risk Ratio (M‐H, Fixed, 95% CI) | 4.0 [0.20, 82.01] |
| 3.1 Postnatal age at least 24 hours | 1 | 12 | Risk Ratio (M‐H, Fixed, 95% CI) | 4.0 [0.20, 82.01] |
| 4 Change in plasma volume (ml/kg) from 48 to 96 hours of life Show forest plot | 1 | 69 | Mean Difference (IV, Fixed, 95% CI) | ‐7.7 [‐11.74, ‐3.66] |
| 4.1 Postnatal age at least 24 hours | 1 | 69 | Mean Difference (IV, Fixed, 95% CI) | ‐7.7 [‐11.74, ‐3.66] |
| 5 Change in cardiovascular stability index from 48 to 96 hours of life Show forest plot | 1 | 69 | Mean Difference (IV, Fixed, 95% CI) | 0.77 [‐0.14, 1.68] |
| 5.1 Postnatal age at least 24 hours | 1 | 69 | Mean Difference (IV, Fixed, 95% CI) | 0.77 [‐0.14, 1.68] |
| 6 Dobutamine infusion rate (micrograms/kg/min) at the end of treatment Show forest plot | 1 | 69 | Mean Difference (IV, Fixed, 95% CI) | 3.10 [‐0.62, 6.82] |
| 6.1 Postnatal age at least 24 hours | 1 | 69 | Mean Difference (IV, Fixed, 95% CI) | 3.10 [‐0.62, 6.82] |
| 7 Dopamine infusion rate (micrograms/kg/min) at the end of treatment Show forest plot | 1 | 69 | Mean Difference (IV, Fixed, 95% CI) | 2.41 [‐0.07, 4.89] |
| 7.1 Postnatal age at least 24 hours | 1 | 69 | Mean Difference (IV, Fixed, 95% CI) | 2.41 [‐0.07, 4.89] |
| 8 Change in colloid infusion rate (ml/kg/hour) at the end of treatment Show forest plot | 1 | 69 | Mean Difference (IV, Fixed, 95% CI) | ‐0.86 [‐4.30, 2.58] |
| 8.1 Postnatal age at least 24 hours | 1 | 69 | Mean Difference (IV, Fixed, 95% CI) | ‐0.86 [‐4.30, 2.58] |
| 9 Failure to extubate within 3 days after study entry Show forest plot | 1 | 56 | Risk Ratio (M‐H, Fixed, 95% CI) | 0.65 [0.45, 0.93] |
| 9.1 Postnatal age < 24 hours | 1 | 56 | Risk Ratio (M‐H, Fixed, 95% CI) | 0.65 [0.45, 0.93] |
| 10 Change in peak inspiratory pressure (cm H2O) during treatment Show forest plot | 1 | 36 | Mean Difference (IV, Fixed, 95% CI) | ‐6.62 [‐14.74, 1.50] |
| 10.1 Postnatal age < 24 hours | 1 | 36 | Mean Difference (IV, Fixed, 95% CI) | ‐6.62 [‐14.74, 1.50] |
| 11 Change in mean airway pressure (cm H2O) during treatment Show forest plot | 2 | 125 | Mean Difference (IV, Fixed, 95% CI) | ‐1.16 [‐2.42, 0.09] |
| 11.1 Postnatal age < 24 hours | 1 | 56 | Mean Difference (IV, Fixed, 95% CI) | ‐1.30 [‐2.81, 0.21] |
| 11.2 Postnatal age at least 24 hours | 1 | 69 | Mean Difference (IV, Fixed, 95% CI) | ‐0.85 [‐3.11, 1.41] |
| 12 Duration of mechanical ventilation (days) Show forest plot | 2 | 105 | Mean Difference (IV, Fixed, 95% CI) | ‐2.83 [‐4.49, ‐1.17] |
| 12.1 Postnatal age < 24 hours | 1 | 36 | Mean Difference (IV, Fixed, 95% CI) | ‐5.0 [‐7.06, ‐2.94] |
| 12.2 Postnatal age at least 24 hours | 1 | 69 | Mean Difference (IV, Fixed, 95% CI) | 1.20 [‐1.61, 4.01] |
| 13 Change in FiO2 during treatment Show forest plot | 2 | 92 | Mean Difference (IV, Fixed, 95% CI) | ‐0.05 [‐0.13, 0.03] |
| 13.1 Postnatal age < 24 hours | 2 | 92 | Mean Difference (IV, Fixed, 95% CI) | ‐0.05 [‐0.13, 0.03] |
| 14 Change in alveolar‐arterial O2 gradient (mm Hg) during treatment Show forest plot | 3 | 161 | Mean Difference (IV, Fixed, 95% CI) | ‐1.62 [‐43.75, 40.51] |
| 14.1 Postnatal age < 24 hours | 2 | 92 | Mean Difference (IV, Fixed, 95% CI) | ‐66.81 [‐131.24, ‐2.37] |
| 14.2 Postnatal age at least 24 hours | 1 | 69 | Mean Difference (IV, Fixed, 95% CI) | 47.06 [‐8.62, 102.74] |
| 15 BPD Show forest plot | 3 | Risk Ratio (M‐H, Fixed, 95% CI) | Subtotals only | |
| 15.1 All | 3 | 139 | Risk Ratio (M‐H, Fixed, 95% CI) | 0.81 [0.41, 1.59] |
| 15.2 Postnatal age < 24 hours | 3 | 139 | Risk Ratio (M‐H, Fixed, 95% CI) | 0.81 [0.41, 1.59] |
| 15.3 Loop diuretics | 2 | 92 | Risk Ratio (M‐H, Fixed, 95% CI) | 1.02 [0.49, 2.10] |
| 15.4 Theophylline | 1 | 50 | Risk Ratio (M‐H, Fixed, 95% CI) | 0.29 [0.04, 2.44] |
| 16 Death or BPD Show forest plot | 2 | Risk Ratio (M‐H, Fixed, 95% CI) | Subtotals only | |
| 16.1 All | 2 | 87 | Risk Ratio (M‐H, Fixed, 95% CI) | 0.95 [0.32, 2.76] |
| 16.2 Postnatal age <24 hours | 2 | 87 | Risk Ratio (M‐H, Fixed, 95% CI) | 0.95 [0.32, 2.76] |
| 16.3 Loop diuretics | 1 | 37 | Risk Ratio (M‐H, Fixed, 95% CI) | 2.55 [0.29, 22.31] |
| 16.4 Theophylline | 1 | 50 | Risk Ratio (M‐H, Fixed, 95% CI) | 0.6 [0.16, 2.25] |
| 17 Duration of oxygen supplementation (days) Show forest plot | 3 | 161 | Mean Difference (IV, Fixed, 95% CI) | ‐0.50 [‐2.51, 1.50] |
| 17.1 Postnatal age < 24 hours | 2 | 92 | Mean Difference (IV, Fixed, 95% CI) | ‐0.22 [‐2.40, 1.96] |
| 17.2 Postnatal age at least 24 hours | 1 | 69 | Mean Difference (IV, Fixed, 95% CI) | ‐2.10 [‐7.28, 3.08] |
| 18 IVH Show forest plot | 3 | Risk Ratio (M‐H, Fixed, 95% CI) | Subtotals only | |
| 18.1 All | 3 | 127 | Risk Ratio (M‐H, Fixed, 95% CI) | 0.76 [0.40, 1.44] |
| 18.2 Postnatal age < 24 hours | 3 | 127 | Risk Ratio (M‐H, Fixed, 95% CI) | 0.76 [0.40, 1.44] |
| 18.3 Loop diuretics | 2 | 80 | Risk Ratio (M‐H, Fixed, 95% CI) | 0.90 [0.43, 1.88] |
| 18.4 Theophylline | 1 | 47 | Risk Ratio (M‐H, Fixed, 95% CI) | 0.52 [0.15, 1.84] |
| 18.5 Sensitivity | 2 | 107 | Risk Ratio (M‐H, Fixed, 95% CI) | 0.63 [0.32, 1.26] |
| 19 Severe IVH (grade III or IV) Show forest plot | 1 | 47 | Risk Ratio (M‐H, Fixed, 95% CI) | 1.04 [0.07, 15.72] |
| 19.1 All studies | 1 | 47 | Risk Ratio (M‐H, Fixed, 95% CI) | 1.04 [0.07, 15.72] |
| 20 Duration of hospitalization (days) Show forest plot | 2 | Mean Difference (IV, Fixed, 95% CI) | Subtotals only | |
| 20.1 All | 2 | 103 | Mean Difference (IV, Fixed, 95% CI) | 2.43 [‐10.71, 15.57] |
| 20.2 Postnatal age < 24 hours | 2 | 103 | Mean Difference (IV, Fixed, 95% CI) | 2.43 [‐10.71, 15.57] |
| 20.3 Loop diuretics | 1 | 56 | Mean Difference (IV, Fixed, 95% CI) | 6.60 [‐16.38, 29.58] |
| 20.4 Theophylline | 1 | 47 | Mean Difference (IV, Fixed, 95% CI) | 0.40 [‐15.62, 16.42] |
| 21 Significant handicap at one year (major neurologic defect and/or MDI/PDI <50) Show forest plot | 1 | 26 | Risk Ratio (M‐H, Fixed, 95% CI) | 0.43 [0.09, 1.94] |
| 21.1 Postnatal age < 24 hours | 1 | 26 | Risk Ratio (M‐H, Fixed, 95% CI) | 0.43 [0.09, 1.94] |
| 22 Oligoanuria (urine output < 1 ml/kg/hour) Show forest plot | 1 | Risk Ratio (M‐H, Fixed, 95% CI) | Subtotals only | |
| 22.1 All | 1 | 47 | Risk Ratio (M‐H, Fixed, 95% CI) | 0.13 [0.02, 0.96] |
| 22.2 Theophylline | 1 | 47 | Risk Ratio (M‐H, Fixed, 95% CI) | 0.13 [0.02, 0.96] |
| 23 Hyponatremia (sodium < 130 mM/L) Show forest plot | 1 | 47 | Risk Ratio (M‐H, Fixed, 95% CI) | 1.04 [0.16, 6.80] |
| 23.1 All | 1 | 47 | Risk Ratio (M‐H, Fixed, 95% CI) | 1.04 [0.16, 6.80] |
| 24 Hyperkalemia (potassium > 6.5 mM/L) Show forest plot | 1 | 47 | Risk Ratio (M‐H, Fixed, 95% CI) | 1.57 [0.29, 8.53] |
| 24.1 All | 1 | 47 | Risk Ratio (M‐H, Fixed, 95% CI) | 1.57 [0.29, 8.53] |
| Outcome or subgroup title | No. of studies | No. of participants | Statistical method | Effect size |
| 1 Death Show forest plot | 5 | Risk Ratio (M‐H, Fixed, 95% CI) | Subtotals only | |
| 1.1 All | 5 | 179 | Risk Ratio (M‐H, Fixed, 95% CI) | 1.47 [0.72, 2.97] |
| 1.2 Postnatal age < 24 hours | 4 | 167 | Risk Ratio (M‐H, Fixed, 95% CI) | 1.47 [0.72, 2.97] |
| 1.3 Postnatal age at least 24 hours | 1 | 12 | Risk Ratio (M‐H, Fixed, 95% CI) | 0.0 [0.0, 0.0] |
| 1.4 Loop diuretics | 4 | 129 | Risk Ratio (M‐H, Fixed, 95% CI) | 1.41 [0.67, 2.95] |
| 1.5 Theophylline | 1 | 50 | Risk Ratio (M‐H, Fixed, 95% CI) | 2.0 [0.19, 20.67] |
| 2 Clinically significant PDA Show forest plot | 3 | Risk Ratio (M‐H, Fixed, 95% CI) | Subtotals only | |
| 2.1 All | 3 | 139 | Risk Ratio (M‐H, Fixed, 95% CI) | 0.86 [0.50, 1.48] |
| 2.2 Postnatal age < 24 hours | 3 | 139 | Risk Ratio (M‐H, Fixed, 95% CI) | 0.86 [0.50, 1.48] |
| 2.3 Loop diuretics | 2 | 92 | Risk Ratio (M‐H, Fixed, 95% CI) | 0.72 [0.38, 1.38] |
| 2.4 Theophylline | 1 | 47 | Risk Ratio (M‐H, Fixed, 95% CI) | 1.25 [0.44, 3.54] |
| 3 Hypovolemic shock Show forest plot | 1 | 12 | Risk Ratio (M‐H, Fixed, 95% CI) | 4.0 [0.20, 82.01] |
| 3.1 Postnatal age at least 24 hours | 1 | 12 | Risk Ratio (M‐H, Fixed, 95% CI) | 4.0 [0.20, 82.01] |
| 4 Failure to extubate within 3 days after study entry Show forest plot | 1 | 56 | Risk Ratio (M‐H, Fixed, 95% CI) | 0.65 [0.45, 0.93] |
| 4.1 Postnatal age < 24 hours | 1 | 56 | Risk Ratio (M‐H, Fixed, 95% CI) | 0.65 [0.45, 0.93] |
| 5 Change in peak inspiratory pressure (cm H2O) during treatment Show forest plot | 1 | 36 | Mean Difference (IV, Fixed, 95% CI) | ‐6.62 [‐14.74, 1.50] |
| 5.1 Postnatal age < 24 hours | 1 | 36 | Mean Difference (IV, Fixed, 95% CI) | ‐6.62 [‐14.74, 1.50] |
| 6 Change in mean airway pressure (cm H2O) during treatment Show forest plot | 1 | 56 | Mean Difference (IV, Fixed, 95% CI) | ‐1.30 [‐2.81, 0.21] |
| 6.1 Postnatal age < 24 hours | 1 | 56 | Mean Difference (IV, Fixed, 95% CI) | ‐1.30 [‐2.81, 0.21] |
| 7 Duration of mechanical ventilation (days) Show forest plot | 1 | 36 | Mean Difference (IV, Fixed, 95% CI) | ‐5.0 [‐7.06, ‐2.94] |
| 7.1 Postnatal age < 24 hours | 1 | 36 | Mean Difference (IV, Fixed, 95% CI) | ‐5.0 [‐7.06, ‐2.94] |
| 8 Change in FiO2 during treatment Show forest plot | 2 | 92 | Mean Difference (IV, Fixed, 95% CI) | ‐0.05 [‐0.13, 0.03] |
| 8.1 Postnatal age < 24 hours | 2 | 92 | Mean Difference (IV, Fixed, 95% CI) | ‐0.05 [‐0.13, 0.03] |
| 9 Change in alveolar‐arterial O2 gradient (mm Hg) during treatment Show forest plot | 2 | 92 | Mean Difference (IV, Fixed, 95% CI) | ‐66.81 [‐131.24, ‐2.37] |
| 9.1 Postnatal age < 24 hours | 2 | 92 | Mean Difference (IV, Fixed, 95% CI) | ‐66.81 [‐131.24, ‐2.37] |
| 10 BPD Show forest plot | 3 | Risk Ratio (M‐H, Fixed, 95% CI) | Subtotals only | |
| 10.1 All | 3 | 139 | Risk Ratio (M‐H, Fixed, 95% CI) | 0.81 [0.41, 1.59] |
| 10.2 Postnatal age < 24 hours | 3 | 139 | Risk Ratio (M‐H, Fixed, 95% CI) | 0.81 [0.41, 1.59] |
| 10.3 Loop diuretics | 2 | 92 | Risk Ratio (M‐H, Fixed, 95% CI) | 1.02 [0.49, 2.10] |
| 10.4 Theophylline | 1 | 47 | Risk Ratio (M‐H, Fixed, 95% CI) | 0.26 [0.03, 2.16] |
| 11 Death or BPD Show forest plot | 2 | Risk Ratio (M‐H, Fixed, 95% CI) | Subtotals only | |
| 11.1 All | 2 | 87 | Risk Ratio (M‐H, Fixed, 95% CI) | 0.95 [0.32, 2.76] |
| 11.2 Postnatal age <24 hours | 2 | 87 | Risk Ratio (M‐H, Fixed, 95% CI) | 0.95 [0.32, 2.76] |
| 11.3 Loop diuretics | 1 | 37 | Risk Ratio (M‐H, Fixed, 95% CI) | 2.55 [0.29, 22.31] |
| 11.4 Theophylline | 1 | 50 | Risk Ratio (M‐H, Fixed, 95% CI) | 0.6 [0.16, 2.25] |
| 12 Duration of oxygen supplementation (days) Show forest plot | 2 | 92 | Mean Difference (IV, Fixed, 95% CI) | ‐0.22 [‐2.40, 1.96] |
| 12.1 Postnatal age < 24 hours | 2 | 92 | Mean Difference (IV, Fixed, 95% CI) | ‐0.22 [‐2.40, 1.96] |
| 13 IVH Show forest plot | 3 | Risk Ratio (M‐H, Fixed, 95% CI) | Subtotals only | |
| 13.1 All | 3 | 127 | Risk Ratio (M‐H, Fixed, 95% CI) | 0.76 [0.40, 1.44] |
| 13.2 Postnatal age < 24 hours | 3 | 127 | Risk Ratio (M‐H, Fixed, 95% CI) | 0.76 [0.40, 1.44] |
| 13.3 Loop diuretics | 2 | 80 | Risk Ratio (M‐H, Fixed, 95% CI) | 0.90 [0.43, 1.88] |
| 13.4 Theophylline | 1 | 47 | Risk Ratio (M‐H, Fixed, 95% CI) | 0.52 [0.15, 1.84] |
| 14 Severe IVH (grade III or IV) Show forest plot | 1 | 47 | Risk Ratio (M‐H, Fixed, 95% CI) | 1.04 [0.07, 15.72] |
| 14.1 All | 1 | 47 | Risk Ratio (M‐H, Fixed, 95% CI) | 1.04 [0.07, 15.72] |
| 15 Duration of hospitalization (days) Show forest plot | 2 | Mean Difference (IV, Fixed, 95% CI) | Subtotals only | |
| 15.1 All | 2 | 103 | Mean Difference (IV, Fixed, 95% CI) | 2.43 [‐10.71, 15.57] |
| 15.2 Postnatal age < 24 hours | 2 | 103 | Mean Difference (IV, Fixed, 95% CI) | 2.43 [‐10.71, 15.57] |
| 15.3 Loop diuretics | 1 | 56 | Mean Difference (IV, Fixed, 95% CI) | 6.60 [‐16.38, 29.58] |
| 15.4 Theophylline | 1 | 47 | Mean Difference (IV, Fixed, 95% CI) | 0.40 [‐15.62, 16.42] |
| 16 Significant handicap at one year (major neurologic defect and/or MDI/PDI <50) Show forest plot | 1 | 26 | Risk Ratio (M‐H, Fixed, 95% CI) | 0.43 [0.09, 1.94] |
| 16.1 Postnatal age < 24 hours | 1 | 26 | Risk Ratio (M‐H, Fixed, 95% CI) | 0.43 [0.09, 1.94] |
| 17 Oligoanuria (urine output < 1 ml/kg/hour) Show forest plot | 1 | Risk Ratio (M‐H, Fixed, 95% CI) | Subtotals only | |
| 17.1 All | 1 | 47 | Risk Ratio (M‐H, Fixed, 95% CI) | 0.13 [0.02, 0.96] |
| 17.2 Theophylline | 1 | 47 | Risk Ratio (M‐H, Fixed, 95% CI) | 0.13 [0.02, 0.96] |
| 18 Hyponatremia (sodium < 130 mM/L) Show forest plot | 1 | 47 | Risk Ratio (M‐H, Fixed, 95% CI) | 1.04 [0.16, 6.80] |
| 18.1 All | 1 | 47 | Risk Ratio (M‐H, Fixed, 95% CI) | 1.04 [0.16, 6.80] |
| 19 Hyperkalemia (potassium > 6.5 mM/L) Show forest plot | 1 | 47 | Risk Ratio (M‐H, Fixed, 95% CI) | 1.57 [0.29, 8.53] |
| 19.1 All | 1 | 47 | Risk Ratio (M‐H, Fixed, 95% CI) | 1.57 [0.29, 8.53] |
| Outcome or subgroup title | No. of studies | No. of participants | Statistical method | Effect size |
| 1 Death Show forest plot | 1 | 66 | Risk Ratio (M‐H, Fixed, 95% CI) | 0.62 [0.29, 1.29] |
| 2 Clinical diagnosis of PDA during the study Show forest plot | 1 | 66 | Risk Ratio (M‐H, Fixed, 95% CI) | 2.25 [1.14, 4.44] |
| 3 Clinical diagnosis of PDA (during the study or later) Show forest plot | 1 | 66 | Risk Ratio (M‐H, Fixed, 95% CI) | 3.0 [1.58, 5.68] |
| 4 BPD Show forest plot | 1 | 45 | Risk Ratio (M‐H, Fixed, 95% CI) | 0.8 [0.18, 3.54] |
| 5 Death or BPD Show forest plot | 1 | 66 | Risk Ratio (M‐H, Fixed, 95% CI) | 0.69 [0.38, 1.25] |
| 6 IVH Show forest plot | 1 | 66 | Risk Ratio (M‐H, Fixed, 95% CI) | 1.18 [0.62, 2.25] |
| 7 Duration of mechanical ventilation in survivors (days) Show forest plot | 1 | 45 | Mean Difference (IV, Fixed, 95% CI) | 3.20 [‐1.31, 7.71] |
| 8 Duration of hospitalization (days) Show forest plot | 1 | 45 | Mean Difference (IV, Fixed, 95% CI) | ‐8.0 [‐33.33, 17.33] |