Ayudas para pacientes que deben decidir sobre tratamientos o sobre la participación en pruebas de detección
Información
- DOI:
- https://doi.org/10.1002/14651858.CD001431.pub4Copiar DOI

- Base de datos:
-
- Cochrane Database of Systematic Reviews
- Versión publicada:
-
- 28 enero 2014see what's new
- Tipo:
-
- Intervention
- Etapa:
-
- Review
- Grupo Editorial Cochrane:
-
Grupo Cochrane de Consumidores y comunicación
- Copyright:
-
- Copyright © 2014 The Cochrane Collaboration. Published by John Wiley & Sons, Ltd.
Cifras del artículo
Altmetric:
Citado por:
Autores
Contributions of authors
1999 Review (O'Connor 1999b):
AO, AR, VF, JT, VE, HLT, MHR, VF, MB, JJ contributed to the design of the protocol, the interpretation of results, and the revision and final approval of the final paper.
AO led the team, JT coordinated the project.
AO, MH‐R, AR, VF, and JT pilot tested the data extraction forms.
AR, VF, JT screened studies and extracted data.
AR, JT, and AO analyzed the results.
2001 Review (O'Connor 2001b):
AO, DS, DR, MHR, HLT, VE, MB, JT, VF, AR contributed to the interpretation of results, and the revision and final approval of the final paper.
AO lead the team and DS coordinated the update.
AO, DR, MHR, HLT, JT, DS, JP screened studies and extracted data.
DS, JP evaluated decision aids using the CREDIBLE criteria.
AO and DS analyzed the results.
2002 Review (O'Connor 2003b):
AO, DS, DR, MHR, HLT, VE, MB, JT, VF contributed to the interpretation of results, and the revision and final approval of the paper.
AO lead the team and DS coordinated the update.
DS, JP, VT, JT screened studies and extracted data.
DS, JP, VT, SK evaluated decision aids using the CREDIBLE criteria.
AO and DS analyzed the results.
2006 Review (O'Connor 2009):
AO, CB, DS, MB, NC, KE, VE, VF, MHR, SK, HLT, DR, contributed to the interpretation of results, and the revision and final approval of the paper.
AO led the team and CB coordinated the update.
CB, SK, DS, AO, VF screened studies and extracted data.
AO and CB analyzed the results.
2009 Review (Stacey 2011):
DS, CB, MB, NC, KE, FL, AL, MHR, HLT, RT contributed to the interpretation of results, and the revision and final approval of the paper.
DS led the team and CB coordinated the update.
CB, DS screened studies; SM, AD extracted data; CB entered the data; DS verified the data entered.
DS and CB analyzed the results.
2013 (current) Review
DS, CB, MB, NC, KE, FL, AL, MHR, HLT, RT, and LT contributed to the interpretation of results, and the revision and final approval of the paper.
DS led the team with help coordinating the update from SB and JW.
CB, DS, RT, MB, MHR, NC, KE, BV, DR, AS screened studies; SB, RW, JW, and CC extracted data; SB and JW entered the data; DS verified the data entered.
DS and JW analyzed the results.
Sources of support
Internal sources
-
University of Ottawa, Canada.
University Research Chair in Knowledge Translation to Patients
-
Ottawa Hospital Research Institute, Canada.
Director, Patient Decision Aids Research Group
External sources
-
No sources of support supplied
Declarations of interest
Several of the investigators have developed patient decision aids (DS, FL, HL, MHR, MB, NC, KE, RT, LT), but none reviewed their own studies.
Within the last five years, two investigators (HL, MB) have received financial support from the not‐for‐profit Informed Medical Decisions Foundation (IMDF). MB serves on the Board of and receives salary support as President of the Foundation. Several investigators (DS, FL, HL, MHR, MB, KE, RT, LT), who were involved in a special issue in BMC Medical Informatics and Decision Making that included a series of 14 papers focused on the theoretical and empirical evidence underlying the International Patient Decision Aid Standards (IPDAS), received partial funding from the Foundation to cover publishing costs. The Foundation has a licensing agreement with Health Dialog (a commercial firm) that distributes and promotes patient decision aids.
NC is the founder of Shared Decision Making Resources, an organization devoted to the development and dissemination of interactive patient decision aids; served as an adviser to Emmi Solutions LLC, Janssen Scientific Affairs, LLC, Expert Medical Navigation Inc, University of Chicago, Miami University and BlueCross/Blue Shield; and has received travel and/or speakers fees/honoraria from various organizations that have sponsored conferences addressing Shared Decision Making (including the World Congress Leadership Summit on Shared Decision Making).
Acknowledgements
The Cochrane Consumers and Communication Review Group (editors, academic and consumer referees) provided peer review and advice regarding the protocol and review and checked extracted data for newly‐included studies. We thank Jessie McGowan, a librarian who assisted with designing the original search strategy and John Kis‐Rigo at La Trobe University who revised the search strategy used in this current update. Robert Volk and David Rovner helped with screening studies for inclusion. Joan Peterson, Sarah Mullan, Amanda Dresch, Robert Wu, and Christine Courtemanche assisted with the screening, data extraction, and 'Risk of bias' assessment. Anton Saarimaki set up and managed a web‐based title and abstract screening application that facilitated independent screening of citations by the review authors and verified references for patient decision aids in Table 1. Alain Mayhew provided guidance in the interpretation of 'Risk of bias' findings and the 'Summary of findings' table. George Wells and Dean Fergusson provided consultation on the statistical analysis.
Version history
| Published | Title | Stage | Authors | Version |
| 2024 Jan 29 | Decision aids for people facing health treatment or screening decisions | Review | Dawn Stacey, Krystina B Lewis, Maureen Smith, Meg Carley, Robert Volk, Elisa E Douglas, Lissa Pacheco-Brousseau, Jeanette Finderup, Janet Gunderson, Michael J Barry, Carol L Bennett, Paulina Bravo, Karina Steffensen, Amédé Gogovor, Ian D Graham, Shannon E Kelly, France Légaré, Henning Sondergaard, Richard Thomson, Logan Trenaman, Lyndal Trevena | |
| 2017 Apr 12 | Decision aids for people facing health treatment or screening decisions | Review | Dawn Stacey, France Légaré, Krystina Lewis, Michael J Barry, Carol L Bennett, Karen B Eden, Margaret Holmes‐Rovner, Hilary Llewellyn‐Thomas, Anne Lyddiatt, Richard Thomson, Lyndal Trevena | |
| 2014 Jan 28 | Decision aids for people facing health treatment or screening decisions | Review | Dawn Stacey, France Légaré, Nananda F Col, Carol L Bennett, Michael J Barry, Karen B Eden, Margaret Holmes‐Rovner, Hilary Llewellyn‐Thomas, Anne Lyddiatt, Richard Thomson, Lyndal Trevena, Julie HC Wu | |
| 2011 Oct 05 | Decision aids for people facing health treatment or screening decisions | Review | Dawn Stacey, Carol L Bennett, Michael J Barry, Nananda F Col, Karen B Eden, Margaret Holmes‐Rovner, Hilary Llewellyn‐Thomas, Anne Lyddiatt, France Légaré, Richard Thomson | |
| 2009 Jul 08 | Decision aids for people facing health treatment or screening decisions | Review | Annette M. O'Connor, Carol L Bennett, Dawn Stacey, Michael Barry, Nananda F Col, Karen B Eden, Vikki A Entwistle, Valerie Fiset, Margaret Holmes‐Rovner, Sara Khangura, Hilary Llewellyn‐Thomas, David Rovner | |
| 2003 Jan 20 | Decision aids for people facing health treatment or screening decisions | Review | Annette M. O'Connor, Carol L Bennett, Dawn Stacey, Michael Barry, Nananda F Col, Karen B Eden, Vikki A Entwistle, Valerie Fiset, Margaret Holmes‐Rovner, Sara Khangura, Hilary Llewellyn‐Thomas, David Rovner | |
Differences between protocol and review
There are three main differences between the original protocol and the review. The 2009 update (O'Connor 2009) was re‐structured to organize the long list of outcomes into primary and secondary outcomes based on the new effectiveness criteria of the International Patient Decision Aid (IPDAS) Collaboration (Elwyn 2006). For the 2011 update (Stacey 2011), study quality assessment was changed to the 'Risk of bias' assessment (Higgins 2011). For the 2013 (current) update, GRADE was used to summarize the quality of the evidence and findings were reported using a 'Summary of findings' table.
Keywords
MeSH
Medical Subject Headings (MeSH) Keywords
Medical Subject Headings Check Words
Humans;
PICO

Study flow diagram.

Risk of bias summary as percentages across all included studies.

Risk of bias summary for each included study.

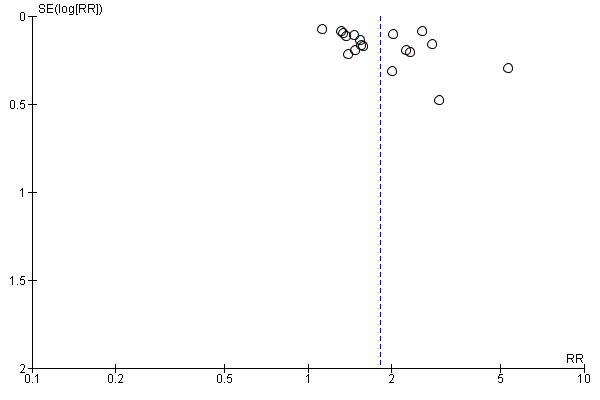
Funnel plot of comparison: 1 Knowledge, outcome: 1.1 Knowledge: DA vs usual care ‐ all studies.
Funnel plot of comparison: 2 Accurate risk perceptions: Decision aid with outcome probabilities vs no outcome probability information, outcome: 2.1 Accurate risk perceptions ‐ all studies.

Funnel plot of comparison: 3 Values congruent with chosen option, outcome: 3.1 Values congruent with chosen option ‐ all studies.

Funnel plot of comparison: 4.1 Decisional conflict: DA vs usual care ‐ all studies, outcome: 4.1.2 Uninformed sub‐scale

Funnel plot of comparison: 4.1 Decisional conflict: DA vs usual care ‐ all studies, outcome: 4.1.3 Unclear sub‐scale
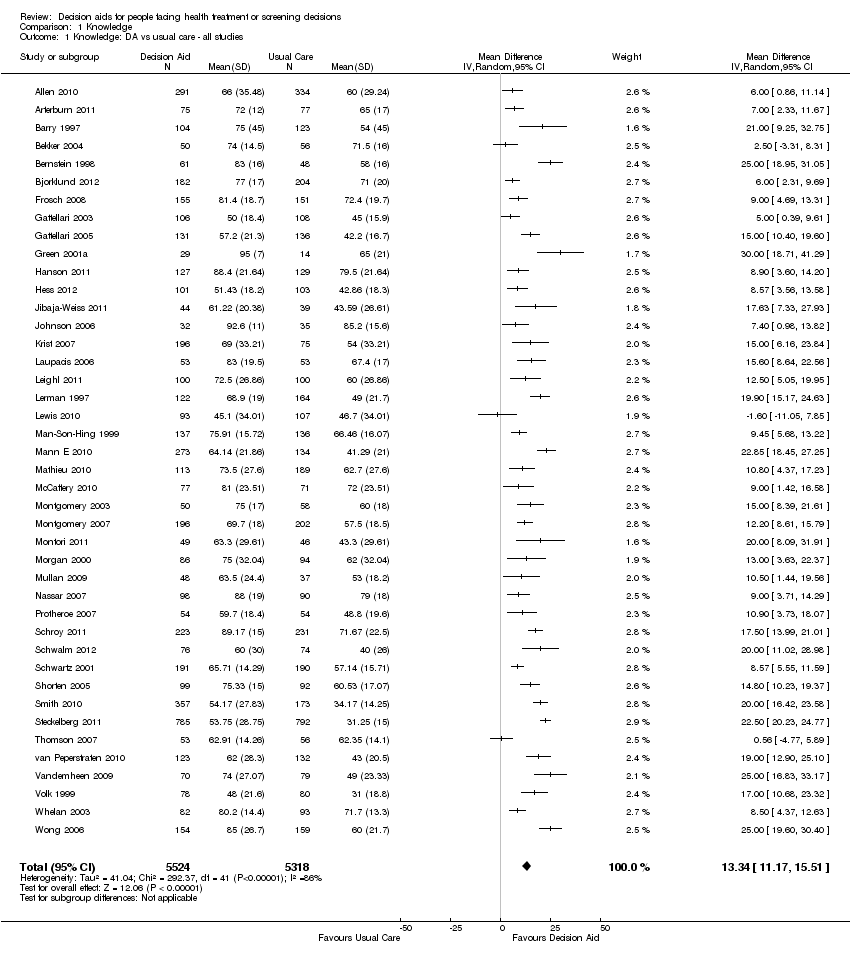
Comparison 1 Knowledge, Outcome 1 Knowledge: DA vs usual care ‐ all studies.

Comparison 1 Knowledge, Outcome 2 Knowledge: DA vs usual care ‐ treatment only.
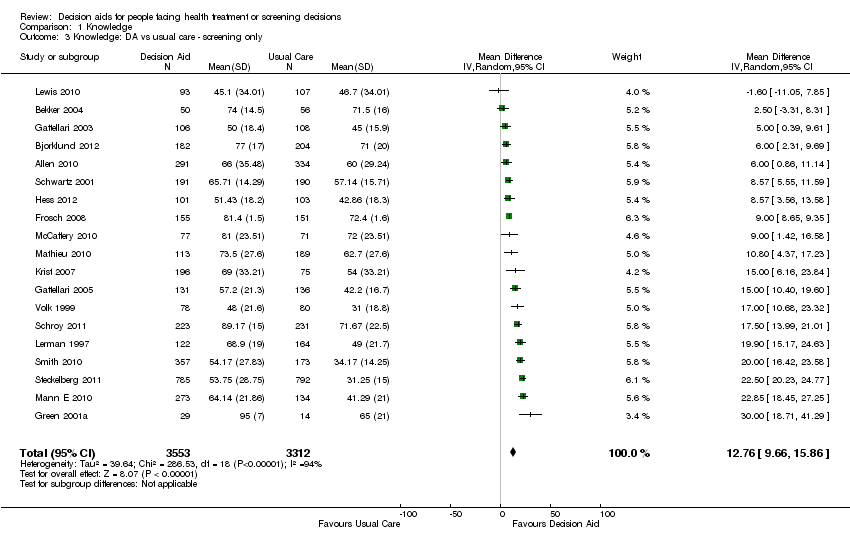
Comparison 1 Knowledge, Outcome 3 Knowledge: DA vs usual care ‐ screening only.

Comparison 1 Knowledge, Outcome 4 Knowledge: Detailed vs simple decision aids ‐ all studies.

Comparison 1 Knowledge, Outcome 5 Knowledge: Detailed vs simple decision aids ‐ treatment only.

Comparison 1 Knowledge, Outcome 6 Knowledge: Detailed vs simple decision aids ‐ screening only.

Comparison 2 Accurate risk perceptions: decision aid with outcome probabilities vs no outcome probability information, Outcome 1 Accurate risk perceptions ‐ all studies.

Comparison 2 Accurate risk perceptions: decision aid with outcome probabilities vs no outcome probability information, Outcome 2 Accurate risk perceptions ‐ treatments only.

Comparison 2 Accurate risk perceptions: decision aid with outcome probabilities vs no outcome probability information, Outcome 3 Accurate risk perceptions ‐ screening only.
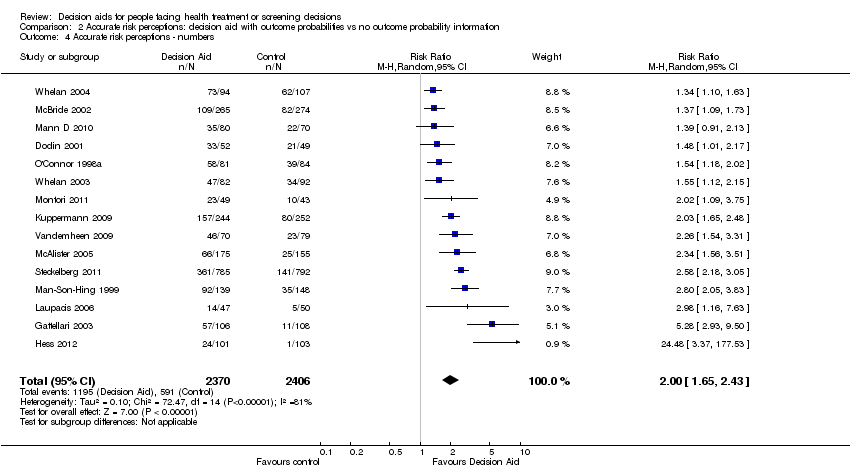
Comparison 2 Accurate risk perceptions: decision aid with outcome probabilities vs no outcome probability information, Outcome 4 Accurate risk perceptions ‐ numbers.

Comparison 2 Accurate risk perceptions: decision aid with outcome probabilities vs no outcome probability information, Outcome 5 Accurate risk perceptions ‐ words.
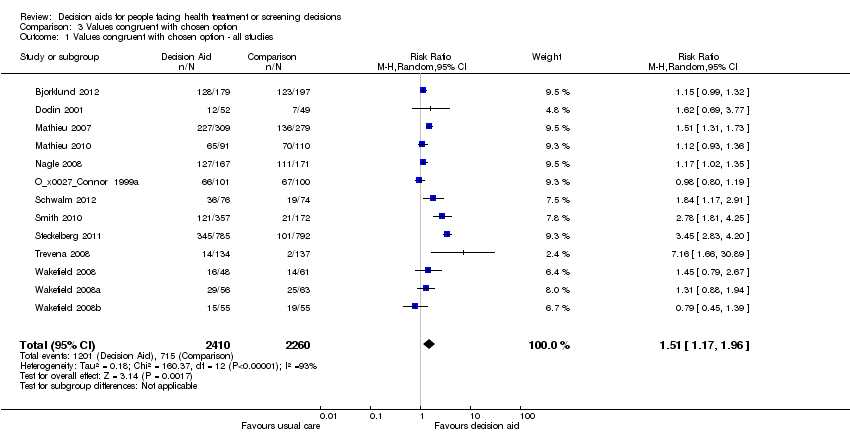
Comparison 3 Values congruent with chosen option, Outcome 1 Values congruent with chosen option ‐ all studies.

Comparison 3 Values congruent with chosen option, Outcome 2 Values congruent with chosen option ‐ treatment only.

Comparison 3 Values congruent with chosen option, Outcome 3 Values congruent with chosen option ‐ screening only.

Comparison 4 Decisional conflict, Outcome 1 Decisional conflict: DA vs usual care ‐ all studies.

Comparison 4 Decisional conflict, Outcome 2 Decisional conflict: DA vs usual care ‐ treatment only.

Comparison 4 Decisional conflict, Outcome 3 Decisional conflict: DA vs usual care ‐ screening only.
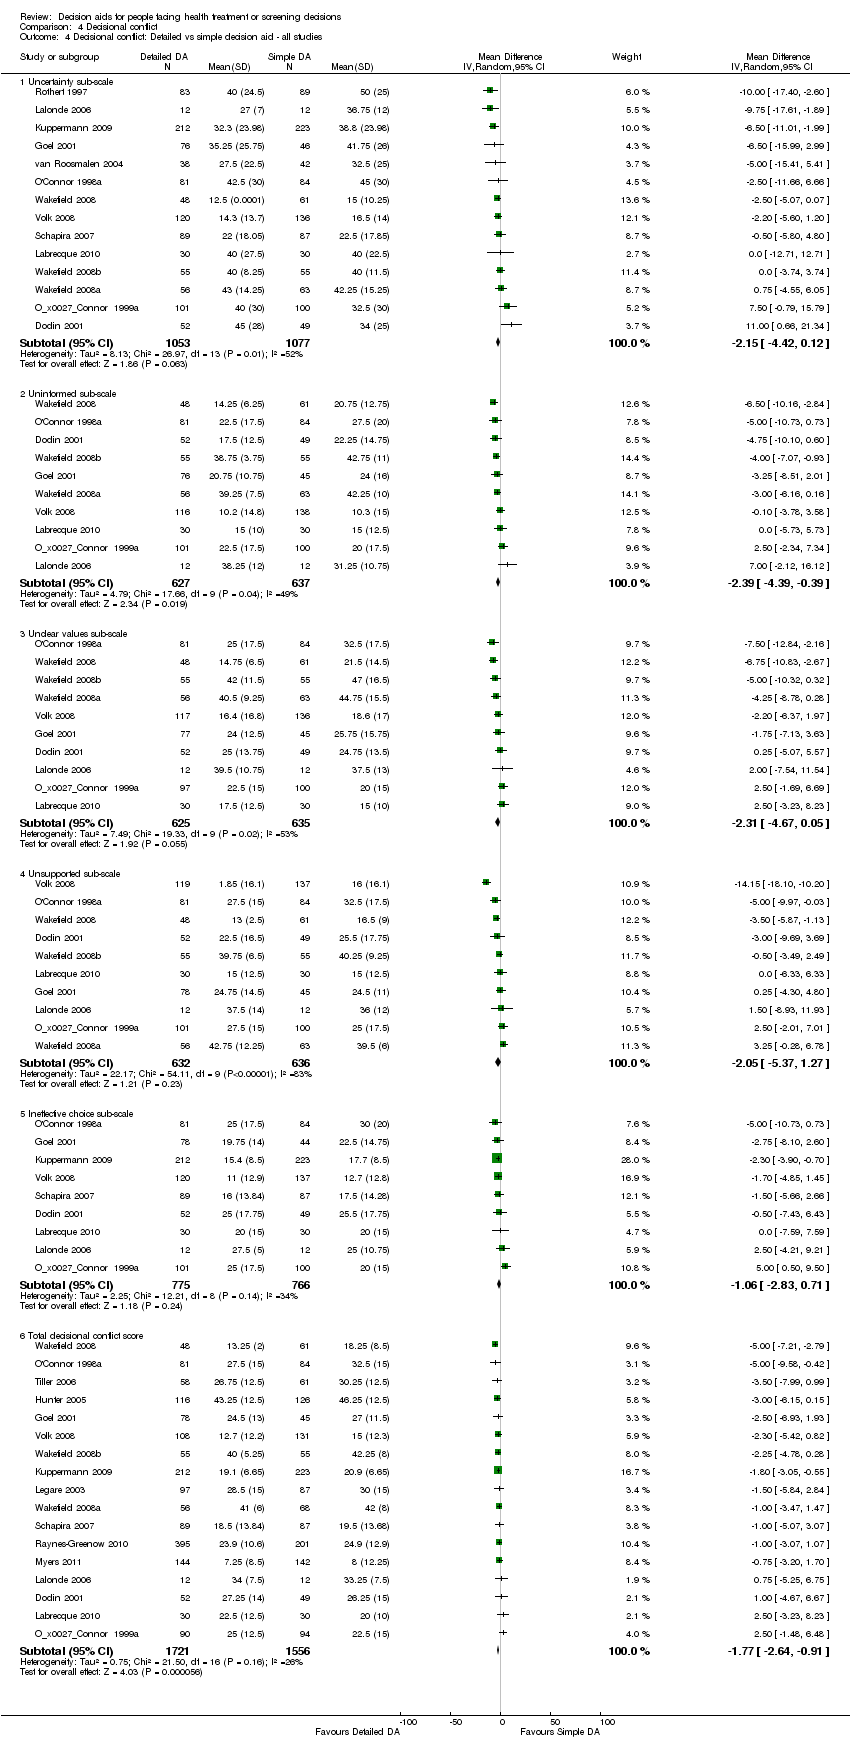
Comparison 4 Decisional conflict, Outcome 4 Decisional conflict: Detailed vs simple decision aid ‐ all studies.

Comparison 4 Decisional conflict, Outcome 5 Decisional conflict: Detailed vs simple decision aid ‐ treatment only.
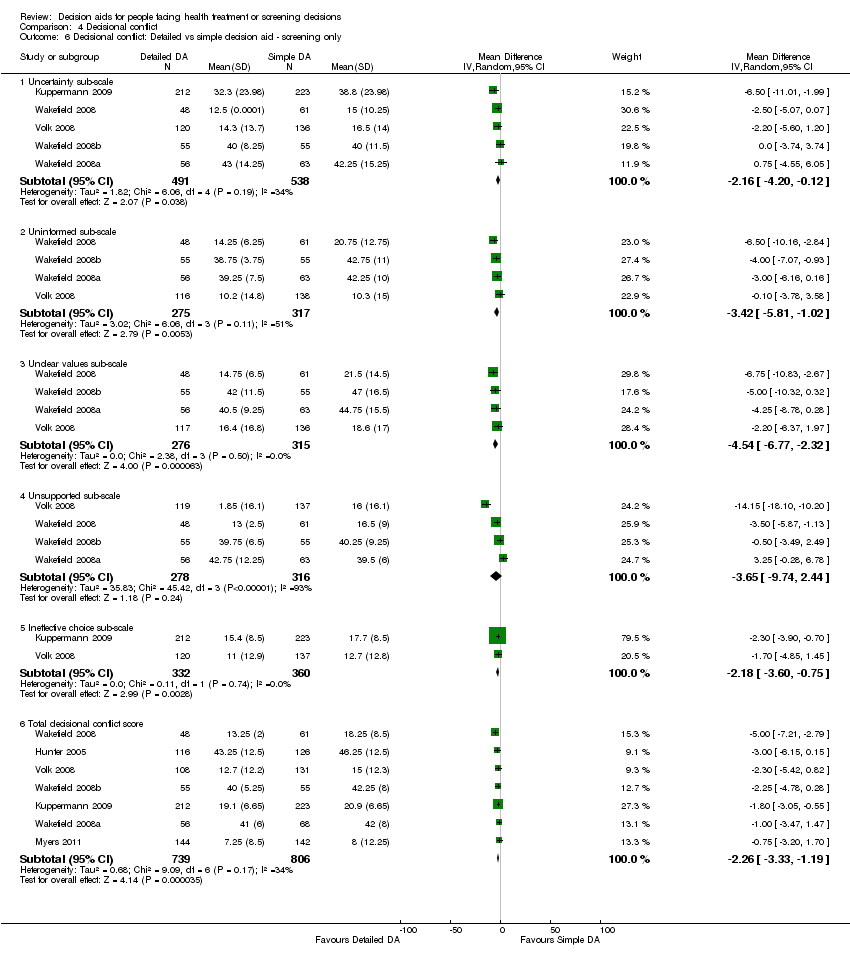
Comparison 4 Decisional conflict, Outcome 6 Decisional conflict: Detailed vs simple decision aid ‐ screening only.
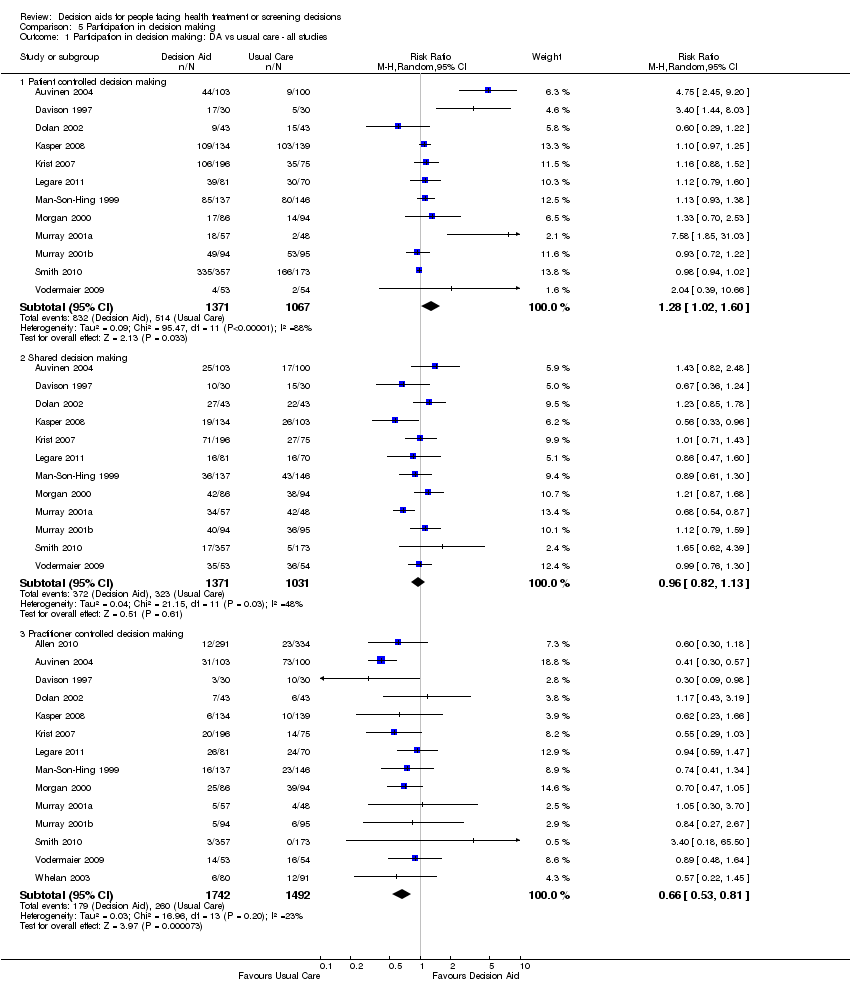
Comparison 5 Participation in decision making, Outcome 1 Participation in decision making: DA vs usual care ‐ all studies.

Comparison 5 Participation in decision making, Outcome 2 Participation in decision making: DA vs usual care ‐ treatment only.

Comparison 5 Participation in decision making, Outcome 3 Participation in decision making: DA vs usual care ‐ screening only.

Comparison 5 Participation in decision making, Outcome 4 Participation in decision making: Detailed vs simple decision aid ‐ all studies.

Comparison 5 Participation in decision making, Outcome 5 Participation in decision making: Detailed vs simple decision aid ‐ treatment only.
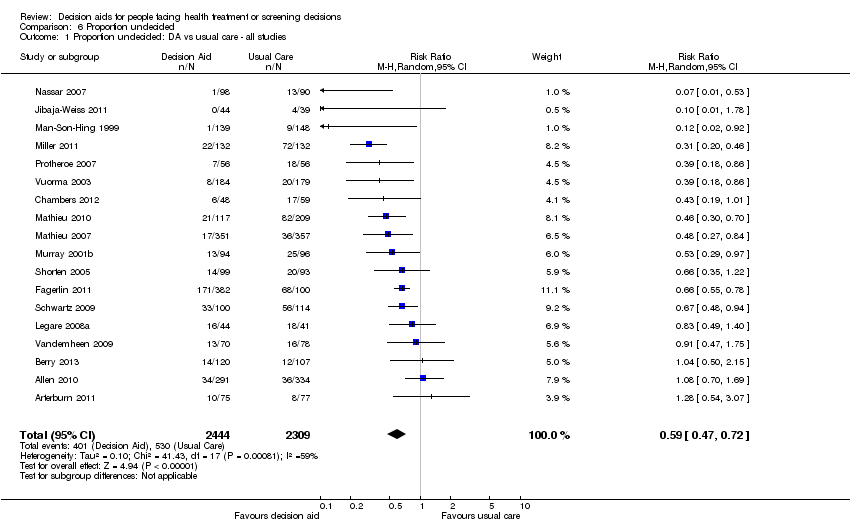
Comparison 6 Proportion undecided, Outcome 1 Proportion undecided: DA vs usual care ‐ all studies.
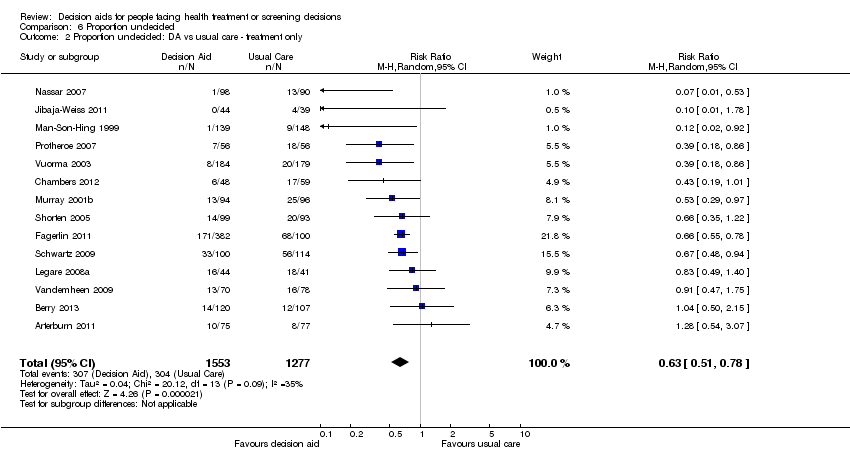
Comparison 6 Proportion undecided, Outcome 2 Proportion undecided: DA vs usual care ‐ treatment only.

Comparison 6 Proportion undecided, Outcome 3 Proportion undecided: DA vs usual care ‐ screening only.
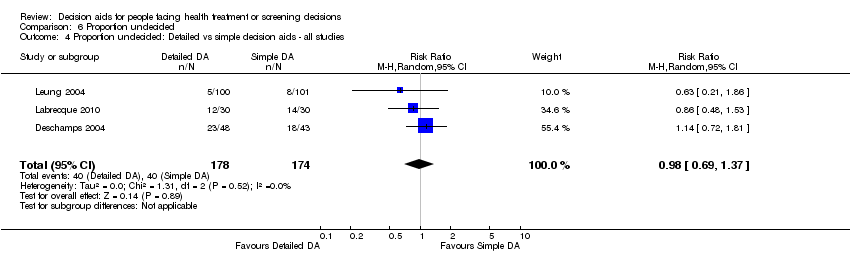
Comparison 6 Proportion undecided, Outcome 4 Proportion undecided: Detailed vs simple decision aids ‐ all studies.
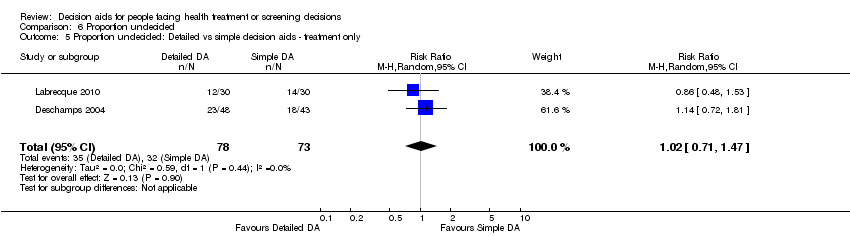
Comparison 6 Proportion undecided, Outcome 5 Proportion undecided: Detailed vs simple decision aids ‐ treatment only.
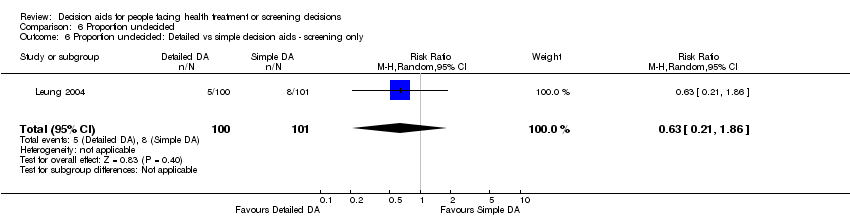
Comparison 6 Proportion undecided, Outcome 6 Proportion undecided: Detailed vs simple decision aids ‐ screening only.

Comparison 7 Satisfaction, Outcome 1 Satisfaction with the choice: DA vs usual care ‐ all studies.

Comparison 7 Satisfaction, Outcome 2 Satisfaction with the choice: DA vs usual care ‐ treatment only.

Comparison 7 Satisfaction, Outcome 3 Satisfaction with the choice: DA vs usual care ‐ screening only.

Comparison 7 Satisfaction, Outcome 4 Satisfaction with the choice: Detailed vs simple DA ‐ all studies.
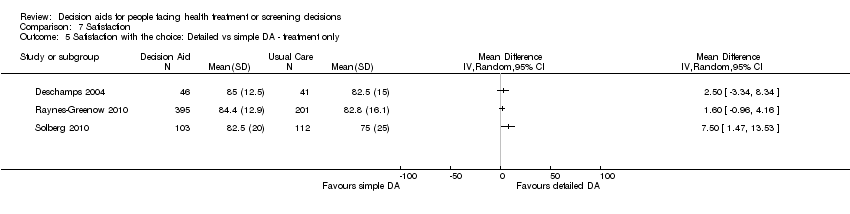
Comparison 7 Satisfaction, Outcome 5 Satisfaction with the choice: Detailed vs simple DA ‐ treatment only.
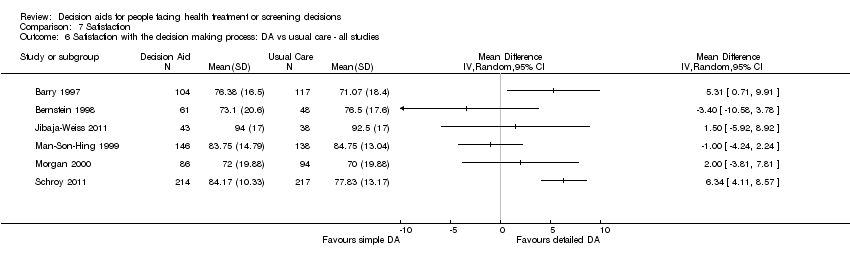
Comparison 7 Satisfaction, Outcome 6 Satisfaction with the decision making process: DA vs usual care ‐ all studies.

Comparison 7 Satisfaction, Outcome 7 Satisfaction with the decision making process: DA vs usual care ‐ treatment only.
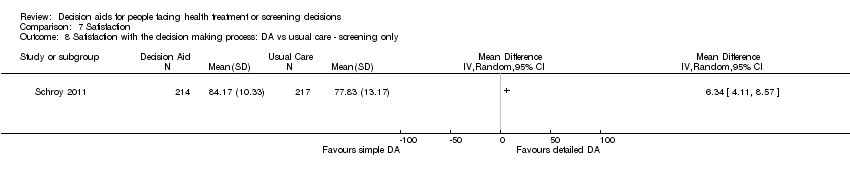
Comparison 7 Satisfaction, Outcome 8 Satisfaction with the decision making process: DA vs usual care ‐ screening only.
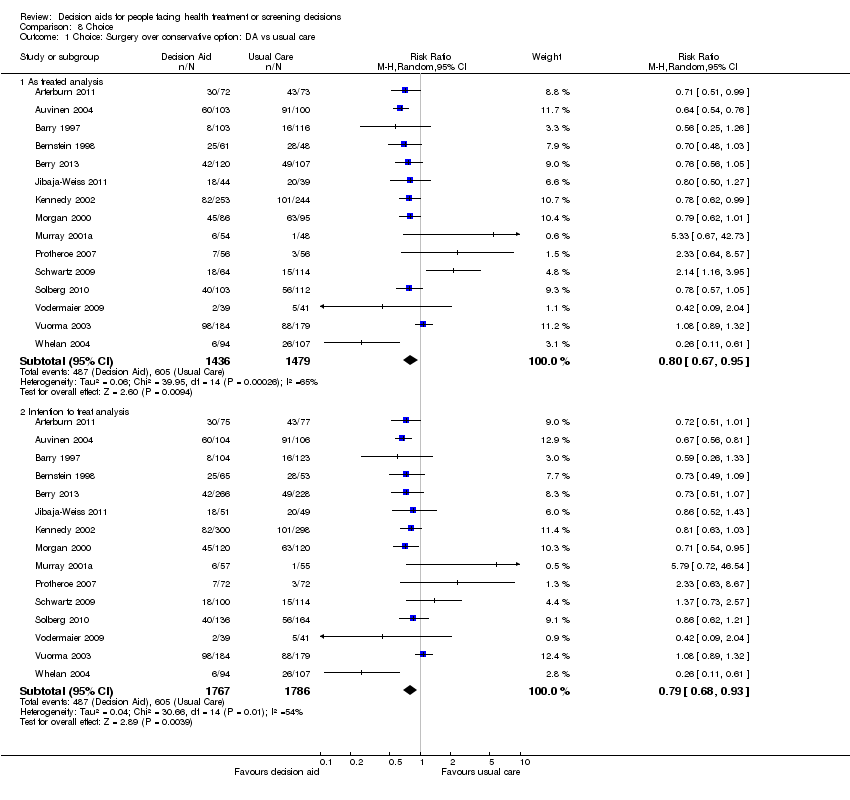
Comparison 8 Choice, Outcome 1 Choice: Surgery over conservative option: DA vs usual care.

Comparison 8 Choice, Outcome 2 Choice: Surgery over conservative option: Detailed vs simple decision aid.
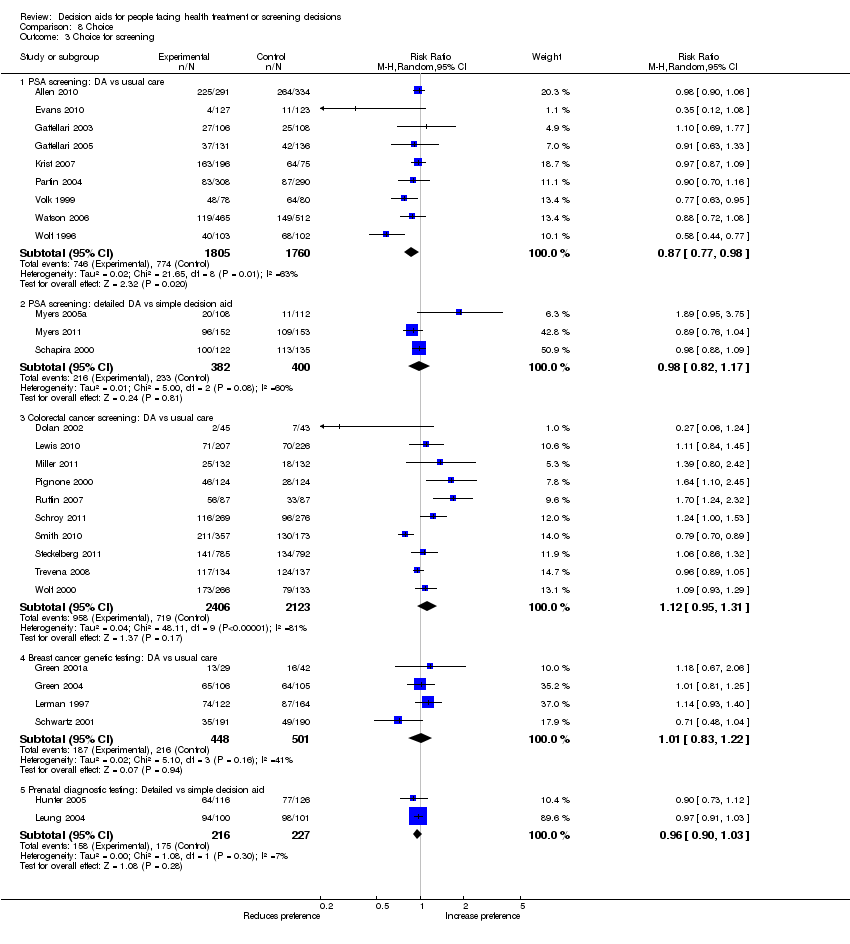
Comparison 8 Choice, Outcome 3 Choice for screening.
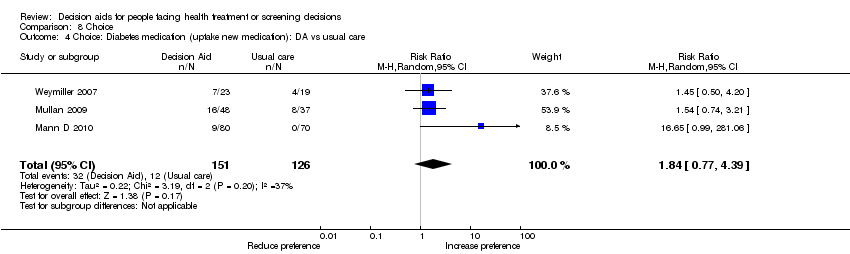
Comparison 8 Choice, Outcome 4 Choice: Diabetes medication (uptake new medication): DA vs usual care.

Comparison 8 Choice, Outcome 5 Choice: Menopausal hormone therapy: Detailed vs simple decision aid.
| Patient decision aids compared with usual care for adults considering treatment or screening decisions | ||||||
| Patient or population: adults considering treatment or screening decisions Settings: all settings Intervention: patient decision aid Comparison: usual care | ||||||
| Outcomes | Illustrative comparative benefits* (95% CI) | Relative effect | No of Participants | Quality of the evidence | Comments | |
| Assumed benefit | Corresponding benefit | |||||
| Usual care | Patient decision aid | |||||
| Knowledge: decision aid versus usual care ‐ all studies standardized on score from 0 (no knowledge) to 100 (perfect knowledge) [soon after exposure to the decision aid] | The mean knowledge score was 56.9% ranged across control groups from 31% to 85.2% | The mean knowledge score in the intervention groups was 13.34 higher (11.17 to 15.51 higher) | 10,842 | ⊕⊕⊕⊕ | Higher scores indicate better knowledge. 41 out of 42 studies showed an improvement in knowledge. | |
| Accurate risk perceptions ‐ all studies [soon after exposure to the decision aid] | 296 patients per 1000 | 542 patients per 1000 | RR 1.82 (95% CI: 1.52 to 2.16) | 5868 | ⊕⊕⊕⊝ | |
| Congruence between the chosen option and their values ‐ all studies [soon after exposure to the decision aid] | 316 patients per 1000 | 498 patients per 1000 | RR 1.51 (95% CI: 1.17 to 1.97) | 4670 (13 studies) | ⊕⊕⊝⊝ | |
| Decisional conflict: decision aid versus usual care ‐ all studies ‐ Uninformed sub‐scale standardized on score from 0 (not uninformed) to 100 (uninformed) [soon after exposure to the decision aid] | The mean feeling uninformed ranged across control groups from 12.75 to 49.1. Scores of 25 or lower are associated with follow‐through with decisions; whereas scores that exceed 38 are associated with delay in decision making | The mean feeling uninformed in the intervention groups was 7.26 lower (9.73 to 4.78 lower) | 4343 (22 studies) | ⊕⊕⊕⊕ | Lower scores indicate feeling more informed. | |
| Decisional conflict: decision aid versus usual care ‐ all studies ‐ Unclear values sub‐scale standardized on score from 0 (not unclear) to 100 (unclear) [soon after exposure to the decision aid] | The mean feeling unclear values ranged across control groups from 15.5 to 51.29. Scores of 25 or lower are associated with follow‐through with decisions; whereas scores that exceed 38 are associated with delay in decision making | The mean feeling unclear values in the intervention groups was 6.09 lower (8.50 to 3.67 lower) | 3704 (18 studies) | ⊕⊕⊕⊕ | Lower scores indicate feeling more clear about values | |
| Participation in decision making: decision aid versus usual care ‐ all studies ‐ Practitioner controlled decision making [soon after consultation with practitioner] | 174 patients per 1000 | 103 patients per 1000 | RR 0.66 (95%CI: 0.53 to 0.81) | 3234 | ⊕⊕⊕⊝ | Patient decision aids aim to increase patient involvement in making decisions. Lower proportion of practitioner controlled decision making is better. |
| *The basis for the assumed risk (e.g. the median control group risk across studies) is provided in footnotes. The corresponding risk (and its 95% confidence interval) is based on the assumed risk in the comparison group and the relative effect of the intervention (and its 95% CI). | ||||||
| GRADE Working Group grades of evidence | ||||||
| 1. The vast majority of studies measuring this outcome were not at high risk of bias. 2.The GRADE rating was downgraded given the lack of precision. 3.The GRADE rating was downgraded given the lack of consistency. 4.The GRADE rating was downgraded given the lack of directness. | ||||||
| Study | Topic | Availability | Source | Contact Information |
| Prostate cancer screening | No | Allen,Center for Community‐Based Research, Dana‐Farber Cancer Institute, Boston, MA, US, 2010 | requested access | |
| Bariatric surgery | Yes | Informed Medical Decisions Foundation, MA,US, 2010 | informedmedicaldecisions.org/imdf_decision_aid/making‐decisions‐about‐weight‐loss‐surgery/ | |
| Prostate cancer treatment | Yes | Auvinen, Helsinki, Finland, 1993 | included in publication | |
| Benign prostate disease treatment | Yes | Informed Medical Decisions Foundation, MA,US, 2001 | informedmedicaldecisions.org/imdf_decision_aid/treatment‐options‐for‐benign‐prostatic‐hyperplasia/ | |
| Prenatal screening | Yes | Bekker, Leeds, UK, 2003 | included in publication | |
| Ischaemic heart disease treatment | Yes | Informed Medical Decisions Foundation, MA,US, 2002 | informedmedicaldecisions.org/imdf_decision_aid/treatment‐choices‐for‐carotid‐artery‐disease/ | |
| Prostate cancer treatment | No | Berry, Phyllis F. Cantor Center, MA, USA, 2011 | ||
| Antenatal Down syndrome screening | Yes | Södersjukhuset, Department of Obstetrics and Gynecology, Stockholm, Sweden | vimeo.com/34600615/ | |
| Healthcare personnel’s influenza immunization | Yes | A McCarthy. Ottawa Influenza Decision Aid Planning Group, CA, 2008 | decisionaid.ohri.ca/decaids.html#oida | |
| Hepatitis B Vaccine | No | Clancy, Richmond VA, US, 1983 | ||
| Prostate cancer treatment | No | Davison, Manitoba CA, 1992‐1996 | ||
| Total | Yes | Informed Medical Decisions Foundation, MA,US | informedmedicaldecisions.org/imdf_decision_aid/treatment‐choices‐for‐knee‐osteoarthritis/ | |
| Hormone replacement therapy | No | O'Connor, Ottawa, CA, 1996 | decisionaid.ohri.ca/decaids‐archive.html | |
| Back surgery | Yes | Informed Medical Decisions Foundation, MA,US, 2001 | informedmedicaldecisions.org/imdf_decision_aid/managing‐chronic‐low‐back‐pain/ | |
| Hormone replacement therapy | No | O'Connor, Ottawa, CA, 1996 | decisionaid.ohri.ca/decaids‐archive.html | |
| Colon cancer screening | No | Dolan, Rochester NY, US, 1999 | ||
| Prostate cancer screening | Yes | Elwyn, Cardiff, UK | www.prosdex.com | |
| Breast cancer prevention | Yes | Fagerlin, Ann Arbor, MI, US | ||
| Osteoarthritis knee treatment | No | Fraenkel, New Haven CT, US | author said DA never fully developed, all info in paper | |
| Prostate cancer screening | No | Frosch, Los Angeles, US | Screenshots from author | |
| Prostate cancer screening | Yes | Gatellari , Sydney, AU, 2003 | included in publication | |
| Prostate cancer screening | Yes | Gatellari , Sydney, AU, 2003 | included in publication | |
| Breast cancer surgery | No | Goel/Sawka, Toronto CAN, 2001 | ||
| Breast cancer genetic testing | Yes | Green, Hershey PA, US, 2000 | 1‐800‐757‐4868 [email protected] | |
| Breast cancer genetic testing | Yes | Green, Hershey PA, US, 2000 | 1‐800‐757‐4868 [email protected] | |
| Schizophrenia treatment | Yes | Hamann, Munich, GER | emailed by author (in German) | |
| Feeding options in advanced | Yes | Mitchell, Tetroe, O'Connor; 2001 (updated 2008) | decisionaid.ohri.ca/decaids.html#feedingtube | |
| Breast reconstruction | Yes | University of Texas M.D. Anderson Cancer Center, Houston TX, US, 2003 | Disc mailed | |
| Stress testing for chest pain | Yes | Hess, Rochester, MN, US, 2012 | Included in publication | |
| Prenatal screening | No | Hunter, Ottawa, CA, 2000 | decisionaid.ohri.ca/decaids‐archive.html | |
| Breast cancer treatment | Yes | Jibaja‐Weiss, Baylor College of Medicine, 2010 | www.bcm.edu/patchworkoflife | |
| Endodontic treatment | Yes | Johnson, Chicago, US, 2004 | Included in publication | |
| Multiple Sclerosis | No | Jürgen Kasper | ||
| Abnormal uterine bleeding treatment | No | Kennedy/Coulter, London UK, 1996 | ||
| Prostate cancer screening | Yes | Krist, Fairfax VA, US | www.familymedicine.vcu.edu/research/misc/psa/index.html | |
| Prenatal screening | No | Kuppermann, San Francisco CA, US | Computerized tool | |
| Vasectomy | Yes | Labrecque, Quebec City, CA, 2010 | www.vasectomie.net (in French) | |
| Cardiovascular health treatment | No | Lalonde, Ottawa, CA, 2002 | decisionaid.ohri.ca/decaids‐archive.html | |
| Contraceptive method choice | Yes | World Health Organization, 2005 | www.who.int/reproductivehealth/publications/family_planning/9241593229index/en/index.html | |
| Pre‐operative autologous blood donation | No | Laupacis, Ottawa, CA, 2001 | decisionaid.ohri.ca/decaids‐archive.html | |
| Hormone replacement therapy | No | O'Connor, Ottawa, CA, 1996 | decisionaid.ohri.ca/decaids‐archive.html | |
| Natural health products | No | Legare, Quebec City, CA, 2006 | ||
| Use of antibiotics for acute | Yes | Legare, Quebec City, CA, 2007 | www.decision.chaire.fmed.ulaval.ca/index.php?id=192&L=2 | |
| Advanced colorectal cancer chemotherapy | Yes | Princess Margaret Hospital, Toronto, 2011 | ||
| Breast cancer genetic testing | No | Lerman/Schwartz, Washington DC, US, 1997 | ||
| Prenatal screening | No | Leung, Hong Kong, China, 2001 | ||
| Colorectal cancer | Yes | Lewis, University of North Carolina, Chapel Hill, NC, USA, 2010 | decisionsupport.unc.edu/CHOICE6/ | |
| Depression treatment | Yes | Loh, Freiburg, GER | (emailed to us by author ‐ in German) | |
| Atrial fibrillation treatment | No | McAlister/Laupacis, Ottawa CA, 2000 | decisionaid.ohri.ca/decaids‐archive.html | |
| Diabetes treatment ‐ statins | Yes | Montori, Rochester MN, US | mayoresearch.mayo.edu/mayo/research/ker_unit/form.cfm | |
| Diabetes | Yes | Marteau, King's College London, London, England, 2010 | Additional file 2 of publication | |
| Diabetes | Yes | Marteau, King's College London, London, England, 2010 | Provided by author, same DA as Mann E 2010 | |
| Mammography | Yes | Mathieu, Sydney, AU, | DA emailed by author | |
| Mammography | Yes | Mathieu, University of Sydney, AUS, 2010 | http://www.psych.usyd.edu.au/cemped/com_decision_aids.shtml | |
| Atrial fibrillation treatment | No | McAlister/Laupacis, Ottawa CAN, 2000 | decisionaid.ohri.ca/decaids‐archive.html | |
| Hormone replacement therapy | Yes, update in progress | Sigler/Bastien, Durham NC, US, 1998 | ||
| Screening after mildly abnormal pap smear | Yes | Screening & test evaluation program, School of public health, University of Sydney 2007 | ||
| BRCA1/BRCA2 gene testing | No | Miller, Fox Chase PA, US | ||
| Colorectal | Yes | University of North Carolina, Chapel Hill, NC, USA, 2007 | intmedweb.wakehealth.edu/choice/choice.html (no longer available) | |
| Hypertension treatment | No | Montgomery, UK, 2000 | ||
| Birthing options after caesarean | Yes | Montgomery, Bristol, UK, last update 2004 | www.computing.dundee.ac.uk/acstaff/cjones/diamond/Information.html | |
| Osteoporosis treatment | Yes | Montori, Mayo Foundation for Medical Education and Research, 2007 | shareddecisions.mayoclinic.org/decision‐aids‐for‐diabetes/other‐decision‐aids/ | |
| Ischaemic heart disease treatment | Yes | Informed Medical Decisions Foundation, MA,US, 2002 | informedmedicaldecisions.org/imdf_decision_aid/treatment‐choices‐for‐carotid‐artery‐disease/ | |
| Diabetes treatment | Yes | Montori or Mayo Foundation?, Rochester MN, US, | included in publication | |
| Benign prostate disease treatment | Yes | Informed Medical Decisions Foundation, MA,US, 2001 | informedmedicaldecisions.org/imdf_decision_aid/treatment‐options‐for‐benign‐prostatic‐hyperplasia/ | |
| Hormone replacement therapy | No, update in progress | Informed Medical Decisions Foundation, MA,US | informedmedicaldecisions.org/imdf_decision_aid/treatment‐choices‐for‐managing‐menopause/ | |
| Prostate cancer screening | No | Myers, Philadelphia PA, US, 1999 | ||
| Prostate cancer screening | Yes | Myers, Philadelphia PA, 1999 | ||
| Prenatal screening | Yes | Nagle, Victoria, AU | www.mcri.edu.au/Downloads/PrenatalTestingDecisionAid.pdf | |
| Birth breech presentation | Yes | Nassar, West Perth WA, AU | sydney.edu.au/medicine/public‐health/shdg/resources/decision_aids.php | |
| Hormone replacement therapy | No | O'Connor, Ottawa CA, 1996 | decisionaid.ohri.ca/decaids‐archive.html | |
| Hormone replacement therapy | No | O'Connor, Ottawa CA, 1996 | decisionaid.ohri.ca/decaids‐archive.html | |
| Osteoporosis treatment | No | Cranney, Ottawa CA, 2002 | decisionaid.ohri.ca/decaids‐archive.html | |
| Breast cancer prevention | No | Ozanne, Boston MA, US, | ||
| Prostate cancer screening | Yes | Informed Medical Decisions Foundation, MA,US, 2001 | informedmedicaldecisions.org/imdf_decision_aid/deciding‐if‐the‐psa‐test‐is‐right‐for‐you/ | |
| Colon cancer screening | Yes | Pignone, Chapel Hill NC, US, 1999 | www.med.unc.edu/medicine/edusrc/colon.htm | |
| Menorrhagia treatment | No | Protheroe, Manchester, UK | computerized decision aid, Clinical Guidance Tree ‐ no longer in existence, author sent chapter in thesis | |
| Labour | Yes | Raynes‐Greenow, Sydney,Australia, 2004 | http://www.psych.usyd.edu.au/cemped/com_decision_aids.shtml | |
| Hormone replacement therapy | No | O'Connor, Ottawa CA, 1996 | decisionaid.ohri.ca/decaids‐archive.html | |
| Hormone replacement therapy | No, update in progress | Rothert, East Lansing MI, US, 1999 | ||
| Prostate cancer screening | No | Centers for Disease Control and Prevention (CDC), US, 2010 | [No longer available] | |
| Colorectal cancer screening | Yes | Regents of the University of Michigan (copyright info), Ann Arbor MI, US, 2006 | colorectalweb.org | |
| Prostate cancer screening | Yes | Schapira, Milwaukee WI, US, 1995 | ||
| Hormone replacement therapy | Yes | Schapira, Milwaukee WI, US | computer‐based DA | |
| Colorectal | Yes | Schroy III, Boston, USA | ||
| Coronary angiogram access site | Yes | Schwalm, Hamilton, ON, Canada, 2009 | http://www.phri.ca/workfiles/studies/presentations/PtDA%20Vascular%20Access%2023‐May‐2012.pdf | |
| Breast cancer genetic testing | No | Schwartz/Lerman, Washington DC, US, 1997 | ||
| BRCA mutation prophylactic surgery | No | Schwartz, Washington DC, US | ||
| Cardiovascular prevention | Yes | Sheridan, Chapel Hill, NC, US | http://www.med‐decisions.com/cvtool/ | |
| Coronary heart | Yes | Sheridan, University of North Carolina at Chapel Hill, Division of General Internal Medicine, North Carolina, US, 2011 | http://www.med‐decisions.com/h2hv3/ | |
| Birthing options after previous caesarean | Yes (updated 2006) | Shorten, Wollongong, AU, 2000 | [email protected] or www.capersbookstore.com.au/product.asp?id=301 | |
| Bowel | Yes | Smith, Sydney, AU 2008 | sydney.edu.au/medicine/public‐health/shdg/resources/decision_aids.php | |
| Uterine fibroid treatment | Yes | Informed Medical Decisions Foundation, MA,US, 2006 | informedmedicaldecisions.org/imdf_decision_aid/treatment‐choices‐for‐uterine‐fibroids/ | |
| Colorectal cancer screening | Yes | Steckelberg, Hamburg, Germany | ||
| Breast cancer surgery | No | Street, College Station TX, US, 1995 | ||
| Atrial fibrillation treatment | Yes | Thomson, Newcastle Upon Thyne, UK | disc sent by mail | |
| Ovarian cancer risk management | No | Tiller, Randwick NSW, AU | ||
| Colorectal cancer screen | Yes | Trevena, Sydney, AU | sydney.edu.au/medicine/public‐health/shdg/resources/decision_aids.php | |
| Embryos transplant | Yes | Radboud University Nijmegen Medical Centre; 2006 | www.umcn.nl/ivfda‐en | |
| Cystic Fibrosis referral transplant | Yes | Aaron, Ottawa ON, CA, 2009 (last update 2011) | decisionaid.ohri.ca/decaids.html#cfda | |
| BRCA1/2 mutation: prophylactic surgery | Yes | vanRoosmalen, Netherlands, 1999 | see publication | |
| Breast cancer surgery | Yes | Vodermaier, Vancouver BC, CA | received by email (in German) | |
| Prostate cancer screening | Yes | Informed Medical Decisions Foundation, MA,US, 1999 | informedmedicaldecisions.org/imdf_decision_aid/deciding‐if‐the‐psa‐test‐is‐right‐for‐you/ | |
| Prostate cancer screening | No | Volk, Houston TX, US | ||
| Menorrhagia treatment | No | Vuorma, Helsinki Finland, 1996 | ||
| Colorectal cancer screening | Yes | Wakefield, Sydney, AU, | www.genetics.edu.au/Information/PublicationsBrochuresandPamphlets/Understanding%20Genetic%20Tests%20for%20Lynch%20Syndrome | |
| Breast cancer genetic testing | Yes | Wakefield, Sydney, AU, | ||
| Breast cancer genetic testing | Yes | Wakefield, Sydney, AU, | ||
| Prostate cancer screening | Yes | Oxford, UK | included in publication | |
| Diabetes mellitus type 2 treatment | Yes | Montori, Rochester MN, US | mayoresearch.mayo.edu/mayo/research/ker_unit/form.cfm | |
| Breast cancer chemotherapy | Yes | Whelan, Hamilton CA, 1995 | included in publication | |
| Breast cancer surgery | Yes | Whelan, Hamilton CA, 1997 | included in publication | |
| Prostate cancer screening | Yes | Wolf, Charlottesville VA, US, 1996 | Script in publication | |
| Colon cancer screening | Yes | Wolf, Charlottesville VA, US, 2000 | Script in publication | |
| Pregnancy termination | No | Bekker, Leeds, UK, 2002 |
| Outcome | Knowledge | Accurate risk perception | Value‐choice agreement | Uninformed | Unclear values | Participation ‐ practitioner controlled | |
| Total studies | n = 42 | n = 19 | n = 13 | n = 22 | n = 18 | n = 14 | |
| Random sequence generation | low | 35 (83.3%) | 8 (42.1%) | 7 (53.8%) | 19 (86.4%) | 17 (94.4%) | 12 (87.7%) |
| unclear | 7 (16.7%) | 11 (57.9%) | 6 (46.2%) | 3 (13.6%) | 1 (5.6%) | 2 (14.3%) | |
| high | 0 | 0 | 0 | 0 | 0 | 0 | |
| Allocation concealment | low | 30 (71.4%) | 12 (63.2%) | 11 (84.6%) | 20 (90.9%) | 17 (94.4%) | 10 (71.4%) |
| unclear | 12 (28.6%) | 7 (36.8%) | 2 (15.4%) | 2 (9.1%) | 1 (5.6%) | 4 (28.6%) | |
| high | 0 | 0 | 0 | 0 | 0 | 0 | |
| Incomplete outcome data | low | 26 (61.9%) | 11 (57.9%) | 11 (84.6%) | 15 (68.2%) | 13 (72.2%) | 10 (71.4%) |
| unclear | 16 (38.1%) | 8 (42.1%) | 2 (15.4%) | 7 (31.8%) | 5 (27.8%) | 4 (28.6%) | |
| high | 0 | 0 | 0 | 0 | 0 | 0 | |
| Selective reporting | low | 15 (35.7%) | 7 (36.8%) | 6 (46.2%) | 9 (40.9%) | 8 (44.4%) | 4 (28.6%) |
| unclear | 27 (64.3%) | 12 (63.2%) | 7 (53.8%) | 13 (59.1%) | 10 (55.6%) | 10 (71.4%) | |
| high | 0 | 0 | 0 | 0 | 0 | 0 | |
| Other bias | low | 34 (81.0%) | 14 (73.7%) | 11 (84.6%) | 19 (86.4%) | 17 (94.4%) | 11 (78.6%) |
| unclear | 7 (16.7%) | 5 (26.3%) | 2 (15.4%) | 3 (13.6%) | 1 (5.6%) | 3 ( 21.4%) | |
| high | 1 (2.4%) | 0 | 0 | 0 | 0 | 0 | |
| Blinding of participants and personnel | low | 9 (21.4%) | 1 (5.3%) | 2 (15.4%) | 3 (13.6%) | 2 (11.1%) | 2 (14.3%) |
| unclear | 31 (73.8%) | 17 (89.5%) | 11 (84.6%) | 18 (81.8%) | 15 (83.3%) | 9 (64.3%) | |
| high | 2 (4.8%) | 1 (5.3%) | 0 | 1 (4.5%) | 1 (5.6%) | 3 (21.4%) | |
| Blinding of outcome assessment | low | 41 (97.6%) | 19 (100%) | 13 (100%) | 22 (100%) | 18 (100%) | 13 (92.9%) |
| unclear | 1 (2.4%) | 0 | 0 | 0 | 0 | 1 (7.1%) | |
| high | 0 | 0 | 0 | 0 | 0 | 0 | |
| Study | Scale used | Timing | N Decision aid | Decision aid ‐ mean | N Comparison | Comparison ‐ mean | Notes |
| DA versus usual care | |||||||
| 12 true or false questions; scores ranging from ‐12 to +12 | immediately post | 89 | 4.9 | 103 | 2.17 | P < 0.001 | |
| 7‐item multiple choice knowledge test (unable to standardize results) | on discharge (˜ 1 month) | 49 | 15 (4.4 SD) | 58 | 10.9 (5.4 SD) | P = 0.01 | |
| 12‐item multiple choice | pre‐operatively | 66 | 14%* | 67 | 8%* | *mean increase from baseline P = 0.02 | |
| 10‐item yes/no/unsure general knowledge test about natural health products (not specific to outcomes of options) | change scores from baseline to 2 weeks | 43 | 0.86 ± 1.77 P = 0.002 | 41 | 0.51 ± 1.47 P = 0.031 | No difference between groups (P = 0.162) | |
| 14 items survey | immediately post | No difference in level of knowledge between groups | |||||
| 9 item ‐ 4 concept questions and 5 numeric questions | 351 | 357 | Significantly higher mean increase for the intervention group (2.62 ) compared to control group (0.68) from baseline, P < 0.001 | ||||
| 8 items survey | 2‐week, 2‐month, and 6‐month follow‐ups | Intervention type had no impact on general or specific knowledge | |||||
| Good level knowledge was scored higher than the mid point of the knowledge scale (greater than 4) | 88% (147/167) in DA group compared to 72% (123/171) pamphlet group. Odds ratio (3.43 95%CI 1.79 to 6.58) | ||||||
| Change in knowledge from baseline | post‐test | 15 | 48% to 64% | 15 | 45% to 57% | change in knowledge score was significant for decision aid (P = 0.01) but not control (P = 0.13) | |
| 10‐item knowledge index score | 2 weeks | 308 | 7.44 | 290 | 6.9 | P = 0.001 | |
| 24‐items adapted from existing prostate cancer knowledge measures | immediately post | 100 | 100 | the total mean standardized knowledge score was 84.38 (SD 12.38). | |||
| Adequate knowledge (positive score: understanding benefits/harms) | 1 month | 134 | 28/134 | 137 | 8/137 | P = 0.0001 | |
| 12‐item true/false/don't know | post‐test | 468 | 75% (range 0 to 100) | 522 | 25% (range 0 to 100) | P < 0.0001 | |
| 14‐item ‐ 9 addressed by decision aid; 5 were not | immediately post | 52 | 46 | Mean difference between groups 2.4 (95% CI 1.5 to 3.3) P < 0.05 (when decision aid administered during the consultation only ‐ not if prior to the consultation) | |||
| Detailed versus simple DA | |||||||
| 2 weeks | 233 | 223 | Significant improvement in knowledge with no difference between groups (entertainment decision aid or audio‐booklet) | ||||
| CI: confidence interval; DA: decision aid; SD: standard deviation | |||||||
| Study | Scale used | Timing | N Decision aid | Decision aid ‐ mean | N Comparison | Comparison ‐ mean | Notes |
| DA versus usual care | |||||||
| Expectation of benefit index 11 items score from 1 to 4 with lower score indicating better knowledge | post (after reviewing DA) | 127 | 2.3 | 129 | 2.6 | P = 0.001 | |
| 3 of 8 multiple choice items in the knowledge test (question 4, 5, 7) | 2 weeks post | total knowledge reported only | |||||
| 5 item numerical questions (max = 5) | post | 113 | 3.02 | 189 | 2.45 | P < 0.001 | |
| 2‐week, 2‐month, and 6‐month follow‐ups | Intervention type had no impact on risk perceptions | ||||||
| 8 numerical questions (max = 8) | 357 | 2.93 (SD 2.91) | 173 | 0.58 (SD1.28) | P < 0.001 | ||
| immediately | 52 | 46 | Difference between group OR 22.4 (95% CI 5.9 to 85.8) when decision aid administered during the consultation only (not if prior to) OR 6.7 (95% CI 2.2 to 19.7) when the decision aid administered prior to or during the consultation | ||||
| CI: confidence interval; DA: decision aid; OR: odds ratio; SD: standard deviation | |||||||
| Study | Scale used | Timing | N Decision aid | Decision aid ‐ mean | N Comparison | Comparison ‐ mean | Notes |
| DA versus usual care | |||||||
| Percent match procedures described by Sepucha et al (2007; 2008). For values items were most predictive and used to specify logistic models to estimate predicted probability of selecting surgery > 0.5. | post intervention | 75 | 77 | The intervention group experienced a more rapid early improvement in value concordance immediately after the intervention compared to control, see Figure 2. | |||
| Concordance between patient's preferences and values for potential outcomes related to the decision and the choice made | within weeks | 155 | 151 | Men assigned to the decision aid who chose not to have a PSA test rated their concern about prostate cancer lower than did men who requested a PSA test. Men assigned to usual care provided similar ratings of concern about prostate cancer regardless of their PSA decision. There was no statistically significant difference between groups. | |||
| Women valuing of non chemical aspect of nature health products was positively associated with their choice of nature health products, P = 0.006. | |||||||
| Association between values and choice | ‐‐‐‐‐‐ | ‐‐‐‐‐‐ | ‐‐‐‐‐‐ | ‐‐‐‐‐‐ | ‐‐‐‐‐‐ | No difference; between group differences were not reported | |
| Congruence between personal values and decision | 3 weeks | 70 | 70 | Patient choices were consistent with their values across both randomised groups | |||
| Detailed versus simple DA | |||||||
| Correlation between expected utilities and their likelihood of taking hormones | ‐‐‐‐‐‐ | ‐‐‐‐‐‐ | ‐‐‐‐‐‐ | ‐‐‐‐‐‐ | ‐‐‐‐‐‐ | Simple DA showed lower correlations between expected value of hormones and likelihood of taking hormones than did more detailed DA | |
| My decision was consistent with my personal values. (Likert Scale, ranged from 1‐5) | 4‐5 weeks after intervention | 103 | 87.5 (SD 20) | 112 | 80 (SD 22.5) | P < 0.01 | |
| multi‐nomial logistic regression analysis | No significant difference between groups | ||||||
| DA: decision aid; SD: standard deviation | |||||||
| Study | Scale used | Timing | N Decision aid | Decision aid ‐ mean | N Comparison | Comparison ‐ mean | Notes |
| DA versus usual care | |||||||
| Total Decisional Conflict‐ change from baseline (standardised values) | immediately post | 75 | mean (‐20) SD (19.44) | 77 | mean (‐11.8) SD (22.83) | P = 0.03 | |
| Decisional conflict scale | uncertainty | ‐3.61 units | P = 0.04 | ||||
| uninformed | No significant difference | ||||||
| unclear values | ‐3.57 units | P = 0.002 | |||||
| unsupported | No significant difference | ||||||
| Ineffective decision | No significant difference | ||||||
| total | ‐1.75 units | P = 0.07 | |||||
| Decisional conflict scale | immediately post | DCS was higher in the intervention group compared to control, P < 0.001. | |||||
| Decisional conflict ‐ sub‐scales only | Feeling uninformed | 155 | 23.37 | 151 | 29.68 | P < 0.05 | |
| Feeling unclear values | 155 | 32.25 | 151 | 37.93 | P < 0.05 | ||
| Feeling supported | 155 | 30.51 | 151 | 35.21 | P < 0.05 | ||
| Feeling uncertain | 155 | 151 | No difference | ||||
| Effective decisions | 155 | 151 | No difference | ||||
| Decisional conflict | immediately after office visit | 196 | 1.54 | 75 | 1.58 | No difference | |
| Decisional conflict scale median (range) | 1‐2 weeks post intervention | 107 | 26 (range 0‐79) | 100 | 26 (range 0‐67) | No difference | |
| Based on approaches suggested by Marteau et al. (informed choice) | immediately after intervention | 91 | 71% | 110 | 64% | P = 0.24 | |
| Decisional conflict | post consultation | 15 | 15 | Both groups showed lower decisional conflict post‐consultation (P < 0.001) but no difference between groups | |||
| Decisional conflict | immediately post | The total mean score was 24.5 with a SD of 15.25 (n=200) | |||||
| Decisional conflict | 12 of 16 items of the original scale | Significant longitudinal impact of the decision aid was moderated by baseline decision status; decision aid led to significant decreases in decisional conflict for those who were undecided at the time of randomisation | |||||
| Decisional conflict | post consultation | 53 | 56 | Difference between decision aid and control group were ‐0.18 (95% CI ‐0.34 to ‐0.01). P = 0.036 | |||
| 3‐months post | 51 | 55 | Difference between decision aid and control group were ‐0.15 (95% CI ‐0.37 to 0.06), no significant difference. | ||||
| 15 item questionnaire (1‐5) ‐ satisfaction‐uncertainty | post intervention, pre IVF | 124 | 72.5 | 128 | 75 | P = 0.76 | |
| 15 item questionnaire (1‐5) ‐ informed (includes some items from DCS). | post intervention, pre IVF | 124 | 77.5 | 128 | 87.5 | P = 0.001 | |
| Decisional conflict | immediately post | 52 | 46 | Mean difference indicates statistically significantly lower decisional conflict for decision aid compared to usual care. Total DCS ‐10.6 (‐15.4 to ‐5.9) Uncertain ‐12.8 (‐18.4 to ‐7.3) Informed ‐17.3 (‐22.6 to ‐12.0) if administered during consult ‐6.6 (‐14.3 to ‐1.1) if administered prior to consult Values clarity ‐8.5 (‐15.7 to ‐1.3) Support ‐9.4 (‐14.8 to ‐3.9) Effective decision ‐10.0 (‐15.0 to ‐5.0) | |||
| CI: confidence interval; DA: decision aid; DCS: decisional conflict scale; IVF: in vitro fertilisation; SD: standard deviation | |||||||
| Study | Scale used | Timing | N Decision aid | Decision aid ‐ mean | N Comparison | Comparison ‐ mean | Notes |
| DA versus usual care | |||||||
| Total DCS | 2 week follow‐up | 357 | 13.63 (SD 20.55) | 173 | 14.91(SD 18.34) | P = 0.02 | |
| Detailed versus simple DA | |||||||
| Uncertainty | 2 weeks | 39 | 5.8 (SD 18.0) | 48 | 6.8 (SD 18.0) | P = 0.80 | |
| Informed | 2 weeks | 39 | 9.1 (SD 26.0) | 46 | 18.8 (SD 26.1) | P = 0.09 | |
| Values | 2 weeks | 40 | 17.4 (SD 36.8) | 48 | 34.9 (SD 36.6) | P = 0.03 | |
| Social Support | 2 weeks | 39 | 17.8 (SD 29.6) | 48 | 27.6 (SD 29.5) | P = 0.12 | |
| Total DCS | 2 weeks | 38 | 12.0 (SD 21.9) | 46 | 21.7 (SD 21.8) | P = 0.04 | |
| DA: decision aid; DCS: decisional conflict scale; SD: standard deviation | |||||||
| Study | Scale used | Timing | N Decision aid | Decision aid ‐ mean | N Comparison | Comparison ‐ mean | Notes |
| DA versus usual care | |||||||
| Discussed feeding with physician, nurse practitioner, or physician's assistant | 3 months | 126 | 46% | 127 | 33% | P = 0.04 | |
| Discussed feeding with other nursing home staff | 3 months | 126 | 64% | 127 | 71% | P = 0.42 | |
| OPTION scale | analysis of the consultation using video‐recorded consultations | 101 | Mean of 26.6 (95% CI 24.9 to 8.2) | 103 | Mean of 7% (95%CI 5.9 to 8.1) | Significantly greater in the intervention arm | |
| DCS / Dolan's Provider DCS | immediately post | Difference 0.26 (95%CI ‐0.06 to 0.53, P = 0.06) | |||||
| OPTION 100 point Scale | analysis of the consultation using video‐recorded consultations | 38 | 49.8 | 32 | 27.3 | P < 0.001 | |
| OPTION Scale | analysis of the consultation using video‐recorded consultations | 48 used decision aid within consultation | 49.7% (SD 17.74) | 37 usual care | 27.7% (SD 11.75 | MD 21.8 (95% CI 13.0, 30.5) for decision aid vs usual care. All but 2 of the 12 items significantly | |
| Discussed CHD with doctor | patient reported immediately post | 16/41 decision aid pre‐consult with summary report to bring to consult |
| 8/34 usual care |
| absolute difference 16%; 95% CI | |
| Plan to reduce CHD risk & discussed with doctor | patient reported immediately post | 15/41 decision aid pre‐consult with summary report to bring to consult |
| 8/34 usual care |
| absolute difference 13%; 95% CI ‐7% to 34%). | |
| Plan to reduce CHD risk & not discussed with doctor | patient reported immediately post | 37/41 decision aid pre‐consult with summary report to bring to consult |
| 25/34 usual care | absolute difference 16%; 95% CI | ||
| OPTION Scale | analysis of the consultation using video‐recorded consultations | 1/2 used decision aid prior to consult and 1/2 used it during consult | usual care | Greater patient participation (MD 4.4; 95% CI 2.9 to 6.0) in decision aid compared to usual care | |||
| Detailed versus simple DA | |||||||
| Agreement between women’s and physicians’ decisional conflict scores | immediately post | 87 | ICC = 0.44 (95% CI 0.25 to 0.59) | 80 | ICC = 0.28 (95% CI 0.06 to 0.47) | Agreement measure was higher for the DA group. | |
| DCS / Dolan's Provider Decision Process Assessment Instrument | immediately post | 97 detailed decision aid pre consult | ICC 0.44 (0.9 SD) | 87 simple decision aid pre consult | ICC 0.28 (1.0 SD) | Agreement measure was higher for the DA group (ICC 0.44; 95% CI 0.25 to 0.59) than for the pamphlet group (ICC 0.28; 95% CI 0.06 to 0.47) | |
| Informed decision making | analysis of the physician–patient encounter using audio‐recordings | 3.0 items | 2.4 items | RR 1.30 (CI 1.03 to 1.64) P = 0.029 | |||
| CHD: coronary heart disease; CI: confidence interval; DA: decision aid; DCS: decisional conflict scale; ICC: intraclass correlation coefficient; OPTION scale: observing patient involvement scale; RR: risk ratio; SD: standard deviation | |||||||
| Study | Scale used | Timing | N Decision aid | Decision aid ‐ mean | N Comparison | Comparison ‐ mean | Notes |
| DA versus usual care | |||||||
| control preferences ‐ patients choosing active/ collaborative decision making | post intervention | 291 | 95% | 334 | 92% | No difference | |
| control preferences did not change | post intervention | 291 | 92% | 334 | 87% | No difference | |
| control preferences changed to passive | post intervention | 291 | 3% | 334 | 5% | No difference | |
| control preferences changed to active/ collaborative | post intervention | 291 | 3% | 334 | 7% | No difference | |
| COMRADE used to measure patients' perceived involvement in decisions | post‐consultation | 49 | 79.5 (SD 18.6) 76.8 (SD 20.9) | 58 | 69.7 (SD 20.0) 73.5 (SD 19.3) | increased patient involvement in decision aid group post intervention compared to usual care at baseline. At discharge there was no difference between groups. | |
| surrogates feeling somewhat or very involved in decision making | post intervention | 83% | 77% | P = 0.18 | |||
| achieved decision involvement | post intervention | 32% | 35% | No difference | |||
| patients' perceived involvement in decision making | post‐consultation | 191 | 26.3 pre 28.0 post | 96 | 24.5 pre 25.5 post | Improved patient participation from baseline to post exposure to the decision aid (P = 0.010) and in comparison to the usual care group (P = 0.003) but there was no change in the control group for the pre‐post comparison | |
| adapted from the Control Preferences Scale | post‐intervention | the total mean scores were: 2.74±1.25 (n=99) pre and 2.83±1.16 (n=199) post, no statistically significant difference. | |||||
| Decision Evaluation scale (15 item questionnaire) Decision control subscale | post‐consultation | 124 | 85 | 128 | 87.5 | P = 0.33 | |
| DA: decision aid; SD: standard deviation | |||||||
| Study | Scale used | Timing | N Decision aid | Decision aid ‐ mean | N Comparison | Comparison ‐ mean | Notes |
| DA versus usual care | |||||||
| single item ‐ ranging from '0 = completely undecided' to '100 = made my decision' | No difference | ||||||
| DA: decision aid | |||||||
| Study | Scale used | Timing | N Decision aid | Decision aid ‐ mean | N Comparison | Comparison ‐ mean | Notes |
| DA versus usual care | |||||||
| 1‐item; pleased with treatment choice | 1 month post‐surgery | 62/66 | 55/67 | P = 0.03 | |||
| satisfaction with decision scale: median (range) | 1 month post intervention | 107 | 22(13‐25) | 100 | 21(15‐25) | No difference | |
| 7‐point scale: ranging from 1‐7 | 4 weeks | 91.17 (14) | 91.33(14.50) | No difference | |||
| 6‐item | 1, 6, 12 months | 100 | 114 | Overall, no difference between groups; decision aid led to significantly increased satisfaction compared to US among those who were undecided at randomisation but not among those who had made a decision before randomisation; (only graph in paper with no raw data) | |||
| satisfaction with the decision | immediately post | 134 | 137 | No difference (P = 0.56) | |||
| Detailed versus simple DA | |||||||
| 6‐item scale (measured on 1 to 5) | 1 day | 83 | 4.0 (0.56) | 89 | 3.8 (0.66) | No difference | |
| 6 months | 63 | 3.8 (0.63) | 75 | 3.8 (0.67) | No difference | ||
| 12 months | 62 | 3.9 (0.62) | 74 | 3.9 (0.67) | No difference | ||
| 6‐item scale | 3 months | No difference | |||||
| DA: decision aid | |||||||
| Study | Scale used | Timing | N Decision aid | Decision aid ‐ mean | N Comparison | Comparison ‐ mean | Notes |
| DA versus usual care | |||||||
| Effectiveness of consultation ‐ patient assessment. Single item 1 (not at all effective) to 7 (extremely effective) | 106 | 6.6 | 105 | 6.6 | No difference | ||
| Effectiveness of consultation ‐ counsellor assessment. Single item 1 to 7 | 5.9 | 5.8 | No difference | ||||
| Satisfaction with decision process (0 for strongly agree to 5 for strongly disagree) | 101 | 103 | Patients in DA group reported greater satisfaction with the DM process (strongly agree, 61% DA vs 40% usual care) | ||||
| Measured satisfaction with opportunities to participate in decision making using a single item | Compared to usual care, women who received the decision aid followed by nurse coaching were statistically significantly more satisfied with the opportunities to participate in decision making (OR 1.5; 95% CI 1.1 to 2.0). | ||||||
| Satisfaction with information received sub‐scale 4‐item (0 to 100; low to high) | average 10 days | 54 | 76 (15.5 SD) | 56 | 59 (23.3 SD) | P = 0.001 | |
| Satisfaction with practitioner treatment during decision process sub‐scale 4‐item (0 to 100; low to high) | average 10 days | 54 | 69 (25.3 SD) | 56 | 54 (26.7 SD) | P = 0.004 | |
| Satisfaction with cancer information service 1‐item (1 to 5; low to high) | 2 weeks | 4.37 (0.84 SD) | 4.38 (0.86 SD) | No difference | |||
| 6 months | 4.51 (0.75 SD) | 4.51 (0.64 SD) | No difference | ||||
| (7 point scales) Participants' satisfaction with knowledge transfer ‐amount of information ‐clarity of information ‐helpfulness of the information ‐would want other decisions ‐recommend to others | post intervention | 49 | 6.6 6 6 6.1 6.4 | 46 | 6.3 6 5.8 5.8 6.2 | P = 0.798 P = 0.296 P = 0.624 P = 0.248 P = 0.435 | |
| Clinicians' satisfaction with knowledge transfer ‐helpfulness of the information ‐would want other decisions ‐recommend to others | post intervention | 39 | 5.8 6.1 5.9 | 33 | 5.2 4.9 4.8 | P = 0.006 P < 0.001 P < 0.001 | |
| Satisfaction with information about medicines | 4 months post | 16 | 10.4 (SD 2.9) | 17 | 10.1 (SD 2.2) | No difference | |
| ‐ physician helped me understand ‐ physician understood important to me ‐ physician answered questions ‐ satisfied with involvement ‐ satisfied with physician's involvement ‐ satisfied with process | 1 week follow‐up | 53 | 49 (92.5%) 47 47 44 36 42 | 56 | 53 (94.6%) 50 51 45 36 50 | High satisfaction with no difference by group | |
| Detailed versus simple DA | |||||||
| Satisfaction with decision making process 7‐item scale (5‐point response) | 3 months | 171 | separate responses provided with no total | 172 | separate responses provided with no total | No difference except DA more likely to report they had as much information as they wanted and less likely to report having relied too much on physician's opinion | |
| Satisfaction with genetic counselling 11‐item short form (range 4 to 44; low to high) | immediately post | 116 | 37.27 (5.74 SD) | 126 | 40.48 (4.26 SD) | P < 0.001 higher satisfaction with individual counselling compared to decision aid | |
| Satisfaction with involvement in decision making (3 questions) | 26 to 30 weeks gestation | 244 | 44.8 44.3 72.6 | 252 | 49.2 48.1 79.9 | P = 0.40 P = 0.45 P = 0.10 | |
| DA: decision aid; SD: standard deviation | |||||||
| Study | Scale used | Timing | N Decision aid | Decision aid ‐ mean | N Comparison | Comparison ‐ mean | Notes |
| DA versus usual care | |||||||
| Preparation for Decision Making Scale | Pre‐consultation | 43 | 35 (median) | 40 | 20.5 (median) | P = 0.0001 | |
| Preparation for Decision Making Scale | 3 weeks | 70 | 65.1 (24.9 SD) | 79 | 53.9 (27.1 SD) | P = 0.009 | |
| Detailed versus simple DA | |||||||
| Preparation for Decision Making Scale | Post‐physician consultation | 48 | 28 (6.1 SD) | 42 | 27(5.5 SD) | No difference | |
| DA: decision aid; SD: standard deviation | |||||||
| Study | Type of comparison | N Decision aid | Decision aid ‐ mean | N Comparison | Comparison ‐ mean | Notes |
| Other elective surgery ‐ uptake | ||||||
| DA versus usual care | 127 | 1 | 129 | 3 | No difference | |
| DA versus usual care | No difference | |||||
| Other elective surgery ‐ preference | ||||||
| Detailed versus simple DA | 32 | 13 | 31 | 14 | No difference | |
| Screening ‐ Breast cancer genetic testing ‐ uptake | ||||||
| Detailed versus simple DA | No difference | |||||
| Detailed versus simple DA | No difference | |||||
| Screening ‐ Breast cancer genetic testing ‐ preference | ||||||
| DA versus usual care | The intervention decreased intention to obtain genetic testing among women at average risk, but increased in women at high risk | |||||
| Screening ‐ Cardiac stress testing ‐ uptake | ||||||
| DA versus usual care | 101 | 58% | 100 | 77% | P < 0.0001 | |
| Screening ‐ Colorectal cancer genetic testing ‐ uptake | ||||||
| Detailed versus simple DA | No difference | |||||
| Screening ‐ Breast screening ‐ uptake | ||||||
| DA versus usual care | No difference | |||||
| DA versus usual care | 117 | 82% | 209 | 61% | P < 0.001 | |
| Screening ‐ Diabetes ‐ uptake | ||||||
| DA versus usual care | 633 | 353 | 639 | 368 | P = 0.51 | |
| Screening ‐ Diabetes ‐ preference | ||||||
| DA versus usual care | 273 | 134 | No difference | |||
| Screening ‐ Prenatal ‐ uptake | ||||||
| DA versus usual care | No difference | |||||
| DA versus usual care | 184 | 50% | 206 | 53.8% | No difference | |
| DA versus usual care | No difference | |||||
| Screening ‐ PSA ‐ uptake | ||||||
| DA versus usual care | The experimental interventions led to significant reductions in requests for prostate‐specific antigen tests ( ˜2 times greater decline). | |||||
| Medication ‐ Antibiotics for upper respiratory infections ‐ uptake | ||||||
| DA versus usual care | 81 | 33 | 70 | 49 | P = 0.08 | |
| Medication ‐ Cardiovascular disease ‐ preference | ||||||
| DA versus usual care | 79 | 63% | 78 | 42% | P < 0.01 | |
| Medication ‐ Breast cancer prevention ‐ uptake | ||||||
| DA versus usual care | 382 | 0.5% | 100 | 0% | No difference | |
| Medication ‐ Chemotherapy for advanced cancer | ||||||
| DA versus usual care | 107 | 77% | 100 | 71% | No difference | |
| Medication ‐ Hormone replacement therapy ‐ uptake | ||||||
| DA versus usual care | 8% decrease in DA group, not statistically significant | |||||
| Detailed versus simple DA | No difference | |||||
| Medication ‐ Natural heath products ‐ preference | ||||||
| DA versus usual care | 41% | 41% | No difference | |||
| Medication ‐ Anti‐thrombosis ‐ uptake | ||||||
| DA versus usual care | 25% decrease in DA group, not statistically significant | |||||
| DA versus usual care | No difference | |||||
| DA versus usual care | 93.8% | 25% | risk ratio 0.27 (95% CI 0.11 to 0.63) | |||
| Medication ‐ Hypertension ‐ uptake | ||||||
| DA versus usual care | No difference | |||||
| Medication ‐ Chemotherapy for breast cancer ‐ preference | ||||||
| DA versus usual care | No difference | |||||
| Medication ‐ Osteoporosis ‐ uptake | ||||||
| DA versus usual care | 52 | 44% | 48 | 40% | No difference | |
| Medication ‐ Immunotherapy ‐ uptake | ||||||
| DA versus usual care | No difference | |||||
| Medication ‐ Schizophrenia treatment ‐ uptake | ||||||
| Hamann 2006 ‐ prescriptions | DA versus usual care | No difference | ||||
| Hamann 2006 ‐ psycho‐education | DA versus usual care | Higher uptake in DA group (P = 0.003) | ||||
| Obstetrics ‐ Birth control method ‐ preference | ||||||
| DA versus usual care | 114 | 108 | No difference in the methods chosen between groups, participants in the intervention group were not more likely to initiate the requested method immediately compared to those in | |||
| Obstetric ‐ Childbirth procedure ‐ uptake | ||||||
| DA versus usual care | No difference | |||||
| DA versus usual care | No difference | |||||
| Obstetric ‐ Childbirth procedure ‐ preference | ||||||
| DA versus usual care | No difference | |||||
| Obstetric ‐ Embryo transplant ‐ uptake | ||||||
| van Peperstraten 2010 ‐ single embryo transfer | DA versus usual care | 152 | 43% | 156 | 32% | P = 0.05 |
| Obstetric ‐ Pain relief in labour ‐ uptake | ||||||
| Detailed versus simple DA | 308 | 146 | No difference | |||
| Other‐ Lung transplant referral | ||||||
| DA versus usual care | No difference | |||||
| Other ‐ Pre‐operative blood transfusion ‐ uptake | ||||||
| DA versus usual care | No difference | |||||
| Vaccine ‐ Flu shot ‐ uptake | ||||||
| DA versus usual care | 48 | 46% | 59 | 27% | No difference | |
| Vaccine ‐ Hepatitis B ‐ uptake | ||||||
| DA versus usual care | Significant increase of 76% in the DA group | |||||
| DA: decision aid; OR: odds ratio | ||||||
| Reference | Scale used | N Decision aid | Mean (SD) Decision aid | N Comparison | Mean (SD) Comparison | Notes |
| DA versus usual care | ||||||
| 3 months ‐ Using a contraceptive method that was in the same effectiveness group as the method requested at enrolment, 'very effective', as chosen option ‐ eg. if chose sterilization and ended up using an IUD counted as adhering | 48 | 85% | 52 | 77% | P = 0.28 | |
| 3 months ‐ Using a contraceptive method that was in the same effectiveness group, 'effective', as chosen option | 41 | 68% | 31 | 68% | P = 0.96 | |
| 6 to 8 weeks ‐ Patient reported ‐ 5‐point Likert scale on steadiness of following the treatment plan: 1‐very bad to 5‐very good | 191 | 4.3 (0.9) | 96 | 3.9 (1.0) | P = 0.073 | |
| 6 to 8 weeks ‐ Physician reported ‐ 5‐point Likert scale steadiness of following the treatment plan: 1‐very bad to 5‐very good | 191 | 4.8 (0.6) | 96 | 4.3 (1.1) | P = 0.56 | |
| 3 months ‐ telephone administration of the 8‐item Morisky adherence (7 yes/no items and 1 item with 5 point Likert scale to elicit behaviours such as skipping medicines when they have no symptoms) | 70% of participants reported good adherence to statins with no difference between groups | |||||
| 6 months ‐ telephone administration of the 8‐item Morisky adherence (7 yes/no items and 1 item with 5 point Likert scale to elicit behaviours such as skipping medicines when they have no symptoms) | 80% of participants reported good adherence to statins with no difference between groups | |||||
| 6 months ‐ Self reported – Measured % of patients taking therapy initially chosen | 129 | 95.35% | 134 | 93.28% | P = 0.44 | |
| ˜ 3 years ‐ Self reported – 6 item Adherence Questionnaire: from "I take all my tablets at the same time of day" to "I take hardly any of my tablets“ | No difference | |||||
| 6 months ‐ Percentage of participants that self‐reported currently taking medication who have not missed one dose within last week | 17 | 65% | 19 | 63% | P = 0.92 | |
| 6 months ‐ Percentage of participants who opted to take biophosphonates who took their medication on more than 80% of the days for which it was prescribed, based on pharmacy records | 23 | 100% | 19 | 74% | P = 0.009 | |
| 6 months ‐ Pharmacy records ‐ days covered (range) | 48 | 97.5% (range 0 to 100) | 37 | 100 (range 73.9 to 100) | AMD −8.88 (−13.6% to −4.14%) Positive AMD favours decision aid arm. This finding is statistically significant | |
| 6 months ‐ Self reported by telephone call – did not miss a dose in last week | 41 | 76% | 31 | 81% | OR 0.74 (95% CI 0.24‐2.32) | |
| 4 months ‐ Extent to which the patients' behaviour in taking medications coincides with the clinical prescription | 16 | 10.4% (32) [improvement from baseline] | 17 | 2% (26) [improvement from baseline] | Not significant | |
| 3 month ‐ adherence to initial choice post intervention | ||||||
| Any therapy promoted in decision aid | 76 | 45 (59%) | 73 | 25 (34%) | P < 0.01 | |
| any therapy promoted in decision aid + others (eg. diet or physical activity) | 77 | 64 (83%) | 77 | 52 (68%) | P = 0.02 | |
| aspirin | 32 | 30 (94%) | 19 | 11 (58%) | P < 0.01 | |
| cholesterol medicine | 14 | 12 (86%) | 6 | 5 (83%) | The intervention had little effect blood pressure or cholesterol medication, | |
| blood pressure medicine | 9 | 9 (100%) | 12 | 11 (92%) | ||
| stop smoking | 8 | 25% | 5 | 20% | No effect on smoking, although subgroups were small | |
| 3 months ‐ Self reported – mailed surveys & telephone call to non‐respondents on adherence to statin use: missed 1 dose or more within the last week. | 33 | 93.94% | 29 | 79.31% | No difference in adherence when analysis adjusted by sex, cardiovascular disease, and number of medications | |
| Detailed versus simple DA | ||||||
| 12 months ‐ Self reported – Telephone call to patients to ask estimated days missed per week and reasons Response categories: 1) taking medication as prescribed (omitting no more than one day/week) , 2) missing doses occasionally and randomly, 3) systematically deviating from the prescribed directions | 16 | ˜72% | 20 | ˜72% | No difference | |
| 12 months ‐ Self reported – daily adherence recorded on a calendar | 62 | ˜89% | 74 | ˜89% | No difference | |
| 1 month ‐ faecal occult blood test uptake | 134 | 5.2% | 137 | 6.6% | P = 0.64 | |
| DA: decision aid; OR: odds ratio | ||||||
| Reference | Timing | N Decision aid | Mean Decision aid (SD) | Change from baseline | N Comparison | Mean Comparison (SD) | Change from Baseline | Notes |
| General health ‐ DA versus usual care | ||||||||
| Barry 1997 (SF‐36) | Baseline | 104 | 67.2 (19.0) | 123 | 71.1 (17.6) | P = 0.02 | ||
| 3 months | ‐0.96 (1.41) | ‐3.59 (1.57) | ||||||
| 6 months | ‐1.46 (1.41) | ‐4.93 (1.45) | ||||||
| 12 months | 0.61 (1.58) | ‐4.99 (1.44) | ||||||
| Legare 2011 (percentage of people who felt they had a stable and better health, (SF‐12)) | 2 weeks post | not reported | 94 | +7 | not reported | 85 | ‐6 | P = 0.08 |
| Morgan 2000 (SF‐36) | 6 months post | 72 | 62 (23) | +4.0 | 88 | 65 (20) | +7.0 | No difference |
| Kennedy 2002 (SF‐36) | 2 years | 176 | 157 | No difference | ||||
| Vuorma 2003 (RAND‐36) | 1 year | 156 | 2.2 | 159 | 2.8 | No difference | ||
| Physical function ‐ DA versus usual care | ||||||||
| Barry 1997 (SF‐36) | Baseline | 104 | 81.9 (20.0) | 123 | 83.0 (18.9) | P = 0.02 | ||
| 3 months | ‐0.34 (1.61) | ‐1.81 (1.07) | ||||||
| 6 months | 0.10 (1.28) | ‐3.26 (1.37) | ||||||
| 12 months | 0.15 (1.40) | ‐3.74 (1.18) | ||||||
| Morgan 2000 (SF‐36) | 6 months post | 72 | 67 (29) | +7.0 | 88 | 71 (24) | +10.0 | No difference |
| Kennedy 2002 (SF‐36) | 2 years | 176 | 157 | No difference | ||||
| Vuorma 2003 (RAND‐36) | 1 year | 156 | 2.4 | 159 | 2.2 | No difference | ||
| Physical function ‐ Detailed versus simple DA | ||||||||
| Bernstein 1998 (SF‐12) | 3 months post | 61 | 38 (12.1) | +0.6 | 48 | 37.6 (10.6) | +3.8 | No difference |
| Social function ‐ DA versus usual care | ||||||||
| Barry 1997 (SF‐36) | Baseline | 104 | 90.6 (15.5) | 123 | 91.7 (15.7) | P = 0.17 | ||
| 3 months | 0.34 (1.58) | ‐2.26 (1.36) | ||||||
| 6 months | ‐0.05 (1.92) | ‐2.46 (1.45) | ||||||
| 12 months | ‐1.46 (1.85) | ‐3.52 (1.71) | ||||||
| Kennedy 2002 (SF‐36) | 2 years | 176 | 157 | No difference | ||||
| McCaffery 2010 (SF‐36) | 2 weeks | 77 | 84.7 | 71 | 82.1 | P = 0.39 | ||
| Vuorma 2003 (RAND‐36) | 1 year | 156 | 5.2 | 159 | 7.1 | No difference | ||
| Mental function ‐ DA versus usual care | ||||||||
| McCaffery 2010 (SF‐36) | 2 weeks | 77 | 71.3 | 71 | 71.6 | P = 0.46 | ||
| Kennedy 2002 (SF‐36) | 2 years | 176 | 157 | No difference | ||||
| Vuorma 2003 (RAND‐36) | 1 year | 156 | 4.7 | 159 | 5.3 | No difference | ||
| Mental function ‐ Detailed versus simple DA | ||||||||
| Bernstein 1998 (SF‐12) | 3 months post | 61 | 49.1 (11.4) | 0.0 | 48 | 48.9 (10.8) | +0.9 | No difference |
| Role function ‐ DA versus usual care | ||||||||
| Morgan 2000 (SF‐36) | 6 months post | 72 | 62 (44) | +20.0 | 88 | 58 (43) | +15.0 | No difference |
| Kennedy 2002 (SF‐36) | 2 years | 176 | 157 | P = 0.04 | ||||
| Vuorma 2003 (RAND‐36) | 1 year | 9.2 | 6.3 | No difference | ||||
| Bodily pain ‐ DA versus usual care | ||||||||
| Morgan 2000 (SF‐36) | 6 months post | 72 | 81 (22) | +6.0 | 88 | 77 (24) | +5.0 | No difference |
| Kennedy 2002 (SF‐36) | 2 years | 176 | 157 | No difference | ||||
| Vuorma 2003 (RAND‐36) | 1 year | 156 | 6.5 | 159 | 6.2 | No difference | ||
| Role emotional ‐ DA versus usual care | ||||||||
| Kennedy 2002 (SF‐36) | 2 years | 176 | 157 | No difference | ||||
| McCaffery 2010 (SF‐36) | 2 weeks | 77 | 80.3 | 71 | 77.4 | P = 0.61 | ||
| Vuorma 2003 (RAND‐36) | 1 year | 156 | 12.6 | 159 | 1.9 | P = 0.01 | ||
| Energy/vitality ‐ DA versus usual care | ||||||||
| Kennedy 2002 (SF‐36) | 2 years | 176 | 157 | No difference | ||||
| McCaffery 2010 (SF‐36) | 2 weeks | 77 | 55.2 | 71 | 54.1 | P = 0.09 | ||
| Vuorma 2003 (RAND‐36) | 1 year | 156 | 8.9 | 159 | 8.8 | No difference | ||
| SF‐36 all dimensions ‐ DA versus usual care | ||||||||
| McCaffery 2010 (SF‐36) | 2 weeks | 77 | 47 | 71 | 46.3 | P = 0.35 | ||
| Murray 2001b (SF‐36) | 9 months | 93 | 94 | No difference | ||||
| Murray 2001a (SP‐36) | 9 months | 54 | 48 | No difference | ||||
| Functional status ‐ DA versus usual care | ||||||||
| Deyo 2000 (Roland Disability Questionnaire) | 1 year | 171 | 20.4 | +5.4 | 173 | 20.9 | +5.7 | No difference |
| Leighl 2011 (FACT‐G) median (range) | 1 month post | 74 | 17 (6‐28) | 68 | 17.5 (7‐28) | P = 0.02 | ||
| Health utilities ‐ DA versus usual care | ||||||||
| Murray 2001a (Euroqol EQ‐5D) | No difference | |||||||
| Murray 2001b (Euroqol EQ‐5D) | No difference | |||||||
| DA: decision aid; SF‐36: Medical Outcomes Study 36‐item Short‐Form Health Survey; SF‐12: 12‐item Short‐Form Health Survey; RAND‐36: the 36‐item short form survey from the RAND Medical Outcomes Study FACT‐G: Functional Assessment of Cancer Therapy‐General | ||||||||
| Study | Outcome | Scale used | Timing | N Decision aid | Decision aid mean change | N Comparison | Comparison mean change | Notes |
| DA versus usual care | ||||||||
| Urinary symptoms | AUA Symptom Index (0 to 100) | 3 months | 104 | ‐4.80% (1.74) | 117 | ‐1.40% (1.37) | No difference; trend toward DA | |
| Urinary symptoms | AUA | 6 months | 104 | ‐3.66% (2.06) | 117 | ‐3.17% (1.77) | No difference | |
| Urinary symptoms | AUA | 12 months | 104 | ‐2.51% (2.11) | 117 | ‐4.14% (1.66) | No difference; trend toward control | |
| Impact of symptoms | BPH Impact Index (0 to 100) | 3 months | 104 | ‐6.58% (1.10) | 117 | ‐3.00% (1.05) | No difference; trend toward DA | |
| Impact of symptoms | BPH | 6 months | 104 | ‐4.37% (1.32) | 117 | ‐3.89% (1.16) | No difference; trend toward DA | |
| Impact of symptoms | BPH | 12 months | 104 | ‐5.53% (1.32) | 117 | ‐2.63% (1.32) | No difference; trend toward DA | |
| Satisfaction | SAQ (0 to 100) | 3 months | 61 | +6.2% | 48 | +10.5% | Control significantly more satisfied | |
| Angina stability | SAQ | 3 months | 61 | +17.2% | 48 | +28.3% | No difference | |
| Angina frequency | SAQ | 3 months | 61 | +5.5% | 48 | +15.3% | No difference | |
| Disease Perception | SAQ | 3 months | 61 | +14.1% | 48 | +18.8% | No difference | |
| Physical Capacity | SAQ | 3 months | 61 | ‐0.5% | 48 | +7.1% | No difference | |
| (FACT‐G) median (range) | Physical function at 1 month post | 74 | 21 (0‐28) | 68 | 20 (4‐28) | No difference | ||
| Role emotional at 1 month post | 74 | 17 (0‐20) | 68 | 17(7‐20) | No difference | |||
| No Angina | CCVA | 6 months | 72 | +49% | 88 | +48% | No difference | |
| Class I Angina | CCVA | 6 months | 72 | ‐1% | 88 | +6% | No difference | |
| Class II Angina | CCVA | 6 months | 72 | ‐23% | 88 | ‐26% | No difference | |
| Class III Angina | CCVA | 6 months | 72 | ‐26% | 88 | ‐28% | No difference | |
| Class IV Angina | CCVA | 6 months | 72 | 0% | 88 | 0% | No difference | |
| Urinary symptoms | AUA symptom Index (0 to100) | No difference | ||||||
| Menopausal symptoms | MenQol | No difference | ||||||
| Menorrhagia specific utility scale | (0 to 100) | 6 months | 60 | 59.3 (30.0) | 56 | 50.9 (25.1) | P = 0.03 higher menorrhagia quality of life favouring DA group | |
| Strokes or bleeds requiring admission | 3 months | 51 | 55 | No strokes and no bleeds requiring admission. 1 bleed and 1 transient stroke both in control group that required GP consultation | ||||
| Ongoing pregnancies (> 12 weeks gestation) | after 1st IVF cycle | 152 | 156 | 32% of participants in the intervention group and 38% of participants in the control group had ongoing pregnancies, P = 0.25 | ||||
| Twin pregnancies (> 12 weeks gestation) | after 1st IVF cycle | 152 | 156 | 4% of participants in intervention group and 6% of participants in control group had twin pregnancies, P = 0.33 | ||||
| Inconvenience due to menstrual bleeding | (5 to 25) | 1 year | 156 | 10.4 | 159 | 10.5 | No difference | |
| Menstrual pain | (0 to 12) | 1 year | 156 | 4.7 | 159 | 4.6 | No difference | |
| Detailed versus simple DA | ||||||||
| % working | 1 year | 171 | +17.3% | 173 | +18.3% | No difference | ||
| % missed 1+ day work within past month | 1 year | 171 | ‐38.4% | 173 | ‐35.2% | No difference | ||
| Back pain severity | 1 year | 171 | ‐22.4% | 173 | ‐22% | 1 year scores: DA 27.6% significantly better than control 37.2% | ||
| Leg pain severity | 1 year | 171 | ‐42.1% | 173 | ‐43.9% | No difference | ||
| Seeking compensation | 1 year | 171 | ‐2.9% | 173 | ‐5.9% | No difference | ||
| Satisfied with symptoms | 1 year | 171 | +32.1% | 173 | +32.4% | No difference | ||
| Apgar score | scores > 7 | 1 minute after birth | 395 | 221 (82%) | 201 | 149 (75%) | P = 0.12 | |
| scores > 7 | 5 minutes after birth | 395 | 235 (90%) | 201 | 167 (84%) | P = 0.68 | ||
| Birth weight | in grams | mean (SD) | 395 | 3445 (451) | 201 | 3412 (450) | P = 0.11 | |
| AUA: American Urological Association; CCVA: Canadian Cardiovascular Angina; BPH: benign prostatic hyperplasia; DA: decision aid; SAQ: Seattle Angina Questionnaire; | ||||||||
| Study | Timing | N Decision aid | Mean Decision aid (SD) | Change from baseline | N Comparison | Mean Comparison (SD) | Change from Baseline | Notes |
| State Anxiety Inventory: < 30 days post‐intervention ‐ DA versus usual care | ||||||||
| Bekker 2004; prenatal screening | Immediately post | 50 | 58.9 (16.6) | 56 | 61.2 (13.7) | No difference | ||
| Evans 2010; PSA screening | immediately post DA | 89 | 4.98 | 103 | 4.88 | P = 0.98 | ||
| Green 2004; breast cancer screening (low risk group) | Immediately post | 56 | 29 | ‐4 | 61 | 30 | ‐3 | P = 0.04 (for difference in change score) |
| Green 2004; breast cancer screening (high risk group) | Immediately post | 50 | 30 | ‐3 | 44 | 33 | ‐5 | P = 0.04 (for difference in change score) |
| post consult, 1‐2 weeks and 4 weeks post | No difference; see Figure 3 | |||||||
| Mathieu 2007; mammography screening | immediately after | 321 | 29.61 | 315 | 29.34 | No difference | ||
| McCaffery 2010; HPV screening (state trait anxiety inventory) | 2 weeks | 77 | 10.5 | 71 | 10.6 | P = 0.25 | ||
| Montgomery 2003; hypertension | immediately post DA | 44 | 35.45 (10.52) | 50 | 37.67 (13.92) | No difference | ||
| Montgomery 2007; previous cesarean section | 37 weeks gestation | 196 | 38.7 (12.2) | 195 | 42.1 (12.2) | P = 0.016 | ||
| Nassar 2007; breech presentation | 1 week | 98 | 41.4 (12.5) | 90 | 44.4 (13.9) | No difference | ||
| Protheroe 2007; menorrhagia | 2 weeks | 59 | 11.6 (3.7) | 61 | 12.2 (3.7) | P = 0.016 | ||
| Rubel 2010; PSA screening | immediately after | 20 items adapted from state portion of State‐Trait Anxiety Inventory Scale STAI ‐ Form Y; total mean score= 1.66±0.59 (n=200) for patients in both groups | ||||||
| Smith 2010; bowel cancer screening | 2 week follow‐up | 357 | 13.67 | 173 | 14.05 | P= 0.80 | ||
| Thomson 2007; anti‐thrombotic treatment for atrial fibrillation | immediately after | 53 | 56 | Significant fall in anxiety (‐4.57) but no difference between groups (P = 0.98) | ||||
| Trevena 2008 colorectal cancer screening | immediately after | 134 | 137 | No difference (P = 0.59) | ||||
| van Peperstraten 2010; number of embryos transferred | immediately after | 152 | 27.33% | 156 | 24.5% | P = 0.14 | ||
| Whelan 2004; breast cancer surgery | 7 days post DA | 94 | 42.3 (1.3) | 107 | 41.9 (1.3) | No difference | ||
| Whelan 2003; breast chemotherapy | 7 days post DA | 82 | 45.6 | +2.2 | 93 | 47.4 | +0.8 | No difference |
| Wong 2006; pregnancy termination | Immediately post | 154 | 54 (15.8) | 159 | 54 (16.1) | No difference | ||
| State Anxiety Inventory: < 30 days post‐intervention ‐ Detailed versus simple DA | ||||||||
| Goel 2001; breast cancer surgery | 1 to 3 days post DA | 74 | 51.2 (14.2) | ‐0.7 | 43 | 50.7 (14.8) | ‐0.1 | No difference |
| Hunter 2005; prenatal screening | Immediately post | 116 | 45.50 (9.69) | ‐1.17 | 126 | 47.98 (10.14) | ‐0.37 | No difference |
| Raynes‐Greenow 2010; labour analgesia | 37 weeks gestation | 395 | 33.3 (9.3) | ‐0.6 | 201 | 34.3 (11.0) | 0 | P = 0.32 |
| Tiller 2006; prophylactic ovarian cancer treatment | 2 weeks | 58 | 38.2 (13.4) | 60 | 38.0 (15.2) | No difference | ||
| State Anxiety Inventory: 1 month post‐intervention ‐ DA versus usual care | ||||||||
| Bekker 2004; prenatal screening | 1 month post DA | 29 | 35.3 (12.5) | 39 | 34.7(14.8) | No difference | ||
| Davison 1997; prostate cancer treatment | 5 to 6 weeks post DA | 30 | 35.5 | ‐9.0 | 30 | 34.5 | ‐2.5 | No difference |
| State Anxiety Inventory: 1 month post‐intervention ‐ Detailed versus simple DA | ||||||||
| 1 month post DA | 43 | 35.4 (11.7) | 43 | 37.4 (10.7) | No difference | |||
| State Anxiety Inventory: 3 months post‐intervention ‐ DA vs usual care | ||||||||
| Murray 2001a; benign prostatic hypertrophy | 3 months post DA | 55 | 36.36 (14.99) | +2.4 | 48 | 32.08 (9.836) | +0.7 | No difference |
| Murray 2001b; hormone replacement therapy | 3 months post DA | 93 | 38.42 (10.83) | ‐0.5 | 95 | 40.53 (12.96) | +1.8 | No difference |
| Nagle 2008; prenatal screening | ˜1 to 12 weeks post DA | 167 | 37.2 (12.1) | 171 | 37.36 (12.6) | No difference | ||
| Nassar 2007; breech presentation | 3 months post DA | 86 | 29.2 (9.9) | 84 | 30.8 (10.5) | No difference | ||
| Vuorma 2003; menorrhagia treatment | 3 months post DA | 184 | 37.1 | +1.0 | 179 | 35.9 | ‐1.0 | No difference |
| Whelan 2003; breast chemotherapy | 3 months post DA | 82 | 36.0 | 93 | 37.8 | No difference | ||
| State Anxiety Inventory: 6 months post‐intervention ‐ DA versus usual care | ||||||||
| Protheroe 2007; menorrhagia | 6 months post DA | 47 | 11.2 (4.2) | 52 | 13.3 (4.9) | P = 0.067 | ||
| Whelan 2004; breast cancer surgery | 6 months post DA | 94 | 39.3 (1.3) | 107 | 38.9 (1.6) | No difference | ||
| Whelan 2003; breast chemotherapy | 6 months post DA | 82 | 38.2 | 93 | 38.2 | No difference | ||
| State Anxiety Inventory: 6 months post‐intervention ‐ Detailed versus simple DA | ||||||||
| Goel 2001; breast cancer surgery | 6 months post DA | 59 | 36.6 (12.9) | ‐15.3 | 39 | 34.3 (11.6) | ‐16.5 | No difference |
| Tiller 2006; prophylactic ovarian cancer treatment | 6 months post DA | 53 | 35.7 (9.0) | 55 | 36.2 (13.6) | No difference | ||
| State Anxiety Inventory: 12 months post‐intervention ‐ DA versus usual care | ||||||||
| Whelan 2004; breast cancer surgery | 12 months post DA | 94 | 37.5 (1.4) | 107 | 36.6 (1.5) | No difference | ||
| Whelan 2003; breast chemotherapy | 12 months post DA | 82 | 39.2 | 93 | 40.2 | No difference | ||
| Other ‐ DA versus usual care | ||||||||
| Johnson 2006; endodontic treatment | Immediately post ‐ single question 7‐point Likert scale. | 32 | 3.2 (1.7) | 35 | 3.8 (2.1) | P = 0.27 | ||
| Lewis 2010; colorectal cancer screening | intrusive thoughts ‐ 3 items; 4 point scale ‐ not at all | 139 | 66.2% | 157 | 68.0% | P = 0.92 | ||
| intrusive thoughts ‐ 3 items; 4 point scale ‐ sometimes | 66 | 31.4% | 69 | 29.9% | ||||
| intrusive thoughts ‐ 3 items; 4 point scale ‐ often | 5 | 2.4% | 5 | 2.2% | ||||
| intrusive thoughts ‐ measured using 1 item from the impact of events scale | 77 | 43% | 71 | 32% | No difference | |||
| Worry about developing bowel cancer ‐ quite or very | 357 | 6% | 173 | 8% | P = 0.78 | |||
| Worry about developing bowel cancer ‐ none or a bit | 357 | 94% | 173 | 92% | ||||
| DA: decision aid; HPV: human papilloma virus; PSA: prostate‐specific antigen | ||||||||
| Study | Timing | N Decision aid | Mean Decision aid (SD) | Change from Baseline | N Comparison | MeanComparison (SD) | Change from Baseline | Notes |
| DA versus usual care | ||||||||
| Davison 1997 (20‐item CES‐D) | 5 to 6 weeks | 30 | 29.8 | ‐0.6 | 30 | 29.5 | +1.3 | No difference |
| Loh 2007 (Brief Patient Health Questionnaire‐D) | 6 to 8 weeks | 191 | 29.8 (2.7) | 96 | 27.0 (3.6) | P = 0.236 | ||
| Nagle 2008 (Edinburgh Postnatal Depression Scale) | ˜1 to 12 weeks post DA | 167 | 19 (11.6) | 171 | 19 (11.2) | No difference | ||
| Tiller 2006 (Hospital Anxiety and Depression Scale) | 2 weeks post DA | 58 | 10.9 (5.6) | 61 | 10.7 (6.4) | P = 0.03 | ||
| 6 mos post DA | 50 | 10.1(4.7) | 56 | 10.8 (6.4) | P = 0.12 | |||
| van Peperstraten 2010 (Beck Depression Inventory) | after multifaceted intervention/ before IVF | 126 | 16 (13%) | 136 | 5 (4%) | P = 0.01 | ||
| at uptake of IVF | 147 | 16 (11%) | 151 | 113 (9%) | No difference | |||
| Whelan 2004 (20‐item CES‐D) | 1 week post DA | 94 | 13.8 (1.0) | 107 | 13.4 (1.1) | No difference | ||
| 6 months post DA | 94 | 15.1 (1.1) | 107 | 14.2 (1.2) | No difference | |||
| 12 months post DA | 94 | 13.2 (1.3) | 107 | 12.8 (1.2) | No difference | |||
| Detailed versus simple DA | ||||||||
| Wakefield 2008 (Hospital Anxiety and Depression Scale) | 1 week post | 48 | 61 | No difference | ||||
| Wakefield 2008a (Hospital Anxiety and Depression Scale) | 1 week post | 56 | 63 | No difference | ||||
| Wakefield 2008b (Hospital Anxiety and Depression Scale) | immediately | 55 | 55 | No difference | ||||
| CES‐D: Centre for Epidemiology Studies Depresion Scale; DA: decision aid; IVF: in vitro fertilisation | ||||||||
| Author | Item | N Decision aid | Proportion or Mean (SD) | N Control | Proportion or Mean (SD) | Notes |
| DA vs usual care | ||||||
| 5‐item Decisional Regret Index | 126 | 11.9 | 127 | 14.3 | P = 0.14 | |
| Proportion of patients with decisional regret | 7% | 9% | P=0.91 | |||
| Detailed vs simple DA | ||||||
| Right decision | 63 | 58 (92.06%) | 44 | 42 (95.45%) | No difference | |
| Regret choice | 63 | 8 (12.70%) | 44 | 5 (11.36%) | No difference | |
| Would make same choice | 63 | 54 (85.71%) | 44 | 40 (90.91%) | No difference | |
| Choice did me harm | 63 | 7 (11.11%) | 44 | 3 (6.82%) | No difference | |
| Decision was wise | 63 | 54 (85.71%) | 44 | 41 (93.18%) | No difference | |
| Decisional Regret ‐ 3 items at 26 to 30 weeks gestation | 244 | 9.6 | 252 | 12.8 | P = 0.28 | |
| Decision Regret Scale at 6 months | 41 | 54 | No difference | |||
| Decision Regret Scale | ˜57 | 7.04 (12.12) | ˜63 | 6.39 (13.68) | No difference | |
| Decision Regret Scale | ˜56 | 9.78 (14.49) | ˜49 | 5.13 (10.16) | No difference | |
| DA: decision aid | ||||||
| Study | Scale used | Timing | N Decision aid | Decision aid ‐ mean | N Comparison | Comparison ‐ mean | Notes |
| DA vs usual care | |||||||
| 11‐item self‐efficacy scale | post intervention | 291 | 83% (40.26% SD) | 334 | 79% (33.08% SD) | No difference | |
| Decisional self efficacy | changes from baseline | 75 | + 3.0 (95% CI 0.6 to 5.4) | 77 | + 2.8 (95%CI 0.9 to 4.8) | P = 0.78 | |
| Mean confidence with decision: scale from 1 (low confidence) to 5 (high confidence) | post intervention | 48 | 4 | 59 | 3.6 | P = 0.02 | |
| Decisional self‐efficacy scale | pre‐consultation | 43 | 32 (median) | 40 | 27 (median) | P = 0.001 | |
| Perceived ability to make an informed choice 1‐item; 5‐point Likert scale | 3 days post | 106 | 108 | P = 0.008; DA group more likely to agree that they could make an informed choice about PSA screening | |||
| Perceived ability to make an informed choice 1‐item; 5‐point Likert scale | Immediately post | 131 | 136 | No difference | |||
| Confidence with ability to understand outcomes of hormone replacement therapy, make a decision, engage in discussion with practitioner 3‐items (0 to 10; low to high confidence) | 1 month post | 273 | 78% (18% SD) | 284 | 70% (19% SD) | P < 0.0001 | |
| 9 months post | 261 | 80% (17%SD) | 278 | 75% (20% SD) | P = 0.0004 | ||
| 3 items adapted from the Decisional self‐efficacy scale | 2 week follow‐up | 357 | 4.67 (0.54 SD) | 173 | 4.61(0.62 SD) | P = 0.26 | |
| Detailed versus simple DA | |||||||
| 8‐items (1 to 10; low to high confidence) | post DA | 83 | 78% (16% SD) | 89 | 80% (19% SD) | No difference | |
| 12 months post | 63 | 78% (15% SD) | 74 | 80% (19% SD) | No difference | ||
| CI: confidence interval; DA: decision aid; SD: standard deviation | |||||||
| Study | Scale used | N Decision aid | Decision aid ‐ mean | N Comparison | Comparison ‐ mean | Difference between groups | Notes |
| Consultation length ‐ DA versus usual care | |||||||
| Consultation length using DA in consult (minutes) | 50 | 32.2 (13.0 SD) | 56 | 26.3 (11.5 SD) | +5.9 minutes | P = 0.01 (longer with decision aid) | |
| Consultation length with practitioner post DA (minutes) | 106 | 82 | 105 | 90 | ‐8 minutes | P = 0.03 (shorter with decision aid) | |
| Time spent discussing prostate cancer with practitioner post DA (minutes) ‐patient reported | 196 | 5.3 | 75 | 5.2 | +0.1 minutes | No difference between groups | |
| Time spent discussing prostate cancer with practitioner post DA (minutes) ‐ physician reported | 196 | 3.8 | 75 | 4.2 | ‐0.4 minutes | No difference between groups but physicians thought they spent less time than patients (P < 0.001) | |
| Consultation length using DA in consult (minutes) | 191 | 29.2 (10.7) | 96 | 26.7 (12.5) | +2.5 minutes | P = 0.681 | |
| Consultation length using DA in consult (minutes) | 15 | 24 | 15 | 21 | +3 minutes | P = 0.42 | |
| Consultation length using DA in consult (minutes) | 8 | 44 (39 to 55) | 10 | 21 (19 to 26) | +23 minutes | P = 0.001 Compared computerized decision aid with standard gamble within the consultation to guideline driven consultation | |
| Consultation length with practitioner post DA | |||||||
| 5 to 10 min | 53 | 6 (11.3%) | 54 | 5 (9.3%) | P = 0.91 | ||
| 10 to 15 min | 17 (32.1%) | 19 (35.2%) | |||||
| 15 to 25 min | 15 (28.3%) | 14 (25.9%) | |||||
| 25 to 35 min | 7 (13.2%) | 5 (9.3%) | |||||
| Above 35 min | 8 (15.1%) | 11 (20.4%) | |||||
| Consultation length using DA in consult (minutes) | 50 | 68.3 | 50 | 65.7 | +2.6 minutes | P = 0.53 | |
| Consultation length using DA in consult (minutes) | 52 | 46 | +3.8 minutes | Not statistically significant 3.8 min longer in DA group (95%CI ‐2.9 to 10.5) | |||
| Consultation length ‐ Detailed versus simple DA | |||||||
| Encounter length with practitioner post DA (minutes) | Median 16 minutes for both groups (range 6 to 44) | ||||||
| Cost and resource use ‐ DA versus usual care | |||||||
| Cost‐consequences analysis | 235 | £2019 (SD £741) | 238 | £2033 (SD £677) | no difference | ||
| Cost effectiveness | 204 | $1556 USD | 215 | $2751 USD | Mean difference $1184 (95%CI $684 to $2110) | ||
| Total costs excluding intervention | 57 | £310.3 (SD £602.0) | 48 | £188.8 (SD £300.4) | Mean difference £121.5 (95% CI £ ‐58.9 to £302.0) | ||
| Total costs including intervention | 57 | £594.10 (SD £602) | 48 | £188.8 (SD £300.4) | Mean difference £405.4 (95% CI £224.9 to £585.8) P < 0.001 | ||
| Total costs excluding intervention | 85 | £90.5 | 84 | £90.9 (SD £39.2) | No difference | ||
| Total costs including intervention | 85 | £306.5 (SD £42.8) | 84 | £90.9 (SD £39.2) | Mean difference £215.5 (95% CI £203.1 to £228.0) P < 0.001 | ||
| GP consultations post intervention | 39/51 | 32/54 | P = 0.35 | ||||
| Hospital appointments post intervention | 29/51 | 10/54 | P = 0.06 | ||||
| Mean total savings per couple | Mean total saving per couple in the intervention group were €169.75 ($219.12 USD) | ||||||
| Cost and productivity losses | 184 | €2760 Euro | 179 | €3094 Euro | P = 0.1 No difference between intervention and control when treatment cost and productivity losses were analysed. | ||
| Cost and resource use ‐ Detailed versus simple DA | |||||||
| Healthcare use at 1 year | 171 | 172 | No difference in most services; DA less surgery for herniated disk | ||||
| CI: confidence interval; DA: decision aid; SD: standard deviation | |||||||
| Outcome | Overall mean effect (95% CI) | Without trials having high risk of bias on at least 1 of 7 criteria | Without trials having high or unclear risk of bias for at least 3 of 7 criteria |
| Knowledge ‐ decision aid versus usual care | 13.29 (11.32 to 15.25) n = 42 | 13.67 (11.60 to 15.74) n = 39 | 14.97 (11.84 to 18.10) n = 21 |
| Knowledge ‐ detailed versus simple decision aid | 5.52 (3.9 to 7.15) n = 19 | 5.48 (3.78 to 7.18) n = 18 | 6.97 (2.39 to 11.55) n = 3 |
| Accurate risk perceptions ‐ with probabilities versus no probabilities | 1.82 (1.52 to 2.16) n = 19 | 1.76 (1.48 to 2.10) n = 18 | 2.28 (1.78 to 2.92) n = 7 |
| Values congruent with chosen option | 1.51 (1.17 to 1.96) n = 13 | 1.52 (1.17 to 1.97) n = 13 | 2.15 (1.35 to 3.44) n = 6 |
| Uninformed sub‐scale of Decisional Conflict Scale ‐ decision aid versus usual care | ‐7.26 (‐9.73 to ‐4.78) n = 22 | ‐7.40 (‐10.06 to ‐4.74) n = 21 | ‐8.26 (‐11.74 to ‐4.78) n = 15 |
| Uninformed sub‐scale of Decisional Conflict Scale ‐ detailed versus simple decision aid | ‐2.39 (‐4.39 to ‐0.39) n = 10 | ‐2.39 (‐4.39 to ‐0.39) n = 10 | too few to assess, n = 1 |
| Unclear values sub‐scale of Decisional Conflict Scale ‐ decision aid versus usual care | ‐6.09 (‐8.5 to ‐3.67) n = 18 | ‐6.40 (‐9.02 to ‐3.79) n = 17 | ‐7.02 (‐10.00 to ‐4.04) n = 14 |
| Unclear values sub‐scale of Decisional Conflict Scale ‐ detailed versus simple decision aid | ‐2.31 (‐4.67 to 0.05) n = 10 | ‐2.31 (‐4.67 to 0.05) n = 10 | too few to assess, n = 1 |
| CI: confidence interval | |||
| Outcome | Overall effect | Treatment decision | Screening decision | Video/computer Decision aid | Audio/pamphlet Decision aid | Base risk control | Removal of Outliers* |
| Knowledge ‐ decision aid versus usual care | 15.2 (11.7 to 18.7) | 16.5 (11.9 to 21.2) | 13.1 (7.7 to 18.5) | 21.3 (16.3 to 26.2) | 11.9 (8.3 to 15.6) | 15.5 (11.3 to 19.8) | 17.3 (13.6 to 20.9) (*Bekker 2004, Gattellari 2003, Johnson 2006) |
| Accurate risk perceptions ‐ probabilities versus no probabilities | 1.6 (1.4 to 1.9) | 1.6 (1.4 to 1.9) | 1.6 (1.1 to 2.3) | No data | 1.6 (1.4 to 1.9) | 1.3 (1.2 to 1.5) (P = 0.3) | 1.5 (1.3 to 1.7) (*Gattellari 2003) |
| Uninformed sub‐scale of the Decisional Conflict Scale ‐ decision aid versus usual care | ‐8.4 (‐11.9 to ‐4.8) | ‐9.4 (‐13.3 to ‐5.5) | ‐3.5 (‐12.9 to 5.8) | ‐12.6 (‐19.5 to ‐5.8) | ‐4.9 (‐7.6 to ‐2.3) (P = 0.06) | ‐5.4 (‐7.7 to ‐3.2) (P = 0.11) | ‐6.2 (‐8.4 to ‐4.1) (P = 0.06) (*Montgomery 2003) |
| Unclear values sub‐scale of the Decisional Conflict Scale ‐ decision aid versus usual care | ‐6.3 (‐10.0 to ‐2.7) | ‐6.0 (‐9.8 to ‐2.3) | Insufficient data | ‐8.0 (‐15.1 to ‐1.0) | ‐4.5 (‐8.4 to ‐0.6) | ‐3.6 (‐6.8 to ‐0.5) | ‐4.0 (‐6.7 to ‐1.3) (*Montgomery 2003) |
| Outcome or subgroup title | No. of studies | No. of participants | Statistical method | Effect size |
| 1 Knowledge: DA vs usual care ‐ all studies Show forest plot | 42 | 10842 | Mean Difference (IV, Random, 95% CI) | 13.34 [11.17, 15.51] |
| 2 Knowledge: DA vs usual care ‐ treatment only Show forest plot | 23 | 3977 | Mean Difference (IV, Random, 95% CI) | 13.75 [11.08, 16.43] |
| 3 Knowledge: DA vs usual care ‐ screening only Show forest plot | 19 | 6865 | Mean Difference (IV, Random, 95% CI) | 12.76 [9.66, 15.86] |
| 4 Knowledge: Detailed vs simple decision aids ‐ all studies Show forest plot | 19 | 3531 | Mean Difference (IV, Random, 95% CI) | 5.52 [3.90, 7.15] |
| 5 Knowledge: Detailed vs simple decision aids ‐ treatment only Show forest plot | 12 | 1930 | Mean Difference (IV, Random, 95% CI) | 4.98 [2.64, 7.33] |
| 6 Knowledge: Detailed vs simple decision aids ‐ screening only Show forest plot | 7 | 1601 | Mean Difference (IV, Random, 95% CI) | 6.33 [4.49, 8.17] |
| Outcome or subgroup title | No. of studies | No. of participants | Statistical method | Effect size |
| 1 Accurate risk perceptions ‐ all studies Show forest plot | 19 | 5868 | Risk Ratio (M‐H, Random, 95% CI) | 1.82 [1.52, 2.16] |
| 2 Accurate risk perceptions ‐ treatments only Show forest plot | 12 | 2435 | Risk Ratio (M‐H, Random, 95% CI) | 1.72 [1.47, 2.01] |
| 3 Accurate risk perceptions ‐ screening only Show forest plot | 7 | 3433 | Risk Ratio (M‐H, Random, 95% CI) | 2.03 [1.40, 2.93] |
| 4 Accurate risk perceptions ‐ numbers Show forest plot | 15 | 4776 | Risk Ratio (M‐H, Random, 95% CI) | 2.00 [1.65, 2.43] |
| 5 Accurate risk perceptions ‐ words Show forest plot | 4 | 1092 | Risk Ratio (M‐H, Random, 95% CI) | 1.31 [1.13, 1.52] |
| Outcome or subgroup title | No. of studies | No. of participants | Statistical method | Effect size |
| 1 Values congruent with chosen option ‐ all studies Show forest plot | 13 | 4670 | Risk Ratio (M‐H, Random, 95% CI) | 1.51 [1.17, 1.96] |
| 2 Values congruent with chosen option ‐ treatment only Show forest plot | 3 | 452 | Risk Ratio (M‐H, Random, 95% CI) | 1.35 [0.80, 2.30] |
| 3 Values congruent with chosen option ‐ screening only Show forest plot | 10 | 4321 | Risk Ratio (M‐H, Random, 95% CI) | 1.56 [1.16, 2.11] |
| Outcome or subgroup title | No. of studies | No. of participants | Statistical method | Effect size |
| 1 Decisional conflict: DA vs usual care ‐ all studies Show forest plot | 32 | Mean Difference (IV, Random, 95% CI) | Subtotals only | |
| 1.1 Uncertainty sub‐scale | 23 | 4837 | Mean Difference (IV, Random, 95% CI) | ‐2.47 [‐4.28, ‐0.66] |
| 1.2 Uninformed sub‐scale | 22 | 4343 | Mean Difference (IV, Random, 95% CI) | ‐7.26 [‐9.73, ‐4.78] |
| 1.3 Unclear values sub‐scale | 18 | 3704 | Mean Difference (IV, Random, 95% CI) | ‐6.09 [‐8.50, ‐3.67] |
| 1.4 Unsupported sub‐scale | 19 | 3851 | Mean Difference (IV, Random, 95% CI) | ‐4.77 [‐6.86, ‐2.69] |
| 1.5 Ineffective choice sub‐scale | 19 | 3878 | Mean Difference (IV, Random, 95% CI) | ‐4.86 [‐7.04, ‐2.68] |
| 1.6 Total decisional conflict score | 28 | 5830 | Mean Difference (IV, Random, 95% CI) | ‐6.22 [‐8.00, ‐4.44] |
| 2 Decisional conflict: DA vs usual care ‐ treatment only Show forest plot | 23 | Mean Difference (IV, Random, 95% CI) | Subtotals only | |
| 2.1 Uncertainty sub‐scale | 16 | 3020 | Mean Difference (IV, Random, 95% CI) | ‐3.06 [‐5.33, ‐0.79] |
| 2.2 Uninformed sub‐scale | 17 | 3007 | Mean Difference (IV, Random, 95% CI) | ‐8.06 [‐10.52, ‐5.60] |
| 2.3 Unclear values sub‐scale | 14 | 2474 | Mean Difference (IV, Random, 95% CI) | ‐6.31 [‐9.01, ‐3.61] |
| 2.4 Unsupported sub‐scale | 15 | 2621 | Mean Difference (IV, Random, 95% CI) | ‐5.28 [‐7.74, ‐2.82] |
| 2.5 Ineffective choice sub‐scale | 15 | 2746 | Mean Difference (IV, Random, 95% CI) | ‐6.07 [‐8.41, ‐3.72] |
| 2.6 Total decisional conflict score | 22 | 3783 | Mean Difference (IV, Random, 95% CI) | ‐6.14 [‐7.78, ‐4.50] |
| 3 Decisional conflict: DA vs usual care ‐ screening only Show forest plot | 9 | Mean Difference (IV, Random, 95% CI) | Subtotals only | |
| 3.1 Uncertainty sub‐scale | 7 | 1817 | Mean Difference (IV, Random, 95% CI) | ‐1.32 [‐4.47, 1.83] |
| 3.2 Uninformed sub‐scale | 5 | 1336 | Mean Difference (IV, Random, 95% CI) | ‐4.67 [‐10.61, 1.27] |
| 3.3 Unclear values sub‐scale | 4 | 1230 | Mean Difference (IV, Random, 95% CI) | ‐5.94 [‐13.44, 1.56] |
| 3.4 Unsupported sub‐scale | 4 | 1230 | Mean Difference (IV, Random, 95% CI) | ‐2.94 [‐6.90, 1.02] |
| 3.5 Ineffective choice sub‐scale | 4 | 1132 | Mean Difference (IV, Random, 95% CI) | ‐0.17 [‐1.88, 1.55] |
| 3.6 Total decisional conflict score | 6 | 2047 | Mean Difference (IV, Random, 95% CI) | ‐6.83 [‐12.64, ‐1.03] |
| 4 Decisional conflict: Detailed vs simple decision aid ‐ all studies Show forest plot | 19 | Mean Difference (IV, Random, 95% CI) | Subtotals only | |
| 4.1 Uncertainty sub‐scale | 14 | 2130 | Mean Difference (IV, Random, 95% CI) | ‐2.15 [‐4.42, 0.12] |
| 4.2 Uninformed sub‐scale | 10 | 1264 | Mean Difference (IV, Random, 95% CI) | ‐2.39 [‐4.39, ‐0.39] |
| 4.3 Unclear values sub‐scale | 10 | 1260 | Mean Difference (IV, Random, 95% CI) | ‐2.31 [‐4.67, 0.05] |
| 4.4 Unsupported sub‐scale | 10 | 1268 | Mean Difference (IV, Random, 95% CI) | ‐2.05 [‐5.37, 1.27] |
| 4.5 Ineffective choice sub‐scale | 9 | 1541 | Mean Difference (IV, Random, 95% CI) | ‐1.06 [‐2.83, 0.71] |
| 4.6 Total decisional conflict score | 17 | 3277 | Mean Difference (IV, Random, 95% CI) | ‐1.77 [‐2.64, ‐0.91] |
| 5 Decisional conflict: Detailed vs simple decision aid ‐ treatment only Show forest plot | 12 | Mean Difference (IV, Random, 95% CI) | Subtotals only | |
| 5.1 Uncertainty sub‐scale | 9 | 1101 | Mean Difference (IV, Random, 95% CI) | ‐2.02 [‐6.65, 2.61] |
| 5.2 Uninformed sub‐scale | 6 | 672 | Mean Difference (IV, Random, 95% CI) | ‐1.16 [‐4.40, 2.09] |
| 5.3 Unclear values sub‐scale | 6 | 669 | Mean Difference (IV, Random, 95% CI) | ‐0.46 [‐3.72, 2.80] |
| 5.4 Unsupported sub‐scale | 6 | 674 | Mean Difference (IV, Random, 95% CI) | ‐0.65 [‐3.09, 1.79] |
| 5.5 Ineffective choice sub‐scale | 7 | 849 | Mean Difference (IV, Random, 95% CI) | ‐0.27 [‐2.97, 2.44] |
| 5.6 Total decisional conflict score | 10 | 1732 | Mean Difference (IV, Random, 95% CI) | ‐0.96 [‐2.30, 0.38] |
| 6 Decisional conflict: Detailed vs simple decision aid ‐ screening only Show forest plot | 7 | Mean Difference (IV, Random, 95% CI) | Subtotals only | |
| 6.1 Uncertainty sub‐scale | 5 | 1029 | Mean Difference (IV, Random, 95% CI) | ‐2.16 [‐4.20, ‐0.12] |
| 6.2 Uninformed sub‐scale | 4 | 592 | Mean Difference (IV, Random, 95% CI) | ‐3.42 [‐5.81, ‐1.02] |
| 6.3 Unclear values sub‐scale | 4 | 591 | Mean Difference (IV, Random, 95% CI) | ‐4.54 [‐6.77, ‐2.32] |
| 6.4 Unsupported sub‐scale | 4 | 594 | Mean Difference (IV, Random, 95% CI) | ‐3.65 [‐9.74, 2.44] |
| 6.5 Ineffective choice sub‐scale | 2 | 692 | Mean Difference (IV, Random, 95% CI) | ‐2.18 [‐3.60, ‐0.75] |
| 6.6 Total decisional conflict score | 7 | 1545 | Mean Difference (IV, Random, 95% CI) | ‐2.26 [‐3.33, ‐1.19] |
| Outcome or subgroup title | No. of studies | No. of participants | Statistical method | Effect size |
| 1 Participation in decision making: DA vs usual care ‐ all studies Show forest plot | 14 | Risk Ratio (M‐H, Random, 95% CI) | Subtotals only | |
| 1.1 Patient controlled decision making | 12 | 2438 | Risk Ratio (M‐H, Random, 95% CI) | 1.28 [1.02, 1.60] |
| 1.2 Shared decision making | 12 | 2402 | Risk Ratio (M‐H, Random, 95% CI) | 0.96 [0.82, 1.13] |
| 1.3 Practitioner controlled decision making | 14 | 3234 | Risk Ratio (M‐H, Random, 95% CI) | 0.66 [0.53, 0.81] |
| 2 Participation in decision making: DA vs usual care ‐ treatment only Show forest plot | 11 | Risk Ratio (M‐H, Random, 95% CI) | Subtotals only | |
| 2.1 Patient controlled decision making | 10 | 2147 | Risk Ratio (M‐H, Random, 95% CI) | 1.33 [1.05, 1.68] |
| 2.2 Shared decision making | 10 | 2111 | Risk Ratio (M‐H, Random, 95% CI) | 0.95 [0.78, 1.15] |
| 2.3 Practitioner controlled decision making | 11 | 2318 | Risk Ratio (M‐H, Random, 95% CI) | 0.70 [0.54, 0.90] |
| 3 Participation in decision making: DA vs usual care ‐ screening only Show forest plot | 4 | Risk Ratio (M‐H, Random, 95% CI) | Subtotals only | |
| 3.1 Patient controlled decision making | 3 | 887 | Risk Ratio (M‐H, Random, 95% CI) | 0.99 [0.82, 1.20] |
| 3.2 Shared decision making | 3 | 887 | Risk Ratio (M‐H, Random, 95% CI) | 1.13 [0.89, 1.45] |
| 3.3 Practitioner controlled decision making | 4 | 1512 | Risk Ratio (M‐H, Random, 95% CI) | 0.67 [0.44, 1.01] |
| 4 Participation in decision making: Detailed vs simple decision aid ‐ all studies Show forest plot | 2 | Risk Ratio (M‐H, Random, 95% CI) | Subtotals only | |
| 4.1 Patient controlled decision making | 2 | 687 | Risk Ratio (M‐H, Random, 95% CI) | 1.06 [0.68, 1.64] |
| 4.2 Shared decision making | 2 | 687 | Risk Ratio (M‐H, Random, 95% CI) | 1.07 [0.63, 1.81] |
| 4.3 Practitioner controlled decision making | 2 | 687 | Risk Ratio (M‐H, Random, 95% CI) | 1.12 [0.56, 2.23] |
| 5 Participation in decision making: Detailed vs simple decision aid ‐ treatment only Show forest plot | 2 | Risk Ratio (M‐H, Random, 95% CI) | Subtotals only | |
| 5.1 Patient controlled decision making | 2 | 687 | Risk Ratio (M‐H, Random, 95% CI) | 1.06 [0.68, 1.64] |
| 5.2 Shared decision making | 2 | 687 | Risk Ratio (M‐H, Random, 95% CI) | 1.07 [0.63, 1.81] |
| 5.3 Practitioner controlled decision making | 2 | 687 | Risk Ratio (M‐H, Random, 95% CI) | 1.12 [0.56, 2.23] |
| Outcome or subgroup title | No. of studies | No. of participants | Statistical method | Effect size |
| 1 Proportion undecided: DA vs usual care ‐ all studies Show forest plot | 18 | 4753 | Risk Ratio (M‐H, Random, 95% CI) | 0.59 [0.47, 0.72] |
| 2 Proportion undecided: DA vs usual care ‐ treatment only Show forest plot | 14 | 2830 | Risk Ratio (M‐H, Random, 95% CI) | 0.63 [0.51, 0.78] |
| 3 Proportion undecided: DA vs usual care ‐ screening only Show forest plot | 4 | 1923 | Risk Ratio (M‐H, Random, 95% CI) | 0.52 [0.30, 0.90] |
| 4 Proportion undecided: Detailed vs simple decision aids ‐ all studies Show forest plot | 3 | 352 | Risk Ratio (M‐H, Random, 95% CI) | 0.98 [0.69, 1.37] |
| 5 Proportion undecided: Detailed vs simple decision aids ‐ treatment only Show forest plot | 2 | 151 | Risk Ratio (M‐H, Random, 95% CI) | 1.02 [0.71, 1.47] |
| 6 Proportion undecided: Detailed vs simple decision aids ‐ screening only Show forest plot | 1 | 201 | Risk Ratio (M‐H, Random, 95% CI) | 0.63 [0.21, 1.86] |
| Outcome or subgroup title | No. of studies | No. of participants | Statistical method | Effect size |
| 1 Satisfaction with the choice: DA vs usual care ‐ all studies Show forest plot | 10 | Mean Difference (IV, Random, 95% CI) | Totals not selected | |
| 2 Satisfaction with the choice: DA vs usual care ‐ treatment only Show forest plot | 9 | Mean Difference (IV, Random, 95% CI) | Totals not selected | |
| 3 Satisfaction with the choice: DA vs usual care ‐ screening only Show forest plot | 1 | Mean Difference (IV, Random, 95% CI) | Totals not selected | |
| 4 Satisfaction with the choice: Detailed vs simple DA ‐ all studies Show forest plot | 3 | Mean Difference (IV, Random, 95% CI) | Totals not selected | |
| 5 Satisfaction with the choice: Detailed vs simple DA ‐ treatment only Show forest plot | 3 | Mean Difference (IV, Random, 95% CI) | Totals not selected | |
| 6 Satisfaction with the decision making process: DA vs usual care ‐ all studies Show forest plot | 6 | Mean Difference (IV, Random, 95% CI) | Totals not selected | |
| 7 Satisfaction with the decision making process: DA vs usual care ‐ treatment only Show forest plot | 5 | Mean Difference (IV, Random, 95% CI) | Totals not selected | |
| 8 Satisfaction with the decision making process: DA vs usual care ‐ screening only Show forest plot | 1 | Mean Difference (IV, Random, 95% CI) | Totals not selected | |
| Outcome or subgroup title | No. of studies | No. of participants | Statistical method | Effect size |
| 1 Choice: Surgery over conservative option: DA vs usual care Show forest plot | 15 | Risk Ratio (M‐H, Random, 95% CI) | Subtotals only | |
| 1.1 As treated analysis | 15 | 2915 | Risk Ratio (M‐H, Random, 95% CI) | 0.80 [0.67, 0.95] |
| 1.2 Intention to treat analysis | 15 | 3553 | Risk Ratio (M‐H, Random, 95% CI) | 0.79 [0.68, 0.93] |
| 2 Choice: Surgery over conservative option: Detailed vs simple decision aid Show forest plot | 3 | Risk Ratio (M‐H, Random, 95% CI) | Subtotals only | |
| 2.1 As treated analysis | 3 | 513 | Risk Ratio (M‐H, Random, 95% CI) | 0.82 [0.63, 1.08] |
| 2.2 Intention to treat analysis | 3 | 584 | Risk Ratio (M‐H, Random, 95% CI) | 0.82 [0.63, 1.08] |
| 3 Choice for screening Show forest plot | 28 | Risk Ratio (M‐H, Random, 95% CI) | Subtotals only | |
| 3.1 PSA screening: DA vs usual care | 9 | 3565 | Risk Ratio (M‐H, Random, 95% CI) | 0.87 [0.77, 0.98] |
| 3.2 PSA screening: detailed DA vs simple decision aid | 3 | 782 | Risk Ratio (M‐H, Random, 95% CI) | 0.98 [0.82, 1.17] |
| 3.3 Colorectal cancer screening: DA vs usual care | 10 | 4529 | Risk Ratio (M‐H, Random, 95% CI) | 1.12 [0.95, 1.31] |
| 3.4 Breast cancer genetic testing: DA vs usual care | 4 | 949 | Risk Ratio (M‐H, Random, 95% CI) | 1.01 [0.83, 1.22] |
| 3.5 Prenatal diagnostic testing: Detailed vs simple decision aid | 2 | 443 | Risk Ratio (M‐H, Random, 95% CI) | 0.96 [0.90, 1.03] |
| 4 Choice: Diabetes medication (uptake new medication): DA vs usual care Show forest plot | 3 | 277 | Risk Ratio (M‐H, Random, 95% CI) | 1.84 [0.77, 4.39] |
| 5 Choice: Menopausal hormone therapy: Detailed vs simple decision aid Show forest plot | 3 | 357 | Risk Ratio (M‐H, Random, 95% CI) | 0.73 [0.55, 0.98] |