Ayudas para pacientes que deben decidir sobre tratamientos o sobre la participación en pruebas de detección
Resumen
Antecedentes
Las ayudas en las decisiones están destinadas a ayudar a los pacientes a participar en las decisiones que incluyen la consideración de los efectos beneficiosos y perjudiciales de las opciones de tratamiento sobre los cuales a menudo existen dudas científicas.
Objetivos
Evaluar los efectos de las ayudas para pacientes que deben decidir sobre tratamientos o sobre la participación en pruebas de detección.
Métodos de búsqueda
Para esta actualización, se hicieron búsquedas desde 2009 hasta junio 2012 en MEDLINE; CENTRAL; EMBASE; PsycINFO; y en la literatura gris. De forma acumulativa, se han hecho búsquedas en cada base de datos desde su fecha de inicio incluyendo CINAHL (hasta septiembre 2008).
Criterios de selección
Se incluyeron ensayos controlados aleatorios publicados de las ayudas en las decisiones, que son intervenciones diseñadas para apoyar la toma de decisiones por parte de los pacientes al hacer explícita la decisión, proporcionar información acerca del tratamiento o de las opciones de pruebas de detección y sus resultados asociados, en comparación con atención habitual o intervenciones alternativas. Se excluyeron los estudios en participantes que tomaban decisiones hipotéticas.
Obtención y análisis de los datos
Dos autores de la revisión examinaron de forma independiente las listas para la inclusión, extrajeron los datos y evaluaron el riesgo de sesgo. Las variables de resultado primarias, basads en los International Patient Decision Aid Standards (IPDAS), fueron:
A) atributos de la “alternativa elegida”;
B) atributos del “proceso de toma de decisiones”.
Los resultados secundarios fueron los efectos conductuales, en la salud y en el sistema de salud. Los resultados se combinaron con el uso de diferencias de medias (DM) y de riesgos relativos (RR), con un modelo de efectos aleatorios.
Resultados principales
Esta actualización incluye 33 nuevos estudios para un total de 115 estudios que incluyen a 34 444 participantes. En cuanto al riesgo de sesgo, el informe de resultado selectivo y el cegamiento de los participantes y el personal se consideraron inciertos en su mayoría debido al informe inadecuado. Sobre la base de siete ítems, ocho de 115 estudios presentaron un riesgo alto de sesgo para uno o dos ítems cada uno.
De 115 estudios incluidos, 88 (76,5%) usaron al menos uno de los criterios de efectividad de los IPDAS: A) criterios de atributos de la “alternativa elegida”: puntuaciones del conocimiento (76 estudios); percepciones de riesgo exactas (25 estudios); y elección fundamentada basada en los valores (20 estudios); y B) criterios de atributos del “proceso de toma de decisiones”: sentirse informado (34 estudios) y sentirse seguro acerca de los valores (29 estudios).
A) Criterios relacionados con los atributos de la “alternativa elegida”:
En comparación con la atención habitual, las ayudas en las decisiones aumentaron el conocimiento (DM 13,34 de cada 100; intervalo de confianza [IC] del 95%: 11,17 a 15,51; n = 42). Cuando las ayudas más detalladas en las decisiones se compararon con las ayudas simples en las decisiones, la mejoría relativa en el conocimiento fue significativa (DM 5,52 de cada 100; IC del 95%: 3,90 a 7,15; n = 19). La exposición a un procedimiento de ayuda con probabilidades expresadas originó una proporción mayor de pacientes con percepciones de riesgo exactas (RR 1,82; IC del 95%: 1,52 a 2,16; n = 19). La exposición a un procedimiento de ayuda con aclaración explícita de los valores dio lugar a una proporción mayor de pacientes que eligieron una opción congruente con sus valores (CR 1,51; IC del 95%: 1,17 a 1,96; n = 13).
B) Criterios relacionados con los atributos del “proceso de toma de decisiones”:
Las ayudas en las decisiones comparadas con las intervenciones de atención habitual dieron lugar a:
a) reducción del conflicto de decisión relacionado con la sensación de no estar informado (DM ‐7,26 de 100; IC del 95%: ‐9,73 a ‐4,78; n = 22) y la sensación de falta de seguridad acerca de los valores personales (DM ‐6,09; IC del 95%: ‐8,50 a ‐3,67; n = 18);
b) reducción en las proporciones de pacientes que fueron pasivos en la toma de decisiones (CR 0,66; IC del 95%: 0,53 a 0,81; n = 14); y
c) reducción en las proporciones de pacientes que continuaron sin tomar decisiones luego de la intervención (CR 0,59; IC del 95%: 0,47 a 0,72; n = 18).
Las ayudas en las decisiones parecieron tener un efecto positivo sobre la comunicación entre el médico y el paciente en los nueve estudios que midieron este resultado. Para la satisfacción con la decisión (n = 20), el proceso de toma de decisiones (n = 17), o la preparación para la toma de decisiones (n = 3), los pacientes expuestos a una ayuda en las decisiones estuvieron más satisfechos, o no hubo ninguna diferencia entre las intervenciones con ayuda en las decisiones versus de comparación. Ningún estudio evaluó los atributos del proceso de toma de decisiones para ayudar a los pacientes a reconocer que deben tomar una decisión, o entender que los valores afectan la elección.
C) Medidas de resultado secundarias
La exposición a un procedimiento de ayuda en comparación con la atención habitual redujo el número de pacientes que prefirieron la cirugía mayor invasiva electiva a favor de opciones más conservadoras (CR 0,79; IC del 95%: 0,68 a 0,93; n = 15). La exposición a un procedimiento de ayuda en comparación con la atención habitual redujo el número de pacientes que eligieron someterse a pruebas de detección de antígeno prostático específico (CR 0,87; IC del 95%: 0,77 a 0,98; n = 9). Cuando se utilizaron ayudas detalladas en comparación con ayudas simples en las decisiones, menos pacientes eligieron el tratamiento con hormonas en la menopausia (CR 0,73; IC del 95%: 0,55 a 0,98; n = 3). En otras decisiones, el efecto sobre las opciones fue variable.
El efecto de las ayudas en las decisiones sobre la duración de la consulta varió de ocho minutos menos a 23 minutos más (mediana 2,55 minutos más) y dos estudios indicaron una duración estadística y significativamente más larga, un estudio una duración más corta y seis estudios no informaron diferencias en la duración de la consulta. Los grupos de pacientes que recibieron ayudas en las decisiones no parecieron ser diferentes de los grupos de comparación en cuanto a la ansiedad (n = 30), los resultados de salud general (n = 11), y los resultados de salud específicos de la enfermedad (n = 11). Los efectos de las ayudas en las decisiones sobre otros resultados (cumplimiento de la decisión, costos/uso de recursos) no fueron concluyentes.
Conclusiones de los autores
Hay pruebas de alta calidad de que las ayudas en las decisiones en comparación con la atención habitual mejoran el conocimiento de los pacientes con respecto a las opciones, y reducen el conflicto en las decisiones relacionado con la sensación de no estar informado ni seguro acerca de los valores personales. Hay pruebas de calidad moderada de que las ayudas en las decisiones en comparación con la atención habitual estimulan a los pacientes a asumir un rol más activo en la toma de decisiones, y mejoran las percepciones de riesgo exactas al incluir las probabilidades en las ayudas en las decisiones, en comparación con ninguna inclusión de las probabilidades. Hay pruebas de baja calidad de que las ayudas en las decisiones mejoran la congruencia entre la opción elegida y los valores del paciente.
En esta revisión actualizada hay pruebas nuevas adicionales que indican elecciones más fundamentadas y basadas en los valores y una mejoría en la comunicación entre el médico y el paciente. Hay un efecto variable de las ayudas en las decisiones sobre la duración de consulta. Las ayudas en las decisiones tienen un efecto variable sobre las elecciones, lo cual es compatible con los hallazgos de la revisión anterior. Reducen el número de pacientes que eligen la cirugía de forma voluntaria y no presentan ningún efecto adverso evidente sobre los resultados de salud o la satisfacción. Los efectos sobre el cumplimiento de la opción elegida, el costo‐eficacia, el uso en poblaciones con un nivel menor de alfabetización, y el nivel de detalles necesarios en las ayudas en las decisiones deben evaluarse de forma adicional. Se conoce poco acerca del grado de detalles que se necesita en las ayudas en las decisiones para lograr un efecto positivo sobre los atributos de la alternativa elegida, o el proceso de toma de decisiones.
PICO
Resumen en términos sencillos
Ayudas para pacientes que deben decidir sobre tratamientos o sobre la participación en pruebas de detección
La identificación y toma de una decisión acerca del mejor tratamiento o la mejor opción en cuanto a las pruebas de detección pueden ser difíciles para los pacientes. Las ayudas en las decisiones pueden utilizarse cuando hay más de una opción razonable, cuando ninguna opción presenta una ventaja clara en cuanto a los resultados de salud y cuando cada opción posee efectos beneficiosos y perjudiciales que los pacientes pueden valorar de diferente modo. Las ayudas en las decisiones pueden incluir folletos, videos o herramientas en la Web. Hacen que la decisión sea explícita, describen las opciones disponibles y ayudan a los pacientes a comprender estas opciones así como sus efectos beneficiosos y perjudiciales potenciales. Lo anterior ayuda a los pacientes a considerar las opciones desde un punto de vista personal (p.ej., cuán importantes son los efectos beneficiosos y perjudiciales potenciales para ellos) y los ayuda a participar con el profesional de salud en la toma de decisiones.
La revisión actualizada, con búsquedas actualizadas en junio de 2012, incluye 115 estudios con 34 444 participantes. Los hallazgos muestran que cuando los pacientes utilizan ayudas en las decisiones: a) mejoran su conocimiento sobre las opciones (pruebas de alta calidad); b) se sienten más informados y más seguros acerca de lo que les importa más (pruebas de alta calidad); c) tienen expectativas más exactas de los efectos beneficiosos y perjudiciales potenciales de las opciones (pruebas de calidad moderada); y d) participan más en la toma de decisiones (pruebas de calidad moderada). Los pacientes que utilizaron ayudas en las decisiones que incluían un ejercicio para ayudarles a aclarar lo que les importa más, tuvieron mayor probabilidad de tomar decisiones que fueran compatibles con sus valores. Sin embargo, la calidad de las pruebas fue moderada para este resultado, lo cual significa que la investigación adicional puede cambiar estos hallazgos. Las ayudas en las decisiones reducen el número de pacientes que eligen la prueba de antígeno prostático específico y la cirugía electiva cuando los pacientes consideran otras opciones. Tienen un efecto variable sobre la mayoría de las elecciones reales restantes. Las ayudas en las decisiones mejoran la comunicación entre los pacientes y el profesional sanitario. Las ayudas más detalladas en las decisiones son mejores que las ayudas simples en las decisiones para mejorar el conocimiento del paciente y reducir el conflicto en las decisiones relacionado con la sensación de no estar informado ni seguro acerca de los valores personales. Las ayudas en las decisiones no empeoran los resultados de salud y los pacientes que las utilizan no presentan menor satisfacción. Se necesita más investigación para evaluar el cumplimiento de la opción elegida, los costos asociados, el uso en pacientes que presentan habilidades de lectura más limitadas y el nivel de detalle necesario en la ayuda en las decisiones.
Conclusiones de los autores
Summary of findings
| Patient decision aids compared with usual care for adults considering treatment or screening decisions | ||||||
| Patient or population: adults considering treatment or screening decisions Settings: all settings Intervention: patient decision aid Comparison: usual care | ||||||
| Outcomes | Illustrative comparative benefits* (95% CI) | Relative effect | No of Participants | Quality of the evidence | Comments | |
| Assumed benefit | Corresponding benefit | |||||
| Usual care | Patient decision aid | |||||
| Knowledge: decision aid versus usual care ‐ all studies standardized on score from 0 (no knowledge) to 100 (perfect knowledge) [soon after exposure to the decision aid] | The mean knowledge score was 56.9% ranged across control groups from 31% to 85.2% | The mean knowledge score in the intervention groups was 13.34 higher (11.17 to 15.51 higher) | 10,842 | ⊕⊕⊕⊕ | Higher scores indicate better knowledge. 41 out of 42 studies showed an improvement in knowledge. | |
| Accurate risk perceptions ‐ all studies [soon after exposure to the decision aid] | 296 patients per 1000 | 542 patients per 1000 | RR 1.82 (95% CI: 1.52 to 2.16) | 5868 | ⊕⊕⊕⊝ | |
| Congruence between the chosen option and their values ‐ all studies [soon after exposure to the decision aid] | 316 patients per 1000 | 498 patients per 1000 | RR 1.51 (95% CI: 1.17 to 1.97) | 4670 (13 studies) | ⊕⊕⊝⊝ | |
| Decisional conflict: decision aid versus usual care ‐ all studies ‐ Uninformed sub‐scale standardized on score from 0 (not uninformed) to 100 (uninformed) [soon after exposure to the decision aid] | The mean feeling uninformed ranged across control groups from 12.75 to 49.1. Scores of 25 or lower are associated with follow‐through with decisions; whereas scores that exceed 38 are associated with delay in decision making | The mean feeling uninformed in the intervention groups was 7.26 lower (9.73 to 4.78 lower) | 4343 (22 studies) | ⊕⊕⊕⊕ | Lower scores indicate feeling more informed. | |
| Decisional conflict: decision aid versus usual care ‐ all studies ‐ Unclear values sub‐scale standardized on score from 0 (not unclear) to 100 (unclear) [soon after exposure to the decision aid] | The mean feeling unclear values ranged across control groups from 15.5 to 51.29. Scores of 25 or lower are associated with follow‐through with decisions; whereas scores that exceed 38 are associated with delay in decision making | The mean feeling unclear values in the intervention groups was 6.09 lower (8.50 to 3.67 lower) | 3704 (18 studies) | ⊕⊕⊕⊕ | Lower scores indicate feeling more clear about values | |
| Participation in decision making: decision aid versus usual care ‐ all studies ‐ Practitioner controlled decision making [soon after consultation with practitioner] | 174 patients per 1000 | 103 patients per 1000 | RR 0.66 (95%CI: 0.53 to 0.81) | 3234 | ⊕⊕⊕⊝ | Patient decision aids aim to increase patient involvement in making decisions. Lower proportion of practitioner controlled decision making is better. |
| *The basis for the assumed risk (e.g. the median control group risk across studies) is provided in footnotes. The corresponding risk (and its 95% confidence interval) is based on the assumed risk in the comparison group and the relative effect of the intervention (and its 95% CI). | ||||||
| GRADE Working Group grades of evidence | ||||||
| 1. The vast majority of studies measuring this outcome were not at high risk of bias. 2.The GRADE rating was downgraded given the lack of precision. 3.The GRADE rating was downgraded given the lack of consistency. 4.The GRADE rating was downgraded given the lack of directness. | ||||||
Antecedentes
En muchas decisiones sobre tratamientos para la salud y sobre el uso de métodos de detección, no existe una elección que sea la “mejor”. Estos tipos de decisiones se consideran “sensibles a las preferencias” debido a que no hay pruebas suficientes sobre sus resultados o es necesario balancear los efectos beneficiosos con los perjudiciales conocidos. Clinical Evidence clasificó 3000 tratamientos como: 50% no tenían pruebas suficientes, 24% es probablemente beneficioso, 7% es necesario “balancear los efectos beneficiosos y perjudiciales”, 5% es poco probable que fuera beneficioso, 3% es probablemente ineficaz o nocivo y solamente el 11% era claramente beneficioso (Clinical Evidence 2013). No solo se debe considerar la solidez de las pruebas sino que, incluso en el 11% que muestra efectos beneficiosos para las poblaciones, es necesario explicarles a los pacientes la naturaleza probabilística de las pruebas para lograr una decisión fundamentada basada en los valores. Las ayudas en las decisiones de los pacientes es una intervención que se puede utilizar para presentar pruebas (Brouwers 2010).
Según la International Patient Decision Aids Standards (IPDAS) Collaboration (Elwyn 2006; IPDAS 2005a; Joseph‐Williams 2013), las ayudas en las decisiones son herramientas basadas en la evidencia diseñadas para ayudar a los pacientes a elegir alternativas específicas y deliberadas entre las opciones de asistencia sanitaria. Las ayudas en las decisiones de los pacientes complementan (y no reemplazan) la orientación de los médicos acerca de las opciones. Los objetivos específicos de las ayudas en las decisiones y el tipo de decisión tomada pueden variar ligeramente, pero en general:
-
Declaran explícitamente la decisión que necesita considerarse;
-
Proporcionan información basada en la evidencia sobre un problema de salud, las opciones, los beneficios asociados, los daños, las probabilidades y las incertidumbres científicas;
-
Ayudan a los pacientes a reconocer que la decisión es sensible a sus valores y aclaran, implícita o explícitamente, el valor que ellos le atribuyen a los beneficios y a los daños, así como las incertidumbres científicas. (Para lograr lo anterior, las ayudas en las decisiones de los pacientes pueden describir las opciones en detalles suficientes para que los clientes puedan imaginar los efectos físicos, emocionales y sociales que puedan experimentar o guían a los clientes para considerar cuáles efectos beneficiosos y perjudiciales son más importantes para ellos).
Las ayudas en las decisiones son diferentes de los materiales habituales de educación sanitaria porque las ayudas en las decisiones hacen explícita la decisión considerada y proporcionan énfasis detallados, específicos y personalizados sobre las opciones y resultados para preparar a los pacientes para tomar decisiones. Por el contrario, los materiales de educación sanitaria ayudan a los pacientes a comprender el diagnóstico, el tratamiento y la conducta en términos generales, pero debido a su perspectiva más amplia estos materiales no necesariamente les ayudan a participar en la toma de decisiones. Muchas ayudas en las decisiones se basan en un marco conceptual modelo o teórico (Durand 2008; Mulley 1995; O'Connor 1998b; Rothert 1987).
Las ayudas en las decisiones se pueden utilizar antes, durante o después del encuentro con el médico, para permitirles a los pacientes convertirse en participantes activos e informados. Las ayudas en las decisiones también pueden facilitar la toma de decisiones compartida. La toma de decisiones compartida se define como el proceso mediante el cual la alternativa de atención sanitaria es elegida por los médicos junto con el paciente (Charles 1997; Makoul 2006) y se dice que es el punto fundamental de la atención centrada en el paciente (Weston 2001). Sin embargo, la forma en que el médico proporciona la información puede afectar intensamente cómo los pacientes construyen las preferencias (Hibbard 1997); lo que indica la necesidad de información estandarizada como las ayudas en las decisiones de los pacientes. Los pacientes que son más activos al tomar decisiones acerca de la salud tienen mejores resultados de salud y experiencias de atención sanitaria (Hibbard 2013; Kiesler 2006).
Las ayudas en las decisiones se han desarrollado principalmente en Australia, Europa, Norteamérica y el Reino Unido. Desde 1999, ha ocurrido una rápida proliferación de las ayudas en las decisiones. Por ejemplo, se accedió a las ayudas en la decisión de los productores a gran escala de más de ocho millones de veces en 2006 (O'Connor 2007). En respuesta a la preocupación sobre la diversidad de la calidad de las ayudas en las decisiones de los pacientes, la IPDAS Collaboration llegó a un acuerdo sobre los criterios para evaluar su calidad (Elwyn 2006). Participaron más de 100 investigadores, médicos, pacientes y elaboradores de políticas de 14 países. Los participantes abordaron tres dominios de la calidad: contenido médico, proceso de desarrollo y evaluación de la efectividad de las ayudas en las decisiones de los pacientes. Posteriormente, un equipo internacional de investigadores logró consenso sobre un grupo más pequeño de criterios de calificación y certificación (Joseph‐Williams 2013). Los artículos previos que informaban los criterios originales de los IPDAS se actualizaron en 2012 (IPDAS 2013).
El objetivo final de las ayudas en las decisiones de los pacientes es mejorar la toma de decisiones para lograr una decisión de alta calidad. Durante el último decenio, se ha debatido ampliamente la definición de una “buena decisión”, cuando ninguna terapéutica es la “mejor” y la elección depende de cómo los pacientes valoran los beneficios versus los daños (Briss 2004; O'Connor 2003a; O'Connor 1997b; Sepucha 2004). La IPDAS llegó a un acuerdo sobre los criterios para juzgar "las cuestiones que usted necesitaría observar para poder expresar después de proporcionar a los pacientes una ayuda en la decisión, si la manera en que se tomó la decisión y la elección realizada fue correcta" (Elwyn 2006; IPDAS 2005b; Sepucha 2013). Los criterios fueron como sigue:
-
alternativa elegida: la ayuda a los pacientes mejora la coincidencia entre la opción elegida y las características que más interesan al paciente informado;
-
proceso de toma de decisiones: la ayuda en la toma de decisiones a los pacientes los ayuda a: reconocer que es necesario tomar una decisión; conocer las opciones y sus características; entender que sus valores afectan la decisión; tener certeza acerca de las características de la opción que más le interesa; discutir los valores con su médico; y tomar parte en las alternativas preferidas.
Se han publicado varios ensayos individuales que examinan la eficacia de las ayudas en las decisiones. Hay informes, bibliografías anotadas y revisiones generales sobre las ayudas en la toma de decisiones (Bekker 1999; Bekker 2003; RTI 1997 Estabrooks 2000; Molenaar 2000; O'Connor 1997a; O'Connor 1999c; RTI 1997; Whelan 2002). En 1999, se publicó la primera revisión sistemática de 17 ensayos aleatorios sobre las ayudas en la toma de decisiones (O'Connor 1999b; O'Connor 2001a), seguida por actualizaciones en 2003 con un total de 35 estudios (O’Connor 2003b), en 2009 con un total de 55 estudios (O’Connor 2009) y en 2011 con un total de 86 estudios (Stacey 2011). Los hallazgos de esta revisión se han utilizado para informar guías de práctica clínica como la Patient Experience in Adult NHS Services (NCGC/NICE 2012) y Decision Support for Adults Living with Chronic Kidney Disease (RNAO 2009).
Varias revisiones sistemáticas se centran en el uso de las ayudas en las decisiones de los pacientes como un tipo de intervención para facilitar la toma de decisiones compartida en la práctica clínica (Coyne 2013; Duncan 2010; Elwyn 2013; Legare 2010).
Objetivos
Evaluar los efectos de las ayudas para pacientes que deben decidir sobre tratamientos o sobre la participación en pruebas de detección.
Métodos
Criterios de inclusión de estudios para esta revisión
Tipos de estudios
Se incluyeron todos los estudios publicados que usaron un diseño de ensayo controlado aleatorio (ECA), que compararon ayudas en la decisión con ninguna intervención, la atención habitual, intervenciones alternativas o una combinación.
Tipos de participantes
Se incluyeron los estudios que reclutaron personas que tenían que tomar decisiones entre opciones de pruebas de diagnóstico o tratamientos, para ellos mismos, para un hijo o para otro familiar incapacitado. Se excluyeron aquellos estudios cuyos participantes plantearan decisiones hipotéticas.
Tipos de intervenciones
Se incluyeron los estudios que evaluaron una ayuda en las decisiones de los pacientes como parte de la intervención. Las ayudas en las decisiones se definieron como intervenciones diseñadas para ayudar a los pacientes a tomar decisiones específicas y deliberadas entre varias opciones (incluyen las que están en uso en un momento determinado), al proporcionar (como mínimo) a) información acerca de las opciones y los resultados pertinentes al estado de salud de un paciente, y b) los métodos implícitos para aclarar los valores. La ayuda también puede incluir: Información sobre la enfermedad o la afección; los costes asociados con las opciones; las probabilidades de resultados asociados con los factores de riesgo de salud de cada persona; un ejercicio explícito de aclaración de valores; información de las opiniones de otros; una recomendación personalizada, basada en las características clínicas y las preferencias expresadas; y una guía o instrucciones sobre los pasos a seguir en la toma de decisiones y la comunicación con otros.
Se excluyeron los estudios con intervenciones dirigidas a: decisiones acerca de cambios en el estilo de vida, ingreso a ensayos clínicos o directivas generales anticipadas (p.ej. no reanimar); programas de educación no vinculados a una decisión específica; y las intervenciones diseñadas para promover el cumplimiento o conseguir el consentimiento informado respecto a una opción recomendada. También se excluyeron los estudios sobre ayudas en las decisiones que no estaban disponibles y de los que no fue posible determinar si proporcionaron criterios mínimos para calificar como una ayuda en las decisiones de los pacientes y sus características.
Tipos de medida de resultado
Para evaluar si la ayuda en la decisión logró sus objetivos, se examinó una amplia variedad de efectos positivos o negativos. Aunque las ayudas en la decisión estaban dirigidas a diversas decisiones clínicas, muchas tenían objetivos similares, como mejorar el conocimiento, lograr percepciones de riesgo exactas y participación en la toma de decisiones. Muchos de estos criterios de evaluación coincidían con los criterios de los International Patient Decision Aids Standards (IPDAS) para evaluar la efectividad de las ayudas en las decisiones (Elwyn 2006; IPDAS 2005b; Sepucha 2013). La lista total de las medidas de resultado, especificadas de antemano en la revisión, incluyen:
Resultados primarios
Criterios de evaluación que coinciden con los criterios de los IPDAS
-
Atributos de la alternativa elegida: ¿Las ayudas en las decisiones mejoran la coincidencia entre la opción elegida y las características que más interesan al paciente informado (demostrado por resultados como conocimiento, percepciones de riesgo exactas y opción elegida congruente con sus valores)?
-
Atributos del proceso de toma de decisiones: ¿Las ayudas en las decisiones ayudan a los pacientes a: reconocer que es necesario tomar una decisión; conocer las opciones y sus características; entender que sus valores afectan la decisión; estar seguros acerca de las características de la opción que más les interesa; discutir los valores con su médico; e involucrarse con las alternativas preferidas?
Otras variables del proceso de toma de decisiones
-
Conflicto en la toma de decisiones
-
Comunicación entre el médico y el paciente
-
Participación en la toma de decisiones
-
Proporción indecisa
-
Satisfacción
Resultados secundarios
Comportamiento
-
Elección (elección real realizada; si no se informó, la opción preferida se utilizó como una medida alternativa)
-
Cumplimiento de la opción seleccionada
Resultados relacionados con la salud
-
Estado de salud y calidad de vida (genérica y específica al trastorno)
-
Ansiedad, depresión, dificultad emocional, pesar, confianza
Sistema de asistencia sanitaria
-
Costes y coste‐efectividad
-
Duración de la consulta
-
Frecuencia de litigios
Results
Description of studies
The current version of our review updates our 2011 version (Stacey 2011, which included 86 studies) with 33 new studies: Allen 2010; Arterburn 2011; Berry 2013; Bjorklund 2012; Chambers 2012; de Achaval 2012; Evans 2010; Fagerlin 2011; Hanson 2011; Hess 2012; Jibaja‐Weiss 2011; Labrecque 2010; Langston 2010; Legare 2011; Leighl 2011; Lewis 2010; Mann D 2010; Mann E 2010; Marteau 2010; Mathieu 2010; McCaffery 2010; Miller 2011; Montori 2011; Myers 2011; Raynes‐Greenow 2010; Rubel 2010; Schroy 2011; Schwalm 2012; Sheridan 2011; Smith 2010; Solberg 2010; Steckelberg 2011; van Peperstraten 2010. We re‐assessed four previously‐included studies as 'excluded' due to quasi‐experimental design (Dunn 1998; Herrera 1983; Phillips 1995) or the same intervention in both arms but delivered using different formats (Frosch 2003).
Results of the search
In total, we identified 38,069 unique citations from the electronic database searches and 247 citations from other sources. Of these, only 2072 citations focused on people's decision making (see Figure 1).

Study flow diagram.
Of the 2072 citations identified, 358 appeared to be evaluations of patient decision aids. We excluded 186 of these upon close perusal of the paper (see Characteristics of excluded studies). The reasons for exclusion were: a) the study was not a randomized controlled trial; b) the decision was hypothetical, with participants not actually at a point of decision making; c) the intervention was not focused on making a choice; d) the intervention offered no decision support in the form of a decision aid or did not provide enough information about the decision aid; e) no comparison outcome data were provided; f) the study did not evaluate the decision aid; g) the study was a protocol; h) the decision aid was about clinical trial entry, lifestyle choice, or advanced care planning; or i) the study involved testing the presentation of decision aid, but with no difference in the content of the decision aid between study groups.
We also identified 30 ongoing RCTs through trial registration databases, personal contact, and published protocols in the electronic database searches (see references to Ongoing studies and table Characteristics of ongoing studies).
Using the old and new search strategies for 2009 and 2010, there was no difference in the included articles identified despite that the newer search strategy yielded fewer citations.
Included studies
The remaining 142 citations provided data on 115 studies that met our inclusion criteria, 33 of which are new for this update. The 115 RCTs, involving 34,444 participants, presented results from 9 countries (Australia (n = 15), Canada (n = 21), China (n = 1), Finland (n = 2), Germany (n = 5), Netherlands (n = 2), Sweden (n = 1), the United Kingdom (n = 14), the United States (n = 53), and Australia plus Canada (n = 1)). Study details are presented below and in the table Characteristics of included studies.
Unit of randomization
One hundred studies randomized individual patients and 15 randomized clusters. Allen 2010 randomized 12 company work sites; Goel 2001 randomized 57 surgeons; Hamann 2006 randomized 12 inpatient psychiatric units; Legare 2003 randomized 40 family physicians; Legare 2011 randomized 4 family medicine group practices; Lewis 2010 randomized 32 family medicine group practices; Loh 2007 randomized 30 general practitioners; McAlister 2005 randomized 102 primary care practices; Mullan 2009 randomized 40 clinicians; Nagle 2008 randomized 60 general practitioners; Solberg 2010 randomized 8 gynaecologist group practices; family‐wise randomization was used for Wakefield 2008, Wakefield 2008a, and Wakefield 2008b; and Whelan 2004 randomized 27 surgeons. For 11 studies (Allen 2010; Goel 2001; Legare 2011; Loh 2007; Mullan 2009; Nagle 2008; Solberg 2010; Wakefield 2008; Wakefield 2008a; Wakefield 2008b; Whelan 2004), the cluster effect was taken into account in the published outcome data and the meta‐analysis used published results. Although Hamann 2006 did not account for the cluster effect in the published outcome data, the way this study was reported did not allow us to include it in the meta‐analysis, and, as such, we did not re‐analyze the data and the study is reported separately. For McAlister 2005, meta‐analysis was done applying the design effect (based on the published intra‐cluster correlation coefficient (ICC)). For Legare 2003, the authors stated that for the Decisional Conflict Scale's results, “clustering had no impact on individual scores of women and, therefore, we present the results without adjustment”. The analysis in Lewis 2010 did not account for clustering.
Decision aids and comparisons
The 115 included studies evaluating decision aids focused on 46 different decisions (Table 1). The most common decisions were about prostate cancer screening (n = 15), colon cancer screening (n = 10), menopausal hormone therapy for menopausal women (n = 10), breast cancer genetic testing (n = 7), prenatal screening (n = 6), medication for atrial fibrillation (n = 3), and surgery (mastectomy breast cancer (n = 5), hysterectomy (n = 4), prostatectomy (n = 4)). New decisions included contraception (n = 2), medications for acute respiratory infection (n = 1), bariatric surgery (n = 1), long‐term feeding tube placement (n = 1), labour analgesia (n = 1), embryo transplant (n = 1), influenza immunization (n = 1), access site for coronary angiography (n = 1), screening for diabetes (n = 2) or cervical cancer (n = 1), and stress test for chest pain (n = 1).
| Study | Topic | Availability | Source | Contact Information |
| Prostate cancer screening | No | Allen,Center for Community‐Based Research, Dana‐Farber Cancer Institute, Boston, MA, US, 2010 | requested access | |
| Bariatric surgery | Yes | Informed Medical Decisions Foundation, MA,US, 2010 | informedmedicaldecisions.org/imdf_decision_aid/making‐decisions‐about‐weight‐loss‐surgery/ | |
| Prostate cancer treatment | Yes | Auvinen, Helsinki, Finland, 1993 | included in publication | |
| Benign prostate disease treatment | Yes | Informed Medical Decisions Foundation, MA,US, 2001 | informedmedicaldecisions.org/imdf_decision_aid/treatment‐options‐for‐benign‐prostatic‐hyperplasia/ | |
| Prenatal screening | Yes | Bekker, Leeds, UK, 2003 | included in publication | |
| Ischaemic heart disease treatment | Yes | Informed Medical Decisions Foundation, MA,US, 2002 | informedmedicaldecisions.org/imdf_decision_aid/treatment‐choices‐for‐carotid‐artery‐disease/ | |
| Prostate cancer treatment | No | Berry, Phyllis F. Cantor Center, MA, USA, 2011 | ||
| Antenatal Down syndrome screening | Yes | Södersjukhuset, Department of Obstetrics and Gynecology, Stockholm, Sweden | vimeo.com/34600615/ | |
| Healthcare personnel’s influenza immunization | Yes | A McCarthy. Ottawa Influenza Decision Aid Planning Group, CA, 2008 | decisionaid.ohri.ca/decaids.html#oida | |
| Hepatitis B Vaccine | No | Clancy, Richmond VA, US, 1983 | ||
| Prostate cancer treatment | No | Davison, Manitoba CA, 1992‐1996 | ||
| Total | Yes | Informed Medical Decisions Foundation, MA,US | informedmedicaldecisions.org/imdf_decision_aid/treatment‐choices‐for‐knee‐osteoarthritis/ | |
| Hormone replacement therapy | No | O'Connor, Ottawa, CA, 1996 | decisionaid.ohri.ca/decaids‐archive.html | |
| Back surgery | Yes | Informed Medical Decisions Foundation, MA,US, 2001 | informedmedicaldecisions.org/imdf_decision_aid/managing‐chronic‐low‐back‐pain/ | |
| Hormone replacement therapy | No | O'Connor, Ottawa, CA, 1996 | decisionaid.ohri.ca/decaids‐archive.html | |
| Colon cancer screening | No | Dolan, Rochester NY, US, 1999 | ||
| Prostate cancer screening | Yes | Elwyn, Cardiff, UK | www.prosdex.com | |
| Breast cancer prevention | Yes | Fagerlin, Ann Arbor, MI, US | ||
| Osteoarthritis knee treatment | No | Fraenkel, New Haven CT, US | author said DA never fully developed, all info in paper | |
| Prostate cancer screening | No | Frosch, Los Angeles, US | Screenshots from author | |
| Prostate cancer screening | Yes | Gatellari , Sydney, AU, 2003 | included in publication | |
| Prostate cancer screening | Yes | Gatellari , Sydney, AU, 2003 | included in publication | |
| Breast cancer surgery | No | Goel/Sawka, Toronto CAN, 2001 | ||
| Breast cancer genetic testing | Yes | Green, Hershey PA, US, 2000 | 1‐800‐757‐4868 [email protected] | |
| Breast cancer genetic testing | Yes | Green, Hershey PA, US, 2000 | 1‐800‐757‐4868 [email protected] | |
| Schizophrenia treatment | Yes | Hamann, Munich, GER | emailed by author (in German) | |
| Feeding options in advanced | Yes | Mitchell, Tetroe, O'Connor; 2001 (updated 2008) | decisionaid.ohri.ca/decaids.html#feedingtube | |
| Breast reconstruction | Yes | University of Texas M.D. Anderson Cancer Center, Houston TX, US, 2003 | Disc mailed | |
| Stress testing for chest pain | Yes | Hess, Rochester, MN, US, 2012 | Included in publication | |
| Prenatal screening | No | Hunter, Ottawa, CA, 2000 | decisionaid.ohri.ca/decaids‐archive.html | |
| Breast cancer treatment | Yes | Jibaja‐Weiss, Baylor College of Medicine, 2010 | www.bcm.edu/patchworkoflife | |
| Endodontic treatment | Yes | Johnson, Chicago, US, 2004 | Included in publication | |
| Multiple Sclerosis | No | Jürgen Kasper | ||
| Abnormal uterine bleeding treatment | No | Kennedy/Coulter, London UK, 1996 | ||
| Prostate cancer screening | Yes | Krist, Fairfax VA, US | www.familymedicine.vcu.edu/research/misc/psa/index.html | |
| Prenatal screening | No | Kuppermann, San Francisco CA, US | Computerized tool | |
| Vasectomy | Yes | Labrecque, Quebec City, CA, 2010 | www.vasectomie.net (in French) | |
| Cardiovascular health treatment | No | Lalonde, Ottawa, CA, 2002 | decisionaid.ohri.ca/decaids‐archive.html | |
| Contraceptive method choice | Yes | World Health Organization, 2005 | www.who.int/reproductivehealth/publications/family_planning/9241593229index/en/index.html | |
| Pre‐operative autologous blood donation | No | Laupacis, Ottawa, CA, 2001 | decisionaid.ohri.ca/decaids‐archive.html | |
| Hormone replacement therapy | No | O'Connor, Ottawa, CA, 1996 | decisionaid.ohri.ca/decaids‐archive.html | |
| Natural health products | No | Legare, Quebec City, CA, 2006 | ||
| Use of antibiotics for acute | Yes | Legare, Quebec City, CA, 2007 | www.decision.chaire.fmed.ulaval.ca/index.php?id=192&L=2 | |
| Advanced colorectal cancer chemotherapy | Yes | Princess Margaret Hospital, Toronto, 2011 | ||
| Breast cancer genetic testing | No | Lerman/Schwartz, Washington DC, US, 1997 | ||
| Prenatal screening | No | Leung, Hong Kong, China, 2001 | ||
| Colorectal cancer | Yes | Lewis, University of North Carolina, Chapel Hill, NC, USA, 2010 | decisionsupport.unc.edu/CHOICE6/ | |
| Depression treatment | Yes | Loh, Freiburg, GER | (emailed to us by author ‐ in German) | |
| Atrial fibrillation treatment | No | McAlister/Laupacis, Ottawa CA, 2000 | decisionaid.ohri.ca/decaids‐archive.html | |
| Diabetes treatment ‐ statins | Yes | Montori, Rochester MN, US | mayoresearch.mayo.edu/mayo/research/ker_unit/form.cfm | |
| Diabetes | Yes | Marteau, King's College London, London, England, 2010 | Additional file 2 of publication | |
| Diabetes | Yes | Marteau, King's College London, London, England, 2010 | Provided by author, same DA as Mann E 2010 | |
| Mammography | Yes | Mathieu, Sydney, AU, | DA emailed by author | |
| Mammography | Yes | Mathieu, University of Sydney, AUS, 2010 | http://www.psych.usyd.edu.au/cemped/com_decision_aids.shtml | |
| Atrial fibrillation treatment | No | McAlister/Laupacis, Ottawa CAN, 2000 | decisionaid.ohri.ca/decaids‐archive.html | |
| Hormone replacement therapy | Yes, update in progress | Sigler/Bastien, Durham NC, US, 1998 | ||
| Screening after mildly abnormal pap smear | Yes | Screening & test evaluation program, School of public health, University of Sydney 2007 | ||
| BRCA1/BRCA2 gene testing | No | Miller, Fox Chase PA, US | ||
| Colorectal | Yes | University of North Carolina, Chapel Hill, NC, USA, 2007 | intmedweb.wakehealth.edu/choice/choice.html (no longer available) | |
| Hypertension treatment | No | Montgomery, UK, 2000 | ||
| Birthing options after caesarean | Yes | Montgomery, Bristol, UK, last update 2004 | www.computing.dundee.ac.uk/acstaff/cjones/diamond/Information.html | |
| Osteoporosis treatment | Yes | Montori, Mayo Foundation for Medical Education and Research, 2007 | shareddecisions.mayoclinic.org/decision‐aids‐for‐diabetes/other‐decision‐aids/ | |
| Ischaemic heart disease treatment | Yes | Informed Medical Decisions Foundation, MA,US, 2002 | informedmedicaldecisions.org/imdf_decision_aid/treatment‐choices‐for‐carotid‐artery‐disease/ | |
| Diabetes treatment | Yes | Montori or Mayo Foundation?, Rochester MN, US, | included in publication | |
| Benign prostate disease treatment | Yes | Informed Medical Decisions Foundation, MA,US, 2001 | informedmedicaldecisions.org/imdf_decision_aid/treatment‐options‐for‐benign‐prostatic‐hyperplasia/ | |
| Hormone replacement therapy | No, update in progress | Informed Medical Decisions Foundation, MA,US | informedmedicaldecisions.org/imdf_decision_aid/treatment‐choices‐for‐managing‐menopause/ | |
| Prostate cancer screening | No | Myers, Philadelphia PA, US, 1999 | ||
| Prostate cancer screening | Yes | Myers, Philadelphia PA, 1999 | ||
| Prenatal screening | Yes | Nagle, Victoria, AU | www.mcri.edu.au/Downloads/PrenatalTestingDecisionAid.pdf | |
| Birth breech presentation | Yes | Nassar, West Perth WA, AU | sydney.edu.au/medicine/public‐health/shdg/resources/decision_aids.php | |
| Hormone replacement therapy | No | O'Connor, Ottawa CA, 1996 | decisionaid.ohri.ca/decaids‐archive.html | |
| Hormone replacement therapy | No | O'Connor, Ottawa CA, 1996 | decisionaid.ohri.ca/decaids‐archive.html | |
| Osteoporosis treatment | No | Cranney, Ottawa CA, 2002 | decisionaid.ohri.ca/decaids‐archive.html | |
| Breast cancer prevention | No | Ozanne, Boston MA, US, | ||
| Prostate cancer screening | Yes | Informed Medical Decisions Foundation, MA,US, 2001 | informedmedicaldecisions.org/imdf_decision_aid/deciding‐if‐the‐psa‐test‐is‐right‐for‐you/ | |
| Colon cancer screening | Yes | Pignone, Chapel Hill NC, US, 1999 | www.med.unc.edu/medicine/edusrc/colon.htm | |
| Menorrhagia treatment | No | Protheroe, Manchester, UK | computerized decision aid, Clinical Guidance Tree ‐ no longer in existence, author sent chapter in thesis | |
| Labour | Yes | Raynes‐Greenow, Sydney,Australia, 2004 | http://www.psych.usyd.edu.au/cemped/com_decision_aids.shtml | |
| Hormone replacement therapy | No | O'Connor, Ottawa CA, 1996 | decisionaid.ohri.ca/decaids‐archive.html | |
| Hormone replacement therapy | No, update in progress | Rothert, East Lansing MI, US, 1999 | ||
| Prostate cancer screening | No | Centers for Disease Control and Prevention (CDC), US, 2010 | [No longer available] | |
| Colorectal cancer screening | Yes | Regents of the University of Michigan (copyright info), Ann Arbor MI, US, 2006 | colorectalweb.org | |
| Prostate cancer screening | Yes | Schapira, Milwaukee WI, US, 1995 | ||
| Hormone replacement therapy | Yes | Schapira, Milwaukee WI, US | computer‐based DA | |
| Colorectal | Yes | Schroy III, Boston, USA | ||
| Coronary angiogram access site | Yes | Schwalm, Hamilton, ON, Canada, 2009 | http://www.phri.ca/workfiles/studies/presentations/PtDA%20Vascular%20Access%2023‐May‐2012.pdf | |
| Breast cancer genetic testing | No | Schwartz/Lerman, Washington DC, US, 1997 | ||
| BRCA mutation prophylactic surgery | No | Schwartz, Washington DC, US | ||
| Cardiovascular prevention | Yes | Sheridan, Chapel Hill, NC, US | http://www.med‐decisions.com/cvtool/ | |
| Coronary heart | Yes | Sheridan, University of North Carolina at Chapel Hill, Division of General Internal Medicine, North Carolina, US, 2011 | http://www.med‐decisions.com/h2hv3/ | |
| Birthing options after previous caesarean | Yes (updated 2006) | Shorten, Wollongong, AU, 2000 | [email protected] or www.capersbookstore.com.au/product.asp?id=301 | |
| Bowel | Yes | Smith, Sydney, AU 2008 | sydney.edu.au/medicine/public‐health/shdg/resources/decision_aids.php | |
| Uterine fibroid treatment | Yes | Informed Medical Decisions Foundation, MA,US, 2006 | informedmedicaldecisions.org/imdf_decision_aid/treatment‐choices‐for‐uterine‐fibroids/ | |
| Colorectal cancer screening | Yes | Steckelberg, Hamburg, Germany | ||
| Breast cancer surgery | No | Street, College Station TX, US, 1995 | ||
| Atrial fibrillation treatment | Yes | Thomson, Newcastle Upon Thyne, UK | disc sent by mail | |
| Ovarian cancer risk management | No | Tiller, Randwick NSW, AU | ||
| Colorectal cancer screen | Yes | Trevena, Sydney, AU | sydney.edu.au/medicine/public‐health/shdg/resources/decision_aids.php | |
| Embryos transplant | Yes | Radboud University Nijmegen Medical Centre; 2006 | www.umcn.nl/ivfda‐en | |
| Cystic Fibrosis referral transplant | Yes | Aaron, Ottawa ON, CA, 2009 (last update 2011) | decisionaid.ohri.ca/decaids.html#cfda | |
| BRCA1/2 mutation: prophylactic surgery | Yes | vanRoosmalen, Netherlands, 1999 | see publication | |
| Breast cancer surgery | Yes | Vodermaier, Vancouver BC, CA | received by email (in German) | |
| Prostate cancer screening | Yes | Informed Medical Decisions Foundation, MA,US, 1999 | informedmedicaldecisions.org/imdf_decision_aid/deciding‐if‐the‐psa‐test‐is‐right‐for‐you/ | |
| Prostate cancer screening | No | Volk, Houston TX, US | ||
| Menorrhagia treatment | No | Vuorma, Helsinki Finland, 1996 | ||
| Colorectal cancer screening | Yes | Wakefield, Sydney, AU, | www.genetics.edu.au/Information/PublicationsBrochuresandPamphlets/Understanding%20Genetic%20Tests%20for%20Lynch%20Syndrome | |
| Breast cancer genetic testing | Yes | Wakefield, Sydney, AU, | ||
| Breast cancer genetic testing | Yes | Wakefield, Sydney, AU, | ||
| Prostate cancer screening | Yes | Oxford, UK | included in publication | |
| Diabetes mellitus type 2 treatment | Yes | Montori, Rochester MN, US | mayoresearch.mayo.edu/mayo/research/ker_unit/form.cfm | |
| Breast cancer chemotherapy | Yes | Whelan, Hamilton CA, 1995 | included in publication | |
| Breast cancer surgery | Yes | Whelan, Hamilton CA, 1997 | included in publication | |
| Prostate cancer screening | Yes | Wolf, Charlottesville VA, US, 1996 | Script in publication | |
| Colon cancer screening | Yes | Wolf, Charlottesville VA, US, 2000 | Script in publication | |
| Pregnancy termination | No | Bekker, Leeds, UK, 2002 |
The decision aids used a variety of formats and were compared to a variety of control interventions (e.g., usual care, no intervention, guideline, placebo intervention). We noted the nature of usual care when reported (see table Characteristics of included studies). For this review, we have grouped control interventions and refer to them as usual care unless the intervention meets the definition of a patient decision aid.
According to the definition of a patient decision aid, all of the studies evaluated patient decision aids that included information about the options and outcomes, and provided at least implicit values clarification. Most patient decision aids included information on the clinical problem (91.3%) as well as outcome probabilities (87.8%). Fewer patient decision aids provided guidance in the steps of decision making (62.6%), explicit methods to clarify values (59.1%), and/or examples of others' experiences (50.4%) (see table Characteristics of included studies).
The comparison interventions ranged from no intervention through to usual care, and general information through to simple decision aids that varied in their number of elements. However, a simple decision aid had to meet the minimum definition of a decision aid (see table Characteristics of included studies).
Risk of bias in included studies
Details on the ratings and rationale for risk of bias are in the Characteristics of included studies table and displayed in Figure 2 and Figure 3. The risk of bias was summarized in Table 2 based on the primary outcomes.
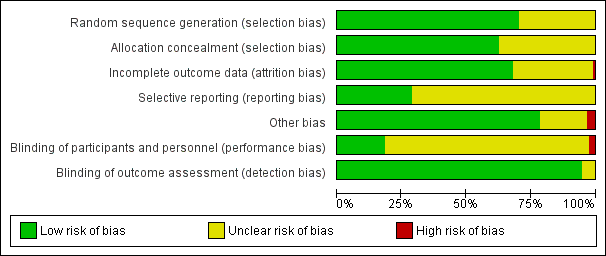
Risk of bias summary as percentages across all included studies.

Risk of bias summary for each included study.
| Outcome | Knowledge | Accurate risk perception | Value‐choice agreement | Uninformed | Unclear values | Participation ‐ practitioner controlled | |
| Total studies | n = 42 | n = 19 | n = 13 | n = 22 | n = 18 | n = 14 | |
| Random sequence generation | low | 35 (83.3%) | 8 (42.1%) | 7 (53.8%) | 19 (86.4%) | 17 (94.4%) | 12 (87.7%) |
| unclear | 7 (16.7%) | 11 (57.9%) | 6 (46.2%) | 3 (13.6%) | 1 (5.6%) | 2 (14.3%) | |
| high | 0 | 0 | 0 | 0 | 0 | 0 | |
| Allocation concealment | low | 30 (71.4%) | 12 (63.2%) | 11 (84.6%) | 20 (90.9%) | 17 (94.4%) | 10 (71.4%) |
| unclear | 12 (28.6%) | 7 (36.8%) | 2 (15.4%) | 2 (9.1%) | 1 (5.6%) | 4 (28.6%) | |
| high | 0 | 0 | 0 | 0 | 0 | 0 | |
| Incomplete outcome data | low | 26 (61.9%) | 11 (57.9%) | 11 (84.6%) | 15 (68.2%) | 13 (72.2%) | 10 (71.4%) |
| unclear | 16 (38.1%) | 8 (42.1%) | 2 (15.4%) | 7 (31.8%) | 5 (27.8%) | 4 (28.6%) | |
| high | 0 | 0 | 0 | 0 | 0 | 0 | |
| Selective reporting | low | 15 (35.7%) | 7 (36.8%) | 6 (46.2%) | 9 (40.9%) | 8 (44.4%) | 4 (28.6%) |
| unclear | 27 (64.3%) | 12 (63.2%) | 7 (53.8%) | 13 (59.1%) | 10 (55.6%) | 10 (71.4%) | |
| high | 0 | 0 | 0 | 0 | 0 | 0 | |
| Other bias | low | 34 (81.0%) | 14 (73.7%) | 11 (84.6%) | 19 (86.4%) | 17 (94.4%) | 11 (78.6%) |
| unclear | 7 (16.7%) | 5 (26.3%) | 2 (15.4%) | 3 (13.6%) | 1 (5.6%) | 3 ( 21.4%) | |
| high | 1 (2.4%) | 0 | 0 | 0 | 0 | 0 | |
| Blinding of participants and personnel | low | 9 (21.4%) | 1 (5.3%) | 2 (15.4%) | 3 (13.6%) | 2 (11.1%) | 2 (14.3%) |
| unclear | 31 (73.8%) | 17 (89.5%) | 11 (84.6%) | 18 (81.8%) | 15 (83.3%) | 9 (64.3%) | |
| high | 2 (4.8%) | 1 (5.3%) | 0 | 1 (4.5%) | 1 (5.6%) | 3 (21.4%) | |
| Blinding of outcome assessment | low | 41 (97.6%) | 19 (100%) | 13 (100%) | 22 (100%) | 18 (100%) | 13 (92.9%) |
| unclear | 1 (2.4%) | 0 | 0 | 0 | 0 | 1 (7.1%) | |
| high | 0 | 0 | 0 | 0 | 0 | 0 | |
Allocation
For assessing risk of selection bias, random sequence generation was rated as being at low risk of bias in 81 of 115 studies (70.4%) and unclear risk of bias in 34 studies (29.6%). Allocation concealment was rated as being at low risk of bias in 72 of 115 studies (62.6%) and unclear risk of bias in 43 studies (37.4%).
Blinding
Blinding of participants and personnel was rated as being at low risk of bias in 21 studies (18.3%), unclear risk of bias in 91 studies (79.1%), and high risk of bias in 3 studies (2.6%). High risk of bias was due to lack of blinding of physicians who were involved with patients randomized to both the patient decision aid and alternative interventions (Auvinen 2004; Krist 2007; Man‐Son‐Hing 1999).
Blinding of outcome assessment was low risk of bias in 109 studies (94.8%) and unclear risk of bias in 6 studies (5.2%).
Incomplete outcome data
Incomplete outcome data which could lead to attrition bias were adequately described in 78 studies (67.8%), inadequately described to judge risk of bias in 36 studies (31.3%), and for 1 study (0.9%) there was high risk of bias (Chambers 2012). In Chambers 2012, few participants in the intervention arm compared to usual care completed the study (65% versus 77%).
Selective reporting
Of 115 studies, 33 (28.7%) were rated as low risk of bias because the protocol was registered publicly and 82 (71.3%) were rated as being at unclear risk of bias for this domain.
Other potential sources of bias
Of 115 studies, 90 (78.3%) did not indicate any other potential sources of bias, 21 (18.3%) did not provide an adequate description to judge other potential sources of bias, and 4 (3.4%) discussed other potential risks of bias. Clancy 1988 describes a potential for selection bias, given that non‐randomized medical residents were added to the decision analysis group and that there was a low response rate among those offered decision analysis. In a study focused on the decision about menopausal hormone therapy for menopausal women. Rostom 2002 reported that there was a potential for bias, given that there was an uneven balance of pre‐menopausal women who were not appropriate for hormone therapy with more women in the detailed decision aid group. Hamann 2006 and Lewis 2010 did not account for clustering in the analysis.
Effects of interventions
See: Summary of findings for the main comparison
In addition to summary of findings Table for the main comparison, see the Data and analyses figures for pooled data and Additional tables 3 to 22 for outcome data that were not pooled.
A) Attributes of the choice made:
Does the patient decision aid improve the match between the chosen option and the features that matter most to the informed patient?
The randomized controlled trials (RCTs) used three measures that correspond to this definition: knowledge, accuracy of risk perceptions, and chosen option congruent with their values.
Knowledge
Seventy‐six of the 115 studies (66.1%) assessed the effects of decision aids on knowledge; 56 of these compared decision aids to usual care (74%) and 20 compared detailed decision aids to simple decision aids (26%). The studies' knowledge tests were based on information contained in the decision aid. The proportion of accurate responses was transformed to a percentage scale ranging from 0% (no correct responses) to 100% (perfectly accurate responses).
For patient decision aids compared to usual care (n = 42): people exposed to decision aids had higher average knowledge scores (MD 13.34%; 95% CI 11.17 to 15.51; Analysis 1.1). Fourteen additional studies that compared decision aids to usual care presented knowledge data that could not be included in the pooled outcome (see Table 3). Six of these studies reported statistically‐significantly higher knowledge for those exposed to the decision aid compared to usual care (Evans 2010; Hamann 2006; Nagle 2008; Partin 2004; Trevena 2008; Watson 2006).
| Study | Scale used | Timing | N Decision aid | Decision aid ‐ mean | N Comparison | Comparison ‐ mean | Notes |
| DA versus usual care | |||||||
| 12 true or false questions; scores ranging from ‐12 to +12 | immediately post | 89 | 4.9 | 103 | 2.17 | P < 0.001 | |
| 7‐item multiple choice knowledge test (unable to standardize results) | on discharge (˜ 1 month) | 49 | 15 (4.4 SD) | 58 | 10.9 (5.4 SD) | P = 0.01 | |
| 12‐item multiple choice | pre‐operatively | 66 | 14%* | 67 | 8%* | *mean increase from baseline P = 0.02 | |
| 10‐item yes/no/unsure general knowledge test about natural health products (not specific to outcomes of options) | change scores from baseline to 2 weeks | 43 | 0.86 ± 1.77 P = 0.002 | 41 | 0.51 ± 1.47 P = 0.031 | No difference between groups (P = 0.162) | |
| 14 items survey | immediately post | No difference in level of knowledge between groups | |||||
| 9 item ‐ 4 concept questions and 5 numeric questions | 351 | 357 | Significantly higher mean increase for the intervention group (2.62 ) compared to control group (0.68) from baseline, P < 0.001 | ||||
| 8 items survey | 2‐week, 2‐month, and 6‐month follow‐ups | Intervention type had no impact on general or specific knowledge | |||||
| Good level knowledge was scored higher than the mid point of the knowledge scale (greater than 4) | 88% (147/167) in DA group compared to 72% (123/171) pamphlet group. Odds ratio (3.43 95%CI 1.79 to 6.58) | ||||||
| Change in knowledge from baseline | post‐test | 15 | 48% to 64% | 15 | 45% to 57% | change in knowledge score was significant for decision aid (P = 0.01) but not control (P = 0.13) | |
| 10‐item knowledge index score | 2 weeks | 308 | 7.44 | 290 | 6.9 | P = 0.001 | |
| 24‐items adapted from existing prostate cancer knowledge measures | immediately post | 100 | 100 | the total mean standardized knowledge score was 84.38 (SD 12.38). | |||
| Adequate knowledge (positive score: understanding benefits/harms) | 1 month | 134 | 28/134 | 137 | 8/137 | P = 0.0001 | |
| 12‐item true/false/don't know | post‐test | 468 | 75% (range 0 to 100) | 522 | 25% (range 0 to 100) | P < 0.0001 | |
| 14‐item ‐ 9 addressed by decision aid; 5 were not | immediately post | 52 | 46 | Mean difference between groups 2.4 (95% CI 1.5 to 3.3) P < 0.05 (when decision aid administered during the consultation only ‐ not if prior to the consultation) | |||
| Detailed versus simple DA | |||||||
| 2 weeks | 233 | 223 | Significant improvement in knowledge with no difference between groups (entertainment decision aid or audio‐booklet) | ||||
CI: confidence interval; DA: decision aid; SD: standard deviation
One study (Weymiller 2007) reported a higher mean difference when the decision aid was administered during the consultation, but not if administered before the consultation. Mann D 2010 and Miller 2005 reported no difference between groups. Four other studies (Heller 2008; Legare 2008a; Mathieu 2007; Ozanne 2007) reported a change in knowledge from baseline: two found a statistically‐significant improvement in the decision aid group (Heller 2008; Mathieu 2007); Ozanne 2007 reported a statistically‐significant improvement in the decision aid group (P = 0.01) but not in the control group (P = 0.13); and Legare 2008a reported a statistically‐significant improvement in both the decision aid group (P = 0.002) and the control group (P = 0.031) but no difference between groups. Rubel 2010 reported knowledge scores with no comparisons. The funnel plot for knowledge as an outcome in studies comparing decision aid to usual care shows low risk for publication bias (Figure 4).
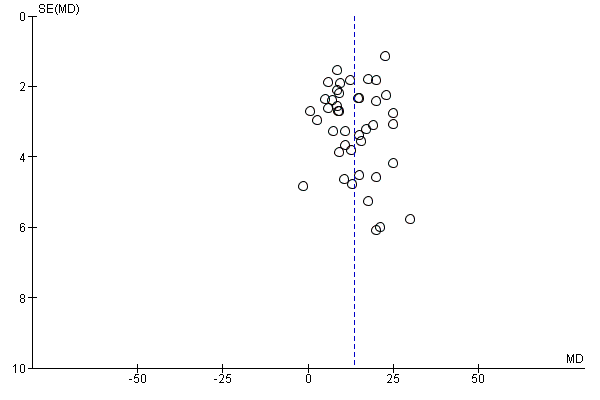
Funnel plot of comparison: 1 Knowledge, outcome: 1.1 Knowledge: DA vs usual care ‐ all studies.
For detailed compared to simple decision aids (n = 19): people exposed to detailed decision aids had higher average knowledge scores but this effect was smaller (MD 5.52%; 95% CI 3.90 to 7.15; Analysis 1.4). One additional study that compared a detailed to simple decision aid (Volk 2008) reported significant improvement in all groups from baseline but no significant differences between groups (see Table 3).
Accurate risk perceptions (i.e. perceived probabilities of outcomes)
Of 115 studies, 25 (21.7%) examined the effects of including probabilities in decision aids on the accuracy of patients' perceived probabilities of outcomes (see Analysis 2.1; Table 4). Of these 25 studies, 15 measured perceived probabilities as percentages (see Analysis 2.4), 4 gauged probabilities in words (see Analysis 2.5), and 6 were not able to be pooled (Table 4). Perceived outcome probabilities were classified according to the percentage of individuals whose judgments corresponded to the scientific evidence about the chances of an outcome for similar people. For studies that elicited risk perceptions using multiple items, the proportion of accurate risk perceptions was averaged.
| Study | Scale used | Timing | N Decision aid | Decision aid ‐ mean | N Comparison | Comparison ‐ mean | Notes |
| DA versus usual care | |||||||
| Expectation of benefit index 11 items score from 1 to 4 with lower score indicating better knowledge | post (after reviewing DA) | 127 | 2.3 | 129 | 2.6 | P = 0.001 | |
| 3 of 8 multiple choice items in the knowledge test (question 4, 5, 7) | 2 weeks post | total knowledge reported only | |||||
| 5 item numerical questions (max = 5) | post | 113 | 3.02 | 189 | 2.45 | P < 0.001 | |
| 2‐week, 2‐month, and 6‐month follow‐ups | Intervention type had no impact on risk perceptions | ||||||
| 8 numerical questions (max = 8) | 357 | 2.93 (SD 2.91) | 173 | 0.58 (SD1.28) | P < 0.001 | ||
| immediately | 52 | 46 | Difference between group OR 22.4 (95% CI 5.9 to 85.8) when decision aid administered during the consultation only (not if prior to) OR 6.7 (95% CI 2.2 to 19.7) when the decision aid administered prior to or during the consultation | ||||
CI: confidence interval; DA: decision aid; OR: odds ratio; SD: standard deviation
People who received a patient decision aid with descriptions of outcome probabilities were more likely to have accurate risk perceptions than those who did not receive this information; the pooled relative risk (RR) of having accurate risk perceptions was 1.82 (95% CI 1.52 to 2.16, n = 19; Analysis 2.1). The pooled RR for probabilities measured as numbers was 2.00 (95% CI 1.65 to 2.43, n = 15; Analysis 2.4) and the pooled RR for probabilities gauged in words was 1.31 (95% CI 1.13 to 1.52, n = 4; Analysis 2.5). Six studies reported results that could not be pooled (see Table 4). Hanson 2011; Mathieu 2010; and Smith 2010 reported a statistically‐significant improvement in accurate perceptions of outcomes for the decision aid group compared to usual care, and Miller 2005 reported no impact on risk perception. In another study, Weymiller 2007 reported a statistically‐significant difference in the accurate perception of baseline risks in the group receiving a decision aid with probabilities compared to the usual care group, when the decision aid was administered during the consultation but not when it was administered before the consultation. The difference in accurate estimations of the potential absolute risk reduction with statin drugs was also statistically significant between the decision aid and usual care groups, and this difference remained significant regardless of the timing of delivery. Although three of eight knowledge test items measured accurate risk perceptions (Mann E 2010), results were presented for total knowledge and not individual items.The funnel plot for accurate risk perception as an outcome in studies comparing decision aid to usual care shows low risk for publication bias (Figure 5).

Funnel plot of comparison: 2 Accurate risk perceptions: Decision aid with outcome probabilities vs no outcome probability information, outcome: 2.1 Accurate risk perceptions ‐ all studies.
Chosen option congruent with values
Of 115 studies, 20 (17.4%) measured congruence between with the chosen option and their values; however, 7 did not present quantitative data to permit pooling across studies (Arterburn 2011; Frosch 2008; Legare 2008a; Lerman 1997; Rothert 1997; Solberg 2010; Vandemheen 2009; see Table 5).
| Study | Scale used | Timing | N Decision aid | Decision aid ‐ mean | N Comparison | Comparison ‐ mean | Notes |
| DA versus usual care | |||||||
| Percent match procedures described by Sepucha et al (2007; 2008). For values items were most predictive and used to specify logistic models to estimate predicted probability of selecting surgery > 0.5. | post intervention | 75 | 77 | The intervention group experienced a more rapid early improvement in value concordance immediately after the intervention compared to control, see Figure 2. | |||
| Concordance between patient's preferences and values for potential outcomes related to the decision and the choice made | within weeks | 155 | 151 | Men assigned to the decision aid who chose not to have a PSA test rated their concern about prostate cancer lower than did men who requested a PSA test. Men assigned to usual care provided similar ratings of concern about prostate cancer regardless of their PSA decision. There was no statistically significant difference between groups. | |||
| Women valuing of non chemical aspect of nature health products was positively associated with their choice of nature health products, P = 0.006. | |||||||
| Association between values and choice | ‐‐‐‐‐‐ | ‐‐‐‐‐‐ | ‐‐‐‐‐‐ | ‐‐‐‐‐‐ | ‐‐‐‐‐‐ | No difference; between group differences were not reported | |
| Congruence between personal values and decision | 3 weeks | 70 | 70 | Patient choices were consistent with their values across both randomised groups | |||
| Detailed versus simple DA | |||||||
| Correlation between expected utilities and their likelihood of taking hormones | ‐‐‐‐‐‐ | ‐‐‐‐‐‐ | ‐‐‐‐‐‐ | ‐‐‐‐‐‐ | ‐‐‐‐‐‐ | Simple DA showed lower correlations between expected value of hormones and likelihood of taking hormones than did more detailed DA | |
| My decision was consistent with my personal values. (Likert Scale, ranged from 1‐5) | 4‐5 weeks after intervention | 103 | 87.5 (SD 20) | 112 | 80 (SD 22.5) | P < 0.01 | |
| multi‐nomial logistic regression analysis | No significant difference between groups | ||||||
DA: decision aid; SD: standard deviation
Nine of these studies used the Multi‐Dimensional Measure of Informed Choice (Bjorklund 2012; Mathieu 2007; Mathieu 2010; Nagle 2008; Smith 2010; Trevena 2008; Wakefield 2008; Wakefield 2008a; Wakefield 2008b), which assesses the extent to which the choice is based on relevant knowledge, is consistent with a person's values/attitudes, and is behaviorally implemented (Michie 2002). These studies operationalized the measure in terms of knowledge test scores higher than the mid‐point, attitude scale scores higher than the mid‐point, and choice being congruent with attitude.
People who received a patient decision aid with an explicit values clarification exercise were more likely to achieve a chosen option congruent with their values: the pooled RR was 1.51 (95% CI 1.17 to 1.96, n = 13; Analysis 3.1). A sub‐analysis of studies using the Multi‐Dimensional Measure of Informed Choice revealed a pooled RR of 1.35 (95% CI 1.12 to 1.61, n = 9). Of the seven studies that were not pooled, Arterburn 2011 reported that, compared to the control group, those exposed to the decision aid experienced a more rapid early improvement of value concordance immediately after exposure. Legare 2008a reported that women's valuing of the non‐chemical aspect of natural health products was positively associated with their choice of natural health products in managing menopausal symptoms (P = 0.006). Rothert 1997 reported higher correlations between the expected value of hormones and the likelihood of taking hormones in women exposed to the detailed decision aid compared those exposed to the simple decision aid. No differences between groups were reported in the other studies (Frosch 2008; Lerman 1997; Solberg 2010; Vandemheen 2009; see Table 5). However, Frosch 2008 observed that men exposed to the decision aid who chose not to have a prostate‐specific antigen (PSA) test rated their concern about prostate cancer lower than men who requested a PSA test, while men assigned to the usual care group provided similar ratings of concern regardless of their PSA choice. The funnel plot for congruence between the chosen option and their values as an outcome in studies comparing decision aid to usual care shows low risk for publication bias (Figure 6).

Funnel plot of comparison: 3 Values congruent with chosen option, outcome: 3.1 Values congruent with chosen option ‐ all studies.
B) Attributes of the decision process:
Does the patient decision aid help patients to: recognize that a decision needs to be made; know the options and their features; understand that values affect the decision; be clear about the option features that matter most; discuss values with their practitioner; and become involved in their preferred ways?
In relation to the International Patient Decision Aids Standards (IPDAS) decision process criteria, no studies evaluated the extent to which patient decision aids helped patients to recognize that a decision needs to be made or understand that values affect the decision.
Some studies measured patients' self‐reports about feeling informed and clear about personal values. The measures used to evaluate these two criteria were two sub‐scales of the previously validated Decisional Conflict Scale (DCS) (O'Connor 1995).
Decisional conflict
Of 115 studies, 58 (50.4%) evaluated overall decisional conflict using the DCS (O'Connor 1995). The DCS is reliable, discriminates between those who make or delay decisions, is sensitive to change, and discriminates between different decision support interventions (Morgan 2000; O'Connor 1995; O'Connor 1998a). The scale measures the constructs of overall decisional conflict and the particular factors contributing to uncertainty (e.g., feeling uncertain, uninformed, unclear about values, and unsupported in decision making). A final sub‐scale measures perceived effective decision making. The scores were standardized to range from 0 (no decisional conflict) to 100 points (extreme decisional conflict). Scores of 25 or lower are associated with follow‐through with decisions, whereas scores that exceed 38 are associated with delay in decision making (O'Connor 1998a). When decision aids are compared to usual care, a negative score indicates a reduction in decisional conflict, which is in favour of the decision aid.
Analysis 4.1.6 summarizes the decisional conflict results for the 28 studies that compared decision aids to usual care, and Analysis 4.4.6 summarizes the results for the 17 studies that compared detailed to simple decision aids. Fifteen studies that were not able to be pooled are reported in Table 6 and Table 7.
| Study | Scale used | Timing | N Decision aid | Decision aid ‐ mean | N Comparison | Comparison ‐ mean | Notes |
| DA versus usual care | |||||||
| Total Decisional Conflict‐ change from baseline (standardised values) | immediately post | 75 | mean (‐20) SD (19.44) | 77 | mean (‐11.8) SD (22.83) | P = 0.03 | |
| Decisional conflict scale | uncertainty | ‐3.61 units | P = 0.04 | ||||
| uninformed | No significant difference | ||||||
| unclear values | ‐3.57 units | P = 0.002 | |||||
| unsupported | No significant difference | ||||||
| Ineffective decision | No significant difference | ||||||
| total | ‐1.75 units | P = 0.07 | |||||
| Decisional conflict scale | immediately post | DCS was higher in the intervention group compared to control, P < 0.001. | |||||
| Decisional conflict ‐ sub‐scales only | Feeling uninformed | 155 | 23.37 | 151 | 29.68 | P < 0.05 | |
| Feeling unclear values | 155 | 32.25 | 151 | 37.93 | P < 0.05 | ||
| Feeling supported | 155 | 30.51 | 151 | 35.21 | P < 0.05 | ||
| Feeling uncertain | 155 | 151 | No difference | ||||
| Effective decisions | 155 | 151 | No difference | ||||
| Decisional conflict | immediately after office visit | 196 | 1.54 | 75 | 1.58 | No difference | |
| Decisional conflict scale median (range) | 1‐2 weeks post intervention | 107 | 26 (range 0‐79) | 100 | 26 (range 0‐67) | No difference | |
| Based on approaches suggested by Marteau et al. (informed choice) | immediately after intervention | 91 | 71% | 110 | 64% | P = 0.24 | |
| Decisional conflict | post consultation | 15 | 15 | Both groups showed lower decisional conflict post‐consultation (P < 0.001) but no difference between groups | |||
| Decisional conflict | immediately post | The total mean score was 24.5 with a SD of 15.25 (n=200) | |||||
| Decisional conflict | 12 of 16 items of the original scale | Significant longitudinal impact of the decision aid was moderated by baseline decision status; decision aid led to significant decreases in decisional conflict for those who were undecided at the time of randomisation | |||||
| Decisional conflict | post consultation | 53 | 56 | Difference between decision aid and control group were ‐0.18 (95% CI ‐0.34 to ‐0.01). P = 0.036 | |||
| 3‐months post | 51 | 55 | Difference between decision aid and control group were ‐0.15 (95% CI ‐0.37 to 0.06), no significant difference. | ||||
| 15 item questionnaire (1‐5) ‐ satisfaction‐uncertainty | post intervention, pre IVF | 124 | 72.5 | 128 | 75 | P = 0.76 | |
| 15 item questionnaire (1‐5) ‐ informed (includes some items from DCS). | post intervention, pre IVF | 124 | 77.5 | 128 | 87.5 | P = 0.001 | |
| Decisional conflict | immediately post | 52 | 46 | Mean difference indicates statistically significantly lower decisional conflict for decision aid compared to usual care. Total DCS ‐10.6 (‐15.4 to ‐5.9) Uncertain ‐12.8 (‐18.4 to ‐7.3) Informed ‐17.3 (‐22.6 to ‐12.0) if administered during consult ‐6.6 (‐14.3 to ‐1.1) if administered prior to consult Values clarity ‐8.5 (‐15.7 to ‐1.3) Support ‐9.4 (‐14.8 to ‐3.9) Effective decision ‐10.0 (‐15.0 to ‐5.0) | |||
CI: confidence interval; DA: decision aid; DCS: decisional conflict scale; IVF: in vitro fertilisation; SD: standard deviation
| Study | Scale used | Timing | N Decision aid | Decision aid ‐ mean | N Comparison | Comparison ‐ mean | Notes |
| DA versus usual care | |||||||
| Total DCS | 2 week follow‐up | 357 | 13.63 (SD 20.55) | 173 | 14.91(SD 18.34) | P = 0.02 | |
| Detailed versus simple DA | |||||||
| Uncertainty | 2 weeks | 39 | 5.8 (SD 18.0) | 48 | 6.8 (SD 18.0) | P = 0.80 | |
| Informed | 2 weeks | 39 | 9.1 (SD 26.0) | 46 | 18.8 (SD 26.1) | P = 0.09 | |
| Values | 2 weeks | 40 | 17.4 (SD 36.8) | 48 | 34.9 (SD 36.6) | P = 0.03 | |
| Social Support | 2 weeks | 39 | 17.8 (SD 29.6) | 48 | 27.6 (SD 29.5) | P = 0.12 | |
| Total DCS | 2 weeks | 38 | 12.0 (SD 21.9) | 46 | 21.7 (SD 21.8) | P = 0.04 | |
DA: decision aid; DCS: decisional conflict scale; SD: standard deviation
The overall MD was ‐6.22 out of 100 points for decision aid compared to usual care (95% CI ‐8.00 to ‐4.44; see Analysis 4.1.6) and ‐1.77 for detailed compared to simple decision aid (95% CI ‐2.64 to ‐0.91; see Analysis 4.4.6). Three studies that could not be pooled (Table 6) reported statistically‐significantly less total decisional conflict (Arterburn 2011; Schwartz 2009; Weymiller 2007), three no difference (Krist 2007; Leighl 2011; Ozanne 2007), and one higher decisional conflict (Fagerlin 2011). Smith 2010 used the low literacy version and reported statistically‐significant improvement in total decisional conflict in the decision aid group, compared to usual care (Table 7). Rubel 2010 did not report results by group.
The 'feeling uninformed' sub‐scale of the DCS was reported in 32 studies. Because this DCS sub‐scale measures self‐reported comfort with knowledge and not actual knowledge, we elected to consider it a process measure and to reserve the gold standard of objective knowledge tests for assessing decision quality. The MD for 'feeling uninformed' about options, benefits, and harms was ‐7.26 (95% CI ‐9.73 to ‐4.78) in the 22 studies that compared patient decision aids to usual care (see Analysis 4.1.2). The 10 studies that compared detailed with simple patient decision aids had a MD for 'feeling uninformed' of ‐2.39 (95% CI ‐4.39 to ‐0.39; Analysis 4.4.2). For the studies that could not be pooled (Table 6), compared to usual care, those exposed to the decision aid felt more informed in three studies (Frosch 2008; Mathieu 2010; Weymiller 2007) but were no different in one study (Berry 2013).The funnel plot for feeling uninformed as an outcome in studies comparing decision aid to usual care shows low risk for publication bias (Figure 7).
Funnel plot of comparison: 4.1 Decisional conflict: DA vs usual care ‐ all studies, outcome: 4.1.2 Uninformed sub‐scale
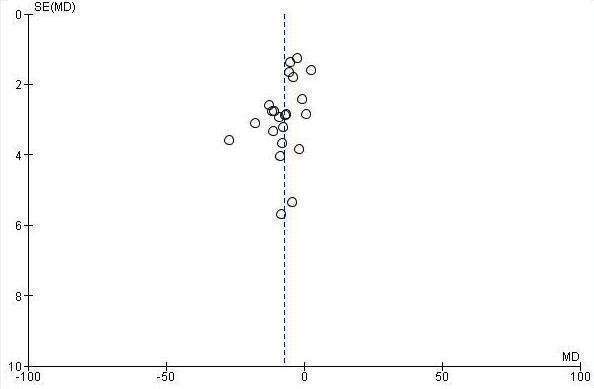
The 'feeling unclear about values' sub‐scale of the DCS was reported in 18 studies comparing patient decision aids to usual care (MD ‐6.09; 95% CI ‐8.50 to ‐3.67; see Analysis 4.1.3). In the 10 studies that compared detailed to simple decision aids, the MD for 'feeling unclear about values' was ‐2.31 (95% CI ‐4.67 to ‐0.05; see Analysis 4.4.3) Compared to usual care, those exposed to the decision aid in all three studies that could not be pooled (Table 6) felt more clear about their values (Berry 2013; Frosch 2008; Weymiller 2007).The funnel plot for feeling unclear about values as an outcome in studies comparing decision aid to usual care shows low risk for publication bias (Figure 8).

Funnel plot of comparison: 4.1 Decisional conflict: DA vs usual care ‐ all studies, outcome: 4.1.3 Unclear sub‐scale
Volk 2008 compared detailed to simple decision aids and showed improvements in decisional conflict only in lower literacy sub‐groups of participants. For example, low literacy study participants used the low literacy version of the DCS and their results were reported separately from participants at the higher literacy site. The lower literacy study participants exposed to the more detailed edutainment decision aid reported significantly lower levels of overall decisional conflict and higher levels of 'feeling clear about values', compared to the lower literacy study participants exposed to the simpler audio‐booklet decision aid (see Table 7).
Patient‐practitioner communication
Of 115 studies, 9 (7.8%) measured the effect of decision aids on patient‐practitioner communication. Four studies (Hess 2012; Montori 2011; Mullan 2009; Weymiller 2007) compared the effect of a decision aid used within the clinical encounter (or, in one study, half the decision aid participants were exposed just prior to the encounter) to usual care, and evaluated the extent of shared decision making by analysing the audio‐recordings using the OPTION scale. All four studies reported statistically‐higher mean OPTION scores when patients were exposed to the decision aid, and this effect was greater when the decision aid was used within the clinical encounter (see Table 8).
| Study | Scale used | Timing | N Decision aid | Decision aid ‐ mean | N Comparison | Comparison ‐ mean | Notes |
| DA versus usual care | |||||||
| Discussed feeding with physician, nurse practitioner, or physician's assistant | 3 months | 126 | 46% | 127 | 33% | P = 0.04 | |
| Discussed feeding with other nursing home staff | 3 months | 126 | 64% | 127 | 71% | P = 0.42 | |
| OPTION scale | analysis of the consultation using video‐recorded consultations | 101 | Mean of 26.6 (95% CI 24.9 to 8.2) | 103 | Mean of 7% (95%CI 5.9 to 8.1) | Significantly greater in the intervention arm | |
| DCS / Dolan's Provider DCS | immediately post | Difference 0.26 (95%CI ‐0.06 to 0.53, P = 0.06) | |||||
| OPTION 100 point Scale | analysis of the consultation using video‐recorded consultations | 38 | 49.8 | 32 | 27.3 | P < 0.001 | |
| OPTION Scale | analysis of the consultation using video‐recorded consultations | 48 used decision aid within consultation | 49.7% (SD 17.74) | 37 usual care | 27.7% (SD 11.75 | MD 21.8 (95% CI 13.0, 30.5) for decision aid vs usual care. All but 2 of the 12 items significantly | |
| Discussed CHD with doctor | patient reported immediately post | 16/41 decision aid pre‐consult with summary report to bring to consult |
| 8/34 usual care |
| absolute difference 16%; 95% CI | |
| Plan to reduce CHD risk & discussed with doctor | patient reported immediately post | 15/41 decision aid pre‐consult with summary report to bring to consult |
| 8/34 usual care |
| absolute difference 13%; 95% CI ‐7% to 34%). | |
| Plan to reduce CHD risk & not discussed with doctor | patient reported immediately post | 37/41 decision aid pre‐consult with summary report to bring to consult |
| 25/34 usual care | absolute difference 16%; 95% CI | ||
| OPTION Scale | analysis of the consultation using video‐recorded consultations | 1/2 used decision aid prior to consult and 1/2 used it during consult | usual care | Greater patient participation (MD 4.4; 95% CI 2.9 to 6.0) in decision aid compared to usual care | |||
| Detailed versus simple DA | |||||||
| Agreement between women’s and physicians’ decisional conflict scores | immediately post | 87 | ICC = 0.44 (95% CI 0.25 to 0.59) | 80 | ICC = 0.28 (95% CI 0.06 to 0.47) | Agreement measure was higher for the DA group. | |
| DCS / Dolan's Provider Decision Process Assessment Instrument | immediately post | 97 detailed decision aid pre consult | ICC 0.44 (0.9 SD) | 87 simple decision aid pre consult | ICC 0.28 (1.0 SD) | Agreement measure was higher for the DA group (ICC 0.44; 95% CI 0.25 to 0.59) than for the pamphlet group (ICC 0.28; 95% CI 0.06 to 0.47) | |
| Informed decision making | analysis of the physician–patient encounter using audio‐recordings | 3.0 items | 2.4 items | RR 1.30 (CI 1.03 to 1.64) P = 0.029 | |||
CHD: coronary heart disease; CI: confidence interval; DA: decision aid; DCS: decisional conflict scale; ICC: intraclass correlation coefficient; OPTION scale: observing patient involvement scale; RR: risk ratio; SD: standard deviation
Myers 2011 analyzed audio‐recorded encounters using the Informed Decision Making observer instrument (Braddock III 1997; Braddock III 1999; Price 2012). Findings reported significantly higher scores in the detailed decision aid group compared to simple decision aid (P = 0.029).
For agreement between physicians and women on decisional conflict scores as an indicator of communication about the decision within the consultation, Legare 2003 reported higher agreement for the decision aid group than for the usual care group, but Legare 2011 reported no statistically‐significant difference between groups (see Table 8).
Sheridan 2006 and Hanson 2011 found that, of those exposed to the decision aid, a higher proportion compared to usual care reported having discussed the decision with their practitioner (see Table 8)
Participation in decision making
Of 115 studies, 22 (19.1%) measured the effect of decision aids on patient participation in decision making: of these, 20 compared the effects of decision aids to usual care (Analysis 5.1; Table 9) and 2 (Deschamps 2004; Raynes‐Greenow 2010) compared a detailed decision aid to a simple one (Analysis 5.4). The Davison 1997 paper used the Control Preferences Scale (Degner 1992). This scale measures the role in decision making using five response statements: two represent an active or patient‐controlled role, one a shared or collaborative role, and two response statements represent a passive or practitioner‐controlled role. Most other studies used comparable response statements that could be classified within each of the three groupings of the Control Preferences Scale, except for Hamann 2006 which used the COMRADE instrument to measure patient perception of involvement, and two others that used other measures of perceived involvement (Hanson 2011; Loh 2007) (see Table 9).
| Study | Scale used | Timing | N Decision aid | Decision aid ‐ mean | N Comparison | Comparison ‐ mean | Notes |
| DA versus usual care | |||||||
| control preferences ‐ patients choosing active/ collaborative decision making | post intervention | 291 | 95% | 334 | 92% | No difference | |
| control preferences did not change | post intervention | 291 | 92% | 334 | 87% | No difference | |
| control preferences changed to passive | post intervention | 291 | 3% | 334 | 5% | No difference | |
| control preferences changed to active/ collaborative | post intervention | 291 | 3% | 334 | 7% | No difference | |
| COMRADE used to measure patients' perceived involvement in decisions | post‐consultation | 49 | 79.5 (SD 18.6) 76.8 (SD 20.9) | 58 | 69.7 (SD 20.0) 73.5 (SD 19.3) | increased patient involvement in decision aid group post intervention compared to usual care at baseline. At discharge there was no difference between groups. | |
| surrogates feeling somewhat or very involved in decision making | post intervention | 83% | 77% | P = 0.18 | |||
| achieved decision involvement | post intervention | 32% | 35% | No difference | |||
| patients' perceived involvement in decision making | post‐consultation | 191 | 26.3 pre 28.0 post | 96 | 24.5 pre 25.5 post | Improved patient participation from baseline to post exposure to the decision aid (P = 0.010) and in comparison to the usual care group (P = 0.003) but there was no change in the control group for the pre‐post comparison | |
| adapted from the Control Preferences Scale | post‐intervention | the total mean scores were: 2.74±1.25 (n=99) pre and 2.83±1.16 (n=199) post, no statistically significant difference. | |||||
| Decision Evaluation scale (15 item questionnaire) Decision control subscale | post‐consultation | 124 | 85 | 128 | 87.5 | P = 0.33 | |
DA: decision aid; SD: standard deviation
For patients assuming an active (patient‐controlled) role in decision making, the pooled RR for 12 studies compared decision aid to usual care was 1.28 (95% CI 1.02 to 1.60; Analysis 5.1.1). The proportion adopting a shared decision‐making role in 12 studies showed no difference between decision aid and usual care (decision aid versus usual care pooled RR 0.96; 95% CI 0.82 to 1.13; Analysis 5.1.2). Given that patient decision aids are hypothesized to increase patient participation in decision making, there was a reduction in practitioner‐controlled decision making; the pooled RR based on 14 studies comparing decision aids to usual care was 0.66 (95% CI 0.53 to 0.81; Analysis 5.1.3). For studies that could not be pooled, Allen 2010, Leighl 2011, Rubel 2010, and van Peperstraten 2010 reported no difference in these roles between groups.
For studies that could not be pooled in which a decision aid was compared to usual care, Loh 2007 and Hamann 2006 reported that a statistically‐significant proportion of patients exposed to the decision aid described feeling involved in decision making. However, Hamann 2006 did not analyze findings accounting for cluster. Hanson 2011 reported that a higher proportion described feeling involved (83% vs 77%) but that the difference between groups was not statistically significant (Table 9).
There was no statistically‐significant difference in patient participation in decision making for the two studies that compared a detailed decision aid to a simple one (Deschamps 2004; Raynes‐Greenow 2010) (see Analysis 5.4)
Proportion undecided
Of 115 studies, 21 (18.3%) measured the proportion remaining undecided: of these, 18 pooled studies compared decision aids to usual care, 3 pooled studies compared detailed to simple decision aids, and 1 not able to be pooled compared decision aid to usual care. For 18 studies comparing decision aids to usual care, a statistically‐significantly lower proportion of people remained undecided after exposure to a decision aid (RR 0.59; 95% CI 0.47 to 0.72; Analysis 6.1 ).
None of the studies (Deschamps 2004; Labrecque 2010; Leung 2004) comparing detailed to simple decision aids showed a statistically‐significant difference between groups (pooled RR 0.98; 95% CI 0.69 to 1.37; Analysis 6.4).
Kasper 2008 measured progress in decision making using a single item ranging from '0 = completely undecided' to '100 = made my decision'. Given the different measure used, these findings were not included in the meta‐analysis. In this study, both the patients exposed to a decision aid and the usual care group progressed in their decision making, with no difference between groups (Table 10).
| Study | Scale used | Timing | N Decision aid | Decision aid ‐ mean | N Comparison | Comparison ‐ mean | Notes |
| DA versus usual care | |||||||
| single item ‐ ranging from '0 = completely undecided' to '100 = made my decision' | No difference | ||||||
DA: decision aid
Satisfaction
Satisfaction was measured as it relates to satisfaction with the choice, satisfaction with the process of decision making, and preparation for decision making. Satisfaction with preparation for decision making was measured in three studies using the Preparation for Decision Making Scale (Bennett 2010). When possible, the scores were standardized to a 0‐to‐100 point scale, with higher scores reflecting greater satisfaction.
Of 115 studies, 20 (17.4%) measured satisfaction with the choice: 15 compared decision aids to usual care and 5 compared detailed to simple decision aids. Of these 15 studies, 3 (Heller 2008; Laupacis 2006; Montgomery 2007) reported that people exposed to the decision aid had higher satisfaction with their choice compared to usual care, and the other 12 reported no statistically‐significant difference (see Analysis 7.1 and Table 11). Of the five studies that compared detailed to simple decision aids, four found no across‐group differences in satisfaction with the choice (Deschamps 2004; Raynes‐Greenow 2010; Rothert 1997; Schapira 2007), and one reported higher satisfaction with the choice after using the detailed decision aid (Solberg 2010) (Analysis 7.4 and Table 11).
| Study | Scale used | Timing | N Decision aid | Decision aid ‐ mean | N Comparison | Comparison ‐ mean | Notes |
| DA versus usual care | |||||||
| 1‐item; pleased with treatment choice | 1 month post‐surgery | 62/66 | 55/67 | P = 0.03 | |||
| satisfaction with decision scale: median (range) | 1 month post intervention | 107 | 22(13‐25) | 100 | 21(15‐25) | No difference | |
| 7‐point scale: ranging from 1‐7 | 4 weeks | 91.17 (14) | 91.33(14.50) | No difference | |||
| 6‐item | 1, 6, 12 months | 100 | 114 | Overall, no difference between groups; decision aid led to significantly increased satisfaction compared to US among those who were undecided at randomisation but not among those who had made a decision before randomisation; (only graph in paper with no raw data) | |||
| satisfaction with the decision | immediately post | 134 | 137 | No difference (P = 0.56) | |||
| Detailed versus simple DA | |||||||
| 6‐item scale (measured on 1 to 5) | 1 day | 83 | 4.0 (0.56) | 89 | 3.8 (0.66) | No difference | |
| 6 months | 63 | 3.8 (0.63) | 75 | 3.8 (0.67) | No difference | ||
| 12 months | 62 | 3.9 (0.62) | 74 | 3.9 (0.67) | No difference | ||
| 6‐item scale | 3 months | No difference | |||||
DA: decision aid
Of 115 studies, 17 (14.8%) measured satisfaction with the decision‐making process: 14 compared decision aids to usual care and 3 compared detailed to simple decision aids. Of 14 comparing decision aids to usual care, 10 measured satisfaction with the decision‐making process (see Analysis 7.6; Hess 2012; Kennedy 2002; Montori 2011; Vodermaier 2009 in Table 12), 3 measured satisfaction with information received (Laupacis 2006; Miller 2005; Oakley 2006) and 1 (Green 2004) measured satisfaction with genetic counselling. Of the 14 studies, 5 showed statistically‐significant improvement in satisfaction with the decision‐making process (Barry 1997; Hess 2012; Kennedy 2002; Laupacis 2006; Schroy 2011) and with information provided (Laupacis 2006) when patient decision aids were used compared to usual care, and 9 showed no difference (Bernstein 1998; Green 2004; Jibaja‐Weiss 2011; Man‐Son‐Hing 1999; Miller 2005; Montori 2011; Morgan 2000; Oakley 2006; Vodermaier 2009) (see Analysis 7.6; Table 12). No studies reported that those exposed to patient decision aids were statistically‐significantly less satisfied compared to usual care. Although there was no difference in satisfaction with the information between patients in the Montori 2011 study, clinicians had higher satisfaction.
| Study | Scale used | Timing | N Decision aid | Decision aid ‐ mean | N Comparison | Comparison ‐ mean | Notes |
| DA versus usual care | |||||||
| Effectiveness of consultation ‐ patient assessment. Single item 1 (not at all effective) to 7 (extremely effective) | 106 | 6.6 | 105 | 6.6 | No difference | ||
| Effectiveness of consultation ‐ counsellor assessment. Single item 1 to 7 | 5.9 | 5.8 | No difference | ||||
| Satisfaction with decision process (0 for strongly agree to 5 for strongly disagree) | 101 | 103 | Patients in DA group reported greater satisfaction with the DM process (strongly agree, 61% DA vs 40% usual care) | ||||
| Measured satisfaction with opportunities to participate in decision making using a single item | Compared to usual care, women who received the decision aid followed by nurse coaching were statistically significantly more satisfied with the opportunities to participate in decision making (OR 1.5; 95% CI 1.1 to 2.0). | ||||||
| Satisfaction with information received sub‐scale 4‐item (0 to 100; low to high) | average 10 days | 54 | 76 (15.5 SD) | 56 | 59 (23.3 SD) | P = 0.001 | |
| Satisfaction with practitioner treatment during decision process sub‐scale 4‐item (0 to 100; low to high) | average 10 days | 54 | 69 (25.3 SD) | 56 | 54 (26.7 SD) | P = 0.004 | |
| Satisfaction with cancer information service 1‐item (1 to 5; low to high) | 2 weeks | 4.37 (0.84 SD) | 4.38 (0.86 SD) | No difference | |||
| 6 months | 4.51 (0.75 SD) | 4.51 (0.64 SD) | No difference | ||||
| (7 point scales) Participants' satisfaction with knowledge transfer ‐amount of information ‐clarity of information ‐helpfulness of the information ‐would want other decisions ‐recommend to others | post intervention | 49 | 6.6 6 6 6.1 6.4 | 46 | 6.3 6 5.8 5.8 6.2 | P = 0.798 P = 0.296 P = 0.624 P = 0.248 P = 0.435 | |
| Clinicians' satisfaction with knowledge transfer ‐helpfulness of the information ‐would want other decisions ‐recommend to others | post intervention | 39 | 5.8 6.1 5.9 | 33 | 5.2 4.9 4.8 | P = 0.006 P < 0.001 P < 0.001 | |
| Satisfaction with information about medicines | 4 months post | 16 | 10.4 (SD 2.9) | 17 | 10.1 (SD 2.2) | No difference | |
| ‐ physician helped me understand ‐ physician understood important to me ‐ physician answered questions ‐ satisfied with involvement ‐ satisfied with physician's involvement ‐ satisfied with process | 1 week follow‐up | 53 | 49 (92.5%) 47 47 44 36 42 | 56 | 53 (94.6%) 50 51 45 36 50 | High satisfaction with no difference by group | |
| Detailed versus simple DA | |||||||
| Satisfaction with decision making process 7‐item scale (5‐point response) | 3 months | 171 | separate responses provided with no total | 172 | separate responses provided with no total | No difference except DA more likely to report they had as much information as they wanted and less likely to report having relied too much on physician's opinion | |
| Satisfaction with genetic counselling 11‐item short form (range 4 to 44; low to high) | immediately post | 116 | 37.27 (5.74 SD) | 126 | 40.48 (4.26 SD) | P < 0.001 higher satisfaction with individual counselling compared to decision aid | |
| Satisfaction with involvement in decision making (3 questions) | 26 to 30 weeks gestation | 244 | 44.8 44.3 72.6 | 252 | 49.2 48.1 79.9 | P = 0.40 P = 0.45 P = 0.10 | |
DA: decision aid; SD: standard deviation
Of three studies comparing detailed and simple decision aids, Deyo 2000 measured satisfaction with the decision‐making process, Kuppermann 2009 measured satisfaction with involvement in decision making, and Hunter 2005 measured satisfaction with genetic counselling (see Table 12). Hunter 2005 reported higher satisfaction among those exposed to genetic counselling compared to decision aid alone, and the other two studies reported no difference between groups.
Of 115 studies, 3 (2.6%) measured preparation for decision making (Table 13). Compared to usual care, two studies reported significant improvements in people's satisfaction with their preparation for making decisions after using decision aids about management of knee osteoarthritis (Fraenkel 2007) or referral to a lung transplant centre (Vandemheen 2009) (see Table 13). The third study (Deschamps 2004) found no statistically‐significant difference between those exposed to the detailed or simple decision aid.
| Study | Scale used | Timing | N Decision aid | Decision aid ‐ mean | N Comparison | Comparison ‐ mean | Notes |
| DA versus usual care | |||||||
| Preparation for Decision Making Scale | Pre‐consultation | 43 | 35 (median) | 40 | 20.5 (median) | P = 0.0001 | |
| Preparation for Decision Making Scale | 3 weeks | 70 | 65.1 (24.9 SD) | 79 | 53.9 (27.1 SD) | P = 0.009 | |
| Detailed versus simple DA | |||||||
| Preparation for Decision Making Scale | Post‐physician consultation | 48 | 28 (6.1 SD) | 42 | 27(5.5 SD) | No difference | |
DA: decision aid; SD: standard deviation
Behaviour
Choice
Choice was defined as the actual choice implemented. However, when the actual choice was not reported, the preferred option was used as a surrogate measure. Ninety‐three studies (80.9%) assessed the effects of decision aids on the participants' actual choice implemented (n = 57), their preferred option (n = 33), or used both (n = 3) (Table 14). Actual choice or preferences were reported as the percentage of individuals actually implementing or stating a preference for the most intensive or most invasive option.
| Study | Type of comparison | N Decision aid | Decision aid ‐ mean | N Comparison | Comparison ‐ mean | Notes |
| Other elective surgery ‐ uptake | ||||||
| DA versus usual care | 127 | 1 | 129 | 3 | No difference | |
| DA versus usual care | No difference | |||||
| Other elective surgery ‐ preference | ||||||
| Detailed versus simple DA | 32 | 13 | 31 | 14 | No difference | |
| Screening ‐ Breast cancer genetic testing ‐ uptake | ||||||
| Detailed versus simple DA | No difference | |||||
| Detailed versus simple DA | No difference | |||||
| Screening ‐ Breast cancer genetic testing ‐ preference | ||||||
| DA versus usual care | The intervention decreased intention to obtain genetic testing among women at average risk, but increased in women at high risk | |||||
| Screening ‐ Cardiac stress testing ‐ uptake | ||||||
| DA versus usual care | 101 | 58% | 100 | 77% | P < 0.0001 | |
| Screening ‐ Colorectal cancer genetic testing ‐ uptake | ||||||
| Detailed versus simple DA | No difference | |||||
| Screening ‐ Breast screening ‐ uptake | ||||||
| DA versus usual care | No difference | |||||
| DA versus usual care | 117 | 82% | 209 | 61% | P < 0.001 | |
| Screening ‐ Diabetes ‐ uptake | ||||||
| DA versus usual care | 633 | 353 | 639 | 368 | P = 0.51 | |
| Screening ‐ Diabetes ‐ preference | ||||||
| DA versus usual care | 273 | 134 | No difference | |||
| Screening ‐ Prenatal ‐ uptake | ||||||
| DA versus usual care | No difference | |||||
| DA versus usual care | 184 | 50% | 206 | 53.8% | No difference | |
| DA versus usual care | No difference | |||||
| Screening ‐ PSA ‐ uptake | ||||||
| DA versus usual care | The experimental interventions led to significant reductions in requests for prostate‐specific antigen tests ( ˜2 times greater decline). | |||||
| Medication ‐ Antibiotics for upper respiratory infections ‐ uptake | ||||||
| DA versus usual care | 81 | 33 | 70 | 49 | P = 0.08 | |
| Medication ‐ Cardiovascular disease ‐ preference | ||||||
| DA versus usual care | 79 | 63% | 78 | 42% | P < 0.01 | |
| Medication ‐ Breast cancer prevention ‐ uptake | ||||||
| DA versus usual care | 382 | 0.5% | 100 | 0% | No difference | |
| Medication ‐ Chemotherapy for advanced cancer | ||||||
| DA versus usual care | 107 | 77% | 100 | 71% | No difference | |
| Medication ‐ Hormone replacement therapy ‐ uptake | ||||||
| DA versus usual care | 8% decrease in DA group, not statistically significant | |||||
| Detailed versus simple DA | No difference | |||||
| Medication ‐ Natural heath products ‐ preference | ||||||
| DA versus usual care | 41% | 41% | No difference | |||
| Medication ‐ Anti‐thrombosis ‐ uptake | ||||||
| DA versus usual care | 25% decrease in DA group, not statistically significant | |||||
| DA versus usual care | No difference | |||||
| DA versus usual care | 93.8% | 25% | risk ratio 0.27 (95% CI 0.11 to 0.63) | |||
| Medication ‐ Hypertension ‐ uptake | ||||||
| DA versus usual care | No difference | |||||
| Medication ‐ Chemotherapy for breast cancer ‐ preference | ||||||
| DA versus usual care | No difference | |||||
| Medication ‐ Osteoporosis ‐ uptake | ||||||
| DA versus usual care | 52 | 44% | 48 | 40% | No difference | |
| Medication ‐ Immunotherapy ‐ uptake | ||||||
| DA versus usual care | No difference | |||||
| Medication ‐ Schizophrenia treatment ‐ uptake | ||||||
| Hamann 2006 ‐ prescriptions | DA versus usual care | No difference | ||||
| Hamann 2006 ‐ psycho‐education | DA versus usual care | Higher uptake in DA group (P = 0.003) | ||||
| Obstetrics ‐ Birth control method ‐ preference | ||||||
| DA versus usual care | 114 | 108 | No difference in the methods chosen between groups, participants in the intervention group were not more likely to initiate the requested method immediately compared to those in | |||
| Obstetric ‐ Childbirth procedure ‐ uptake | ||||||
| DA versus usual care | No difference | |||||
| DA versus usual care | No difference | |||||
| Obstetric ‐ Childbirth procedure ‐ preference | ||||||
| DA versus usual care | No difference | |||||
| Obstetric ‐ Embryo transplant ‐ uptake | ||||||
| van Peperstraten 2010 ‐ single embryo transfer | DA versus usual care | 152 | 43% | 156 | 32% | P = 0.05 |
| Obstetric ‐ Pain relief in labour ‐ uptake | ||||||
| Detailed versus simple DA | 308 | 146 | No difference | |||
| Other‐ Lung transplant referral | ||||||
| DA versus usual care | No difference | |||||
| Other ‐ Pre‐operative blood transfusion ‐ uptake | ||||||
| DA versus usual care | No difference | |||||
| Vaccine ‐ Flu shot ‐ uptake | ||||||
| DA versus usual care | 48 | 46% | 59 | 27% | No difference | |
| Vaccine ‐ Hepatitis B ‐ uptake | ||||||
| DA versus usual care | Significant increase of 76% in the DA group | |||||
DA: decision aid; OR: odds ratio
Choice for surgery
Major elective surgery
Eighteen studies (15.3%) focused on choices regarding a more major elective surgery. Fifteen (Arterburn 2011; Auvinen 2004; Barry 1997; Berry 2013; Bernstein 1998; Morgan 2000; Murray 2001a; Jibaja‐Weiss 2011; Kennedy 2002; Protheroe 2007; Schwartz 2009; Solberg 2010; Whelan 2004; Vodermaier 2009; Vuorma 2003) compared decision aids to usual care (Analysis 8.1), and three (Deyo 2000; Street 1995; Tiller 2006) compared detailed to simple decision aids (Analysis 8.2).
Using intention‐to‐treat analysis, there was a reduction in the number of patients choosing major elective surgery in the group receiving the decision aid compared to usual care (RR 0.79; 95% CI 0.68 to 0.93, n = 15; Analysis 8.1.2). Schwartz 2009 reported a statistically‐significant uptake of prophylactic mastectomy for women who are BRCA1/2 gene carriers (114%). Only three other studies showed statistically‐significant changes in surgery rates: ‐29% for cardiac revascularization (Morgan 2000), ‐74% for mastectomy (Whelan 2004), and ‐33% for orchiectomy (Auvinen 2004). Eight other studies (Arterburn 2011; Barry 1997; Bernstein 1998; Berry 2013; Jibaja‐Weiss 2011; Kennedy 2002; Solberg 2010; Vodermaier 2009) showed reductions in uptake of the more intensive surgical treatment by 14% to 58%, but the results were not statistically significant. Two studies (Protheroe 2007; Vuorma 2003) showed non‐significant higher rates of hysterectomy in the decision aid group compared to usual care. Another study (Murray 2001a) reported a non‐significant five‐fold increase in uptake of prostatectomy.
Using intention‐to‐treat analysis, there was a non‐statistically‐significant reduction in the number of patients choosing major elective surgery in the group receiving the detailed compared to simple decision aids (RR 0.82; 95% CI 0.63 to 1.08; Analysis 8.2.2). None of the three studies comparing detailed to simple decision aids reported a statistically‐significant difference in surgery rates for mastectomy in women with breast cancer (Street 1995), back surgery for people with herniated disc or spinal stenosis (Deyo 2000), prophylactic oophorectomies for women with a family history of breast or ovarian cancer, or non‐polyposis colon cancer (Tiller 2006).
Other elective surgery
Three studies evaluated the effect of decision aids versus usual care on other elective surgical decisions. Decision aids did not significantly influence surgical abortion rates (Wong 2006), feeding tube insertions (Hanson 2011), or preference for vasectomy (Labrecque 2010).
Choice for screening
Prostate‐specific antigen screening
The effects of decision aids on prostate‐specific antigen (PSA) screening decisions were variable in 13 studies (11.3%): 10 that compared decision aids to usual care and 3 that compared detailed to simple decision aids. The pooled RR for nine studies was 0.87 (95% CI 0.77 to 0.98; Analysis 8.3.1); Frosch 2008 reported a reduction in screening rates but we were not able to pool the data. Of 10 studies that compared decision aids with usual care, 3 showed significant reductions in screening by 9% to 42% (Frosch 2008; Volk 1999; Wolf 1996). The results of the other seven studies (Allen 2010; Evans 2010; Gattellari 2003; Gattellari 2005; Partin 2004; Krist 2007; Watson 2006) were not statistically significant.
Three studies compared a detailed and a simple decision aid and the pooled RR was 0.98 (95% CI 0.82 to 1.17; Analysis 8.3.2). There were non‐significant reductions of 2% and 11% in PSA screening in two studies (Myers 2011; Schapira 2000). One study reported a non‐significant increase in screening of 89% (Myers 2005a).
Colon cancer screening
Of 10 studies (8.7%) of colon cancer screening, 3 reported statistically‐significant changes and 7 showed no difference. Two studies reported that the decision aid, when compared to usual care, significantly increased the uptake of screening by 64% and 70%, respectively (Pignone 2000; Ruffin 2007), and the other study reported a statistically‐significant reduction of 21% for screening (Smith 2010). There was an increase in uptake of screening in five studies, by 6% to 39%, but the difference was not statistically significant (Lewis 2010; Miller 2011; Schroy 2011; Steckelberg 2011; Wolf 2000). In two studies (Dolan 2002; Trevena 2008), there was a 73% and 4% decrease in screening rates that was not statistically significant. The pooled RR was 1.12 (95% CI 0.95 to 1.31, n = 10; Analysis 8.3.3).
Cancer genetic screening
Preferences or uptake of cancer genetic screening were reported in 8 studies (7.0%): seven focused on breast cancer and one focused on colorectal cancer genetic testing. Preferences for breast cancer genetic screening were not statistically‐significantly affected when a decision aid was compared to usual care. The pooled RR was 1.01 (95% CI 0.83 to 1.22, n = 4; Analysis 8.3.4). One study reported an increased uptake of screening by 14% (Lerman 1997), a second study reported an increase of 18% (Green 2001a), a third study reported a decrease in uptake by 29% (Schwartz 2001), and the other study reported no difference (Green 2004). Miller 2005 reported that women exposed to the decision aid who were at higher risk of breast cancer increased their intention to obtain genetic testing, while those at average risk decreased their intention.
When detailed decision aids were compared to simple ones, there was no difference in uptake of genetic testing for breast or colorectal cancer (Wakefield 2008; Wakefield 2008a; Wakefield 2008b).
Breast screening
There was higher uptake of mammography screening among women aged 38 to 45 years of age (Mathieu 2010) but no difference in women aged 70 or older (Mathieu 2007) who were exposed to a decision aid versus usual care.
Prenatal screening
The uptake of prenatal testing was not affected by a decision aid compared to usual care (Bekker 2004; Bjorklund 2012; Nagle 2008), nor by a more detailed decision aid compared to a simple decision aid (Hunter 2005; Leung 2004; pooled RR 0.96, 95% CI 0.90 to 1.03; Analysis 8.3.5).
Stress test for chest pain
Compared to usual care, adults presenting with chest pain in the emergency department who received the decision aid had significantly less stress testing done (58% versus 77%) (Hess 2012).
Screening for diabetes
There was no difference in uptake (Marteau 2010) or preference (Mann E 2010) to be screened for diabetes in adults exposed to a decision aid compared to usual care.
Choice for medication
Antibiotics for upper respiratory infection
There was a decrease in prescriptions for antibiotics for upper respiratory infections when a decision aid was used in the consultation compared to usual care, but this difference was not statistically significant (Legare 2011).
Cardiovascular disease prevention
There was an increase in patient preferences for medication to lower cardiovascular disease risk when a decision aid was used compared to usual care (63% vs 42%) (Sheridan 2011). Three studies evaluated decision aids with people with diabetes considering cardiovascular disease prevention medications and the RR was 1.84 (95% CI 0.77 to 4.39). Compared to usual care, those exposed to the decision aid had increased uptake of statins therapy (Mann D 2010; Weymiller 2007), but the findings were not statistically significant (Analysis 8.4). Mullan 2009 reported that a higher proportion of people with type II diabetes started medications after exposure to the decision aid (33%), compared to usual care (22%).
Breast cancer prevention medication
There was no difference in uptake of medications for women at risk of breast cancer who were exposed to the decision aid versus usual care (Fagerlin 2011).
Chemotherapy for advanced cancer
There was no statistically‐significant difference in the uptake of chemotherapy for adults with advanced colorectal cancer (77% versus 71%) (Leighl 2011).
Menopausal hormone therapy
Preferences regarding hormone therapy for menopausal women were affected when a detailed decision aid was compared to a simple decision aid in three studies, with a statistically‐significant decrease of 36% (Dodin 2001), a non‐statistically‐significant decrease of 25% (Deschamps 2004) and non‐statistically‐significant increase of 12% (O'Connor 1998a) respectively. There was a statistically‐significant reduction of 27% in the uptake of hormone therapy when these studies were pooled (RR 0.73; 95% CI 0.55 to 0.98; Analysis 8.5). Schapira 2007 reported no difference in the use of hormone therapy between those exposed to the detailed or simple decision aid. In a single study comparing a decision aid to usual care (Murray 2001b), there was a decrease of 8%, which was not statistically significant.
Natural health products
Preferences for natural health products in women experiencing menopausal symptoms were no different for women exposed to the decision aid compared to women exposed to the usual education materials (Legare 2008a).
Anti‐thrombosis medication
Three studies evaluated the effect of a decision aid on the use of anti‐thrombotic therapy for atrial fibrillation versus usual care. One study demonstrated a non‐significant reduction of uptake of warfarin of 25% (Man‐Son‐Hing 1999). The second study evaluated the proportions of patients choosing the option that was appropriate relative to their level of risk, and found no significant difference between the groups (McAlister 2005). Thomson 2007 reported that patients in the usual care group (guided by practice recommendations) were much more likely to start warfarin (15/16; 93.8%) compared to the decision aid group (4/16; 25%; RR 0.27; 95% CI: 011 to 0.63).
Hypertension medication
Montgomery 2003 found no significant effect of decision aids over usual care on the initiation of medication for hypertension.
Breast cancer medication
Whelan 2003 also found no significant effect on preferences for adjuvant chemotherapy versus no chemotherapy for breast cancer.
Immunotherapy
Kasper 2008 reported no difference in the uptake of immunotherapy in people with multiple sclerosis who were exposed to a decision aid, compared to usual care based on practice guidelines.
Osteoporosis treatment
Montori 2011 found no significant effect of decision aids over usual care on the uptake of medication for osteoporosis treatment.
Schizophrenia treatment
Although Hamann 2006 found no difference in prescriptions for antipsychotic medications but a statistically‐significant increase in the uptake in psycho‐education (P = 0.003) in people with schizophrenia exposed to the decision aid compared to usual care.
Influenza (flu) vaccine
Compared to usual care, there was a non‐statistically‐significant increase in intentions to get the flu vaccine in those exposed to the decision aid (46% versus 27%) (Chambers 2012).
Hepatitis B vaccine
Compared to usual care, there was a statistically‐significant increase in uptake of Hepatitis B vaccination with decision aids (Clancy 1988).
Blood transfusions
There was no difference in the uptake of pre‐operative autologous blood donation when a decision aid was compared to usual care (Laupacis 2006).
Obstetrical choices
Childbirth procedures
Three studies focused on childbirth issues, using a decision aid compared to usual care. There was no difference in preference for (Shorten 2005) or actual vaginal mode of delivery (Montgomery 2007) following previous cesarean section. Another study found no difference in actual choice to undergo external cephalic version for women with breech presentation (Nassar 2007). Raynes‐Greenow 2010 reported that there was no difference in uptake of pain relief in labour for those exposed to a detailed versus simple decision aid.
Birth control approaches
There was no difference in the birth control methods chosen for those in the decision aid versus usual care groups (Langston 2010).
Embryo transplantation
Compared to usual care, those in the decision aid group were statistically significantly more likely to choose a single embryo transplant (43% versus 32%) (van Peperstraten 2010).
Other choices
Lung transplant referral
There was no difference in referral rates for consideration of lung transplant in people with advanced cystic fibrosis exposed to a decision aid versus usual care (Vandemheen 2009).
Summary: choice
In summary, patient decision aids decrease the number of patients choosing elective surgical procedures, PSA testing, and use of hormone therapy in multiple studies. Single studies showed that decision aids increased the number of people choosing: hepatitis B vaccination, psycho‐educational therapies for schizophrenia, and medication for cardiovascular disease prevention; and decreased cardiac stress testing and the number of embryos being transplanted. The effect on patients' choice in other situations was more variable. There were mixed results for the choice of colon cancer screening, genetic testing, prenatal testing, anti‐thrombosis therapy, breast screening, and diabetes medications. There was no difference between groups for choices about natural health products, hypertension therapy, breast cancer chemotherapy, schizophrenia medication, immunotherapy for multiple sclerosis, flu vaccine, diabetes screening, birth control, osteoporosis treatment, chemotherapy for advanced cancer, chemopreventive medications, antibiotics for upper respiratory tract infections, use of blood transfusions, and childbirth procedures.
Adherence (continuance/compliance) with chosen option
Of 115 studies, 13 (11.3%) measured adherence with the chosen option: 10 compared a decision aid to usual care, and 3 compared detailed to simple decision aids (Table 15). Of the 10 that compared a decision aid to usual care, 3 studies showed a statistically‐significant difference between groups, with adherence rates reported by Mullan 2009 favouring usual care (97.5% decision aid compared to 100% usual care at 6 months), and with adherence rates reported by Montori 2011 and Sheridan 2011 favouring the decision aid. Montori 2011 reported that 100% of the participants in the decision aid group versus 74% in the usual care group at 6 months had taken their medication on more than 80% of the days for which it was prescribed, based on pharmacy records. Sheridan 2011 found higher adherence in the decision aid group compared to the usual care group for any therapy described in the decision aid, any therapy whether or not it was described in the decision aid, and aspirin (P < 0.02). Although trends appeared positive for decision aids, the Sheridan 2011 study was underpowered to determine if observed differences between decision aid and usual care were statistically significant for adherence to cholesterol medication, blood pressure medication, or smoking cessation. The other seven studies found no difference in adherence to medication for atrial fibrillation (warfarin versus aspirin) at six months (Man‐Son‐Hing 1999), oral bisphosphonate medication for osteoporosis at four months (Oakley 2006), blood pressure medication at three years (Montgomery 2003), anti‐depressant medication at two months (Loh 2007), statins for high cholesterol at three or six months (Mann D 2010; Weymiller 2007), or use of effective contraceptive method (Langston 2010).
| Reference | Scale used | N Decision aid | Mean (SD) Decision aid | N Comparison | Mean (SD) Comparison | Notes |
| DA versus usual care | ||||||
| 3 months ‐ Using a contraceptive method that was in the same effectiveness group as the method requested at enrolment, 'very effective', as chosen option ‐ eg. if chose sterilization and ended up using an IUD counted as adhering | 48 | 85% | 52 | 77% | P = 0.28 | |
| 3 months ‐ Using a contraceptive method that was in the same effectiveness group, 'effective', as chosen option | 41 | 68% | 31 | 68% | P = 0.96 | |
| 6 to 8 weeks ‐ Patient reported ‐ 5‐point Likert scale on steadiness of following the treatment plan: 1‐very bad to 5‐very good | 191 | 4.3 (0.9) | 96 | 3.9 (1.0) | P = 0.073 | |
| 6 to 8 weeks ‐ Physician reported ‐ 5‐point Likert scale steadiness of following the treatment plan: 1‐very bad to 5‐very good | 191 | 4.8 (0.6) | 96 | 4.3 (1.1) | P = 0.56 | |
| 3 months ‐ telephone administration of the 8‐item Morisky adherence (7 yes/no items and 1 item with 5 point Likert scale to elicit behaviours such as skipping medicines when they have no symptoms) | 70% of participants reported good adherence to statins with no difference between groups | |||||
| 6 months ‐ telephone administration of the 8‐item Morisky adherence (7 yes/no items and 1 item with 5 point Likert scale to elicit behaviours such as skipping medicines when they have no symptoms) | 80% of participants reported good adherence to statins with no difference between groups | |||||
| 6 months ‐ Self reported – Measured % of patients taking therapy initially chosen | 129 | 95.35% | 134 | 93.28% | P = 0.44 | |
| ˜ 3 years ‐ Self reported – 6 item Adherence Questionnaire: from "I take all my tablets at the same time of day" to "I take hardly any of my tablets“ | No difference | |||||
| 6 months ‐ Percentage of participants that self‐reported currently taking medication who have not missed one dose within last week | 17 | 65% | 19 | 63% | P = 0.92 | |
| 6 months ‐ Percentage of participants who opted to take biophosphonates who took their medication on more than 80% of the days for which it was prescribed, based on pharmacy records | 23 | 100% | 19 | 74% | P = 0.009 | |
| 6 months ‐ Pharmacy records ‐ days covered (range) | 48 | 97.5% (range 0 to 100) | 37 | 100 (range 73.9 to 100) | AMD −8.88 (−13.6% to −4.14%) Positive AMD favours decision aid arm. This finding is statistically significant | |
| 6 months ‐ Self reported by telephone call – did not miss a dose in last week | 41 | 76% | 31 | 81% | OR 0.74 (95% CI 0.24‐2.32) | |
| 4 months ‐ Extent to which the patients' behaviour in taking medications coincides with the clinical prescription | 16 | 10.4% (32) [improvement from baseline] | 17 | 2% (26) [improvement from baseline] | Not significant | |
| 3 month ‐ adherence to initial choice post intervention | ||||||
| Any therapy promoted in decision aid | 76 | 45 (59%) | 73 | 25 (34%) | P < 0.01 | |
| any therapy promoted in decision aid + others (eg. diet or physical activity) | 77 | 64 (83%) | 77 | 52 (68%) | P = 0.02 | |
| aspirin | 32 | 30 (94%) | 19 | 11 (58%) | P < 0.01 | |
| cholesterol medicine | 14 | 12 (86%) | 6 | 5 (83%) | The intervention had little effect blood pressure or cholesterol medication, | |
| blood pressure medicine | 9 | 9 (100%) | 12 | 11 (92%) | ||
| stop smoking | 8 | 25% | 5 | 20% | No effect on smoking, although subgroups were small | |
| 3 months ‐ Self reported – mailed surveys & telephone call to non‐respondents on adherence to statin use: missed 1 dose or more within the last week. | 33 | 93.94% | 29 | 79.31% | No difference in adherence when analysis adjusted by sex, cardiovascular disease, and number of medications | |
| Detailed versus simple DA | ||||||
| 12 months ‐ Self reported – Telephone call to patients to ask estimated days missed per week and reasons Response categories: 1) taking medication as prescribed (omitting no more than one day/week) , 2) missing doses occasionally and randomly, 3) systematically deviating from the prescribed directions | 16 | ˜72% | 20 | ˜72% | No difference | |
| 12 months ‐ Self reported – daily adherence recorded on a calendar | 62 | ˜89% | 74 | ˜89% | No difference | |
| 1 month ‐ faecal occult blood test uptake | 134 | 5.2% | 137 | 6.6% | P = 0.64 | |
DA: decision aid; OR: odds ratio
Three studies that compared a detailed to a simple decision aid reported no difference in adherence to hormone therapy at 12 months (Deschamps 2004; Rothert 1997), or in colorectal cancer screening rates at 1 month (Trevena 2008).
Health outcomes
General health outcomes
Ten studies (8.7%) compared a decision aid to usual care and one study compared detailed to simple decision aids in terms of general health outcomes. Eight of these (Barry 1997; Bernstein 1998; Kennedy 2002; Legare 2011; McCaffery 2010; Morgan 2000; Murray 2001a; Murray 2001b) used the previously validated Medical Outcomes Study 36‐item Short‐Form Health Survey (SF‐36) or the 12‐item Short‐Form Health Survey (SF‐12) (Stewart 1992), and one study (Vuorma 2003) used the RAND‐36 (Hays 1993). As shown in Table 16, there were no significant differences for mental health function or social function in any of the seven studies. In one study (Barry 1997), general health and physical function outcome scores were significantly better in the decision aid group compared to usual care for men considering treatments for benign prostatic disease. Of the two studies evaluating the effect of a decision aid for women considering treatment for abnormal uterine bleeding, Kennedy 2002 found a statistically‐significant improvement in role physical function, and Vuorma 2003 found a statistically‐significant improvement in emotional role functioning for women.
| Reference | Timing | N Decision aid | Mean Decision aid (SD) | Change from baseline | N Comparison | Mean Comparison (SD) | Change from Baseline | Notes |
| General health ‐ DA versus usual care | ||||||||
| Barry 1997 (SF‐36) | Baseline | 104 | 67.2 (19.0) | 123 | 71.1 (17.6) | P = 0.02 | ||
| 3 months | ‐0.96 (1.41) | ‐3.59 (1.57) | ||||||
| 6 months | ‐1.46 (1.41) | ‐4.93 (1.45) | ||||||
| 12 months | 0.61 (1.58) | ‐4.99 (1.44) | ||||||
| Legare 2011 (percentage of people who felt they had a stable and better health, (SF‐12)) | 2 weeks post | not reported | 94 | +7 | not reported | 85 | ‐6 | P = 0.08 |
| Morgan 2000 (SF‐36) | 6 months post | 72 | 62 (23) | +4.0 | 88 | 65 (20) | +7.0 | No difference |
| Kennedy 2002 (SF‐36) | 2 years | 176 | 157 | No difference | ||||
| Vuorma 2003 (RAND‐36) | 1 year | 156 | 2.2 | 159 | 2.8 | No difference | ||
| Physical function ‐ DA versus usual care | ||||||||
| Barry 1997 (SF‐36) | Baseline | 104 | 81.9 (20.0) | 123 | 83.0 (18.9) | P = 0.02 | ||
| 3 months | ‐0.34 (1.61) | ‐1.81 (1.07) | ||||||
| 6 months | 0.10 (1.28) | ‐3.26 (1.37) | ||||||
| 12 months | 0.15 (1.40) | ‐3.74 (1.18) | ||||||
| Morgan 2000 (SF‐36) | 6 months post | 72 | 67 (29) | +7.0 | 88 | 71 (24) | +10.0 | No difference |
| Kennedy 2002 (SF‐36) | 2 years | 176 | 157 | No difference | ||||
| Vuorma 2003 (RAND‐36) | 1 year | 156 | 2.4 | 159 | 2.2 | No difference | ||
| Physical function ‐ Detailed versus simple DA | ||||||||
| Bernstein 1998 (SF‐12) | 3 months post | 61 | 38 (12.1) | +0.6 | 48 | 37.6 (10.6) | +3.8 | No difference |
| Social function ‐ DA versus usual care | ||||||||
| Barry 1997 (SF‐36) | Baseline | 104 | 90.6 (15.5) | 123 | 91.7 (15.7) | P = 0.17 | ||
| 3 months | 0.34 (1.58) | ‐2.26 (1.36) | ||||||
| 6 months | ‐0.05 (1.92) | ‐2.46 (1.45) | ||||||
| 12 months | ‐1.46 (1.85) | ‐3.52 (1.71) | ||||||
| Kennedy 2002 (SF‐36) | 2 years | 176 | 157 | No difference | ||||
| McCaffery 2010 (SF‐36) | 2 weeks | 77 | 84.7 | 71 | 82.1 | P = 0.39 | ||
| Vuorma 2003 (RAND‐36) | 1 year | 156 | 5.2 | 159 | 7.1 | No difference | ||
| Mental function ‐ DA versus usual care | ||||||||
| McCaffery 2010 (SF‐36) | 2 weeks | 77 | 71.3 | 71 | 71.6 | P = 0.46 | ||
| Kennedy 2002 (SF‐36) | 2 years | 176 | 157 | No difference | ||||
| Vuorma 2003 (RAND‐36) | 1 year | 156 | 4.7 | 159 | 5.3 | No difference | ||
| Mental function ‐ Detailed versus simple DA | ||||||||
| Bernstein 1998 (SF‐12) | 3 months post | 61 | 49.1 (11.4) | 0.0 | 48 | 48.9 (10.8) | +0.9 | No difference |
| Role function ‐ DA versus usual care | ||||||||
| Morgan 2000 (SF‐36) | 6 months post | 72 | 62 (44) | +20.0 | 88 | 58 (43) | +15.0 | No difference |
| Kennedy 2002 (SF‐36) | 2 years | 176 | 157 | P = 0.04 | ||||
| Vuorma 2003 (RAND‐36) | 1 year | 9.2 | 6.3 | No difference | ||||
| Bodily pain ‐ DA versus usual care | ||||||||
| Morgan 2000 (SF‐36) | 6 months post | 72 | 81 (22) | +6.0 | 88 | 77 (24) | +5.0 | No difference |
| Kennedy 2002 (SF‐36) | 2 years | 176 | 157 | No difference | ||||
| Vuorma 2003 (RAND‐36) | 1 year | 156 | 6.5 | 159 | 6.2 | No difference | ||
| Role emotional ‐ DA versus usual care | ||||||||
| Kennedy 2002 (SF‐36) | 2 years | 176 | 157 | No difference | ||||
| McCaffery 2010 (SF‐36) | 2 weeks | 77 | 80.3 | 71 | 77.4 | P = 0.61 | ||
| Vuorma 2003 (RAND‐36) | 1 year | 156 | 12.6 | 159 | 1.9 | P = 0.01 | ||
| Energy/vitality ‐ DA versus usual care | ||||||||
| Kennedy 2002 (SF‐36) | 2 years | 176 | 157 | No difference | ||||
| McCaffery 2010 (SF‐36) | 2 weeks | 77 | 55.2 | 71 | 54.1 | P = 0.09 | ||
| Vuorma 2003 (RAND‐36) | 1 year | 156 | 8.9 | 159 | 8.8 | No difference | ||
| SF‐36 all dimensions ‐ DA versus usual care | ||||||||
| McCaffery 2010 (SF‐36) | 2 weeks | 77 | 47 | 71 | 46.3 | P = 0.35 | ||
| Murray 2001b (SF‐36) | 9 months | 93 | 94 | No difference | ||||
| Murray 2001a (SP‐36) | 9 months | 54 | 48 | No difference | ||||
| Functional status ‐ DA versus usual care | ||||||||
| Deyo 2000 (Roland Disability Questionnaire) | 1 year | 171 | 20.4 | +5.4 | 173 | 20.9 | +5.7 | No difference |
| Leighl 2011 (FACT‐G) median (range) | 1 month post | 74 | 17 (6‐28) | 68 | 17.5 (7‐28) | P = 0.02 | ||
| Health utilities ‐ DA versus usual care | ||||||||
| Murray 2001a (Euroqol EQ‐5D) | No difference | |||||||
| Murray 2001b (Euroqol EQ‐5D) | No difference | |||||||
DA: decision aid; SF‐36: Medical Outcomes Study 36‐item Short‐Form Health Survey; SF‐12: 12‐item Short‐Form Health Survey;
RAND‐36: the 36‐item short form survey from the RAND Medical Outcomes Study
FACT‐G: Functional Assessment of Cancer Therapy‐General
Deyo 2000, using the previously validated Roland Disability Questionnaire (Roland 1983) to measure functional status in patients with back pain, found no difference between the detailed decision aid and simple decision aid groups.
In two studies measuring health utilities using the Euroqol EQ‐5D (Murray 2001a; Murray 2001b), there was no difference between the decision aid and usual care groups.
Condition‐specific health outcomes
Twelve studies (10.4%) used various measures to assess condition‐specific health outcomes (see Table 17). Ten of these compared decision aids to usual care (Barry 1997; Bernstein 1998; Leighl 2011; Morgan 2000; Murray 2001a; Murray 2001b; Protheroe 2007; Thomson 2007; van Peperstraten 2010; Vuorma 2003), and two compared a detailed decision aid to a simple decision aid (Deyo 2000; Raynes‐Greenow 2010). Outcomes included urinary symptoms (Barry 1997; Murray 2001a), angina (Bernstein 1998; Morgan 2000), back pain (Deyo 2000), menopausal symptoms (Murray 2001b), menstrual symptoms (Protheroe 2007; Vuorma 2003), stroke or bleed (Thomson 2007), pregnancies and twin pregnancies (van Peperstraten 2010), and newborn Apgar score and birth weight (Raynes‐Greenow 2010). Nine of the 12 studies (Bernstein 1998; Leighl 2011; Morgan 2000; Murray 2001a; Murray 2001b; Raynes‐Greenow 2010; Thomson 2007; van Peperstraten 2010; Vuorma 2003) found no significant effects on condition‐specific health outcomes. Protheroe 2007 reported statistically‐significantly higher menorrhagia‐related quality of life in women exposed to the decision aid compared to usual care. Deyo 2000 found no significant differences according to most measures, except for back pain severity ‐‐ for which improvement was shown, one year later, in the decision aid group. Barry 1997 showed an improvement in urinary symptoms in favour of the decision aid group, but it was not statistically significant.
| Study | Outcome | Scale used | Timing | N Decision aid | Decision aid mean change | N Comparison | Comparison mean change | Notes |
| DA versus usual care | ||||||||
| Urinary symptoms | AUA Symptom Index (0 to 100) | 3 months | 104 | ‐4.80% (1.74) | 117 | ‐1.40% (1.37) | No difference; trend toward DA | |
| Urinary symptoms | AUA | 6 months | 104 | ‐3.66% (2.06) | 117 | ‐3.17% (1.77) | No difference | |
| Urinary symptoms | AUA | 12 months | 104 | ‐2.51% (2.11) | 117 | ‐4.14% (1.66) | No difference; trend toward control | |
| Impact of symptoms | BPH Impact Index (0 to 100) | 3 months | 104 | ‐6.58% (1.10) | 117 | ‐3.00% (1.05) | No difference; trend toward DA | |
| Impact of symptoms | BPH | 6 months | 104 | ‐4.37% (1.32) | 117 | ‐3.89% (1.16) | No difference; trend toward DA | |
| Impact of symptoms | BPH | 12 months | 104 | ‐5.53% (1.32) | 117 | ‐2.63% (1.32) | No difference; trend toward DA | |
| Satisfaction | SAQ (0 to 100) | 3 months | 61 | +6.2% | 48 | +10.5% | Control significantly more satisfied | |
| Angina stability | SAQ | 3 months | 61 | +17.2% | 48 | +28.3% | No difference | |
| Angina frequency | SAQ | 3 months | 61 | +5.5% | 48 | +15.3% | No difference | |
| Disease Perception | SAQ | 3 months | 61 | +14.1% | 48 | +18.8% | No difference | |
| Physical Capacity | SAQ | 3 months | 61 | ‐0.5% | 48 | +7.1% | No difference | |
| (FACT‐G) median (range) | Physical function at 1 month post | 74 | 21 (0‐28) | 68 | 20 (4‐28) | No difference | ||
| Role emotional at 1 month post | 74 | 17 (0‐20) | 68 | 17(7‐20) | No difference | |||
| No Angina | CCVA | 6 months | 72 | +49% | 88 | +48% | No difference | |
| Class I Angina | CCVA | 6 months | 72 | ‐1% | 88 | +6% | No difference | |
| Class II Angina | CCVA | 6 months | 72 | ‐23% | 88 | ‐26% | No difference | |
| Class III Angina | CCVA | 6 months | 72 | ‐26% | 88 | ‐28% | No difference | |
| Class IV Angina | CCVA | 6 months | 72 | 0% | 88 | 0% | No difference | |
| Urinary symptoms | AUA symptom Index (0 to100) | No difference | ||||||
| Menopausal symptoms | MenQol | No difference | ||||||
| Menorrhagia specific utility scale | (0 to 100) | 6 months | 60 | 59.3 (30.0) | 56 | 50.9 (25.1) | P = 0.03 higher menorrhagia quality of life favouring DA group | |
| Strokes or bleeds requiring admission | 3 months | 51 | 55 | No strokes and no bleeds requiring admission. 1 bleed and 1 transient stroke both in control group that required GP consultation | ||||
| Ongoing pregnancies (> 12 weeks gestation) | after 1st IVF cycle | 152 | 156 | 32% of participants in the intervention group and 38% of participants in the control group had ongoing pregnancies, P = 0.25 | ||||
| Twin pregnancies (> 12 weeks gestation) | after 1st IVF cycle | 152 | 156 | 4% of participants in intervention group and 6% of participants in control group had twin pregnancies, P = 0.33 | ||||
| Inconvenience due to menstrual bleeding | (5 to 25) | 1 year | 156 | 10.4 | 159 | 10.5 | No difference | |
| Menstrual pain | (0 to 12) | 1 year | 156 | 4.7 | 159 | 4.6 | No difference | |
| Detailed versus simple DA | ||||||||
| % working | 1 year | 171 | +17.3% | 173 | +18.3% | No difference | ||
| % missed 1+ day work within past month | 1 year | 171 | ‐38.4% | 173 | ‐35.2% | No difference | ||
| Back pain severity | 1 year | 171 | ‐22.4% | 173 | ‐22% | 1 year scores: DA 27.6% significantly better than control 37.2% | ||
| Leg pain severity | 1 year | 171 | ‐42.1% | 173 | ‐43.9% | No difference | ||
| Seeking compensation | 1 year | 171 | ‐2.9% | 173 | ‐5.9% | No difference | ||
| Satisfied with symptoms | 1 year | 171 | +32.1% | 173 | +32.4% | No difference | ||
| Apgar score | scores > 7 | 1 minute after birth | 395 | 221 (82%) | 201 | 149 (75%) | P = 0.12 | |
| scores > 7 | 5 minutes after birth | 395 | 235 (90%) | 201 | 167 (84%) | P = 0.68 | ||
| Birth weight | in grams | mean (SD) | 395 | 3445 (451) | 201 | 3412 (450) | P = 0.11 | |
AUA: American Urological Association; CCVA: Canadian Cardiovascular Angina; BPH: benign prostatic hyperplasia; DA: decision aid; SAQ: Seattle Angina Questionnaire;
Preference‐linked health outcomes
None of the 115 studies measured preference‐linked health outcomes—that is, whether the patients experienced the outcomes they preferred and avoided the outcomes they wanted to avoid.
Anxiety
Of 115 studies, 30 (26.1%) measured anxiety, with 19 using the previously validated 20‐item State Trait Anxiety Inventory (Spielberger 1970) and 1 using a single question on a 7‐point Likert scale (Johnson 2006) (see Table 18). Twenty‐four of these studies involved decision aid/usual care comparisons, and five (Goel 2001; Hunter 2005; Raynes‐Greenow 2010; Tiller 2006; van Roosmalen 2004) involved detailed/simple decision aid comparisons (see Table 18). Of 23 studies that measured anxiety within 1 month, 2 (8.7%) reported that the decision aid group had statistically‐significantly lower anxiety scores for people considering birthing options after previous caesarean (Montgomery 2007) and for women considering options for treatment of menorrhagia (Protheroe 2007). Green 2004 reported a greater reduction in anxiety for high‐risk women considering genetic testing in the control group and a greater reduction in anxiety for low‐risk women considering genetic testing in the decision aid group.
| Study | Timing | N Decision aid | Mean Decision aid (SD) | Change from baseline | N Comparison | Mean Comparison (SD) | Change from Baseline | Notes |
| State Anxiety Inventory: < 30 days post‐intervention ‐ DA versus usual care | ||||||||
| Bekker 2004; prenatal screening | Immediately post | 50 | 58.9 (16.6) | 56 | 61.2 (13.7) | No difference | ||
| Evans 2010; PSA screening | immediately post DA | 89 | 4.98 | 103 | 4.88 | P = 0.98 | ||
| Green 2004; breast cancer screening (low risk group) | Immediately post | 56 | 29 | ‐4 | 61 | 30 | ‐3 | P = 0.04 (for difference in change score) |
| Green 2004; breast cancer screening (high risk group) | Immediately post | 50 | 30 | ‐3 | 44 | 33 | ‐5 | P = 0.04 (for difference in change score) |
| post consult, 1‐2 weeks and 4 weeks post | No difference; see Figure 3 | |||||||
| Mathieu 2007; mammography screening | immediately after | 321 | 29.61 | 315 | 29.34 | No difference | ||
| McCaffery 2010; HPV screening (state trait anxiety inventory) | 2 weeks | 77 | 10.5 | 71 | 10.6 | P = 0.25 | ||
| Montgomery 2003; hypertension | immediately post DA | 44 | 35.45 (10.52) | 50 | 37.67 (13.92) | No difference | ||
| Montgomery 2007; previous cesarean section | 37 weeks gestation | 196 | 38.7 (12.2) | 195 | 42.1 (12.2) | P = 0.016 | ||
| Nassar 2007; breech presentation | 1 week | 98 | 41.4 (12.5) | 90 | 44.4 (13.9) | No difference | ||
| Protheroe 2007; menorrhagia | 2 weeks | 59 | 11.6 (3.7) | 61 | 12.2 (3.7) | P = 0.016 | ||
| Rubel 2010; PSA screening | immediately after | 20 items adapted from state portion of State‐Trait Anxiety Inventory Scale STAI ‐ Form Y; total mean score= 1.66±0.59 (n=200) for patients in both groups | ||||||
| Smith 2010; bowel cancer screening | 2 week follow‐up | 357 | 13.67 | 173 | 14.05 | P= 0.80 | ||
| Thomson 2007; anti‐thrombotic treatment for atrial fibrillation | immediately after | 53 | 56 | Significant fall in anxiety (‐4.57) but no difference between groups (P = 0.98) | ||||
| Trevena 2008 colorectal cancer screening | immediately after | 134 | 137 | No difference (P = 0.59) | ||||
| van Peperstraten 2010; number of embryos transferred | immediately after | 152 | 27.33% | 156 | 24.5% | P = 0.14 | ||
| Whelan 2004; breast cancer surgery | 7 days post DA | 94 | 42.3 (1.3) | 107 | 41.9 (1.3) | No difference | ||
| Whelan 2003; breast chemotherapy | 7 days post DA | 82 | 45.6 | +2.2 | 93 | 47.4 | +0.8 | No difference |
| Wong 2006; pregnancy termination | Immediately post | 154 | 54 (15.8) | 159 | 54 (16.1) | No difference | ||
| State Anxiety Inventory: < 30 days post‐intervention ‐ Detailed versus simple DA | ||||||||
| Goel 2001; breast cancer surgery | 1 to 3 days post DA | 74 | 51.2 (14.2) | ‐0.7 | 43 | 50.7 (14.8) | ‐0.1 | No difference |
| Hunter 2005; prenatal screening | Immediately post | 116 | 45.50 (9.69) | ‐1.17 | 126 | 47.98 (10.14) | ‐0.37 | No difference |
| Raynes‐Greenow 2010; labour analgesia | 37 weeks gestation | 395 | 33.3 (9.3) | ‐0.6 | 201 | 34.3 (11.0) | 0 | P = 0.32 |
| Tiller 2006; prophylactic ovarian cancer treatment | 2 weeks | 58 | 38.2 (13.4) | 60 | 38.0 (15.2) | No difference | ||
| State Anxiety Inventory: 1 month post‐intervention ‐ DA versus usual care | ||||||||
| Bekker 2004; prenatal screening | 1 month post DA | 29 | 35.3 (12.5) | 39 | 34.7(14.8) | No difference | ||
| Davison 1997; prostate cancer treatment | 5 to 6 weeks post DA | 30 | 35.5 | ‐9.0 | 30 | 34.5 | ‐2.5 | No difference |
| State Anxiety Inventory: 1 month post‐intervention ‐ Detailed versus simple DA | ||||||||
| 1 month post DA | 43 | 35.4 (11.7) | 43 | 37.4 (10.7) | No difference | |||
| State Anxiety Inventory: 3 months post‐intervention ‐ DA vs usual care | ||||||||
| Murray 2001a; benign prostatic hypertrophy | 3 months post DA | 55 | 36.36 (14.99) | +2.4 | 48 | 32.08 (9.836) | +0.7 | No difference |
| Murray 2001b; hormone replacement therapy | 3 months post DA | 93 | 38.42 (10.83) | ‐0.5 | 95 | 40.53 (12.96) | +1.8 | No difference |
| Nagle 2008; prenatal screening | ˜1 to 12 weeks post DA | 167 | 37.2 (12.1) | 171 | 37.36 (12.6) | No difference | ||
| Nassar 2007; breech presentation | 3 months post DA | 86 | 29.2 (9.9) | 84 | 30.8 (10.5) | No difference | ||
| Vuorma 2003; menorrhagia treatment | 3 months post DA | 184 | 37.1 | +1.0 | 179 | 35.9 | ‐1.0 | No difference |
| Whelan 2003; breast chemotherapy | 3 months post DA | 82 | 36.0 | 93 | 37.8 | No difference | ||
| State Anxiety Inventory: 6 months post‐intervention ‐ DA versus usual care | ||||||||
| Protheroe 2007; menorrhagia | 6 months post DA | 47 | 11.2 (4.2) | 52 | 13.3 (4.9) | P = 0.067 | ||
| Whelan 2004; breast cancer surgery | 6 months post DA | 94 | 39.3 (1.3) | 107 | 38.9 (1.6) | No difference | ||
| Whelan 2003; breast chemotherapy | 6 months post DA | 82 | 38.2 | 93 | 38.2 | No difference | ||
| State Anxiety Inventory: 6 months post‐intervention ‐ Detailed versus simple DA | ||||||||
| Goel 2001; breast cancer surgery | 6 months post DA | 59 | 36.6 (12.9) | ‐15.3 | 39 | 34.3 (11.6) | ‐16.5 | No difference |
| Tiller 2006; prophylactic ovarian cancer treatment | 6 months post DA | 53 | 35.7 (9.0) | 55 | 36.2 (13.6) | No difference | ||
| State Anxiety Inventory: 12 months post‐intervention ‐ DA versus usual care | ||||||||
| Whelan 2004; breast cancer surgery | 12 months post DA | 94 | 37.5 (1.4) | 107 | 36.6 (1.5) | No difference | ||
| Whelan 2003; breast chemotherapy | 12 months post DA | 82 | 39.2 | 93 | 40.2 | No difference | ||
| Other ‐ DA versus usual care | ||||||||
| Johnson 2006; endodontic treatment | Immediately post ‐ single question 7‐point Likert scale. | 32 | 3.2 (1.7) | 35 | 3.8 (2.1) | P = 0.27 | ||
| Lewis 2010; colorectal cancer screening | intrusive thoughts ‐ 3 items; 4 point scale ‐ not at all | 139 | 66.2% | 157 | 68.0% | P = 0.92 | ||
| intrusive thoughts ‐ 3 items; 4 point scale ‐ sometimes | 66 | 31.4% | 69 | 29.9% | ||||
| intrusive thoughts ‐ 3 items; 4 point scale ‐ often | 5 | 2.4% | 5 | 2.2% | ||||
| intrusive thoughts ‐ measured using 1 item from the impact of events scale | 77 | 43% | 71 | 32% | No difference | |||
| Worry about developing bowel cancer ‐ quite or very | 357 | 6% | 173 | 8% | P = 0.78 | |||
| Worry about developing bowel cancer ‐ none or a bit | 357 | 94% | 173 | 92% | ||||
DA: decision aid; HPV: human papilloma virus; PSA: prostate‐specific antigen
None of the studies demonstrated significant differences in effects on people's state anxiety at one month (n = 3 studies), at three months (n = 6 studies), at six months (n = 5 studies), or at one year (n = 2 studies).
Depression
Of 115 studies, 9 (7.8%) measured the effect of decision aids on depression using various instruments (Table 19). None of the studies reported a statistically‐significant difference between groups for decisions about cancer treatment (Davison 1997; Whelan 2004), depression (Loh 2007), prenatal genetic testing (Nagle 2008), people at higher risk of cancer who were considering risk management (Tiller 2006), women considering number of embryos to transplant (van Peperstraten 2010), or genetic testing (Wakefield 2008; Wakefield 2008a; Wakefield 2008b).
| Study | Timing | N Decision aid | Mean Decision aid (SD) | Change from Baseline | N Comparison | MeanComparison (SD) | Change from Baseline | Notes |
| DA versus usual care | ||||||||
| Davison 1997 (20‐item CES‐D) | 5 to 6 weeks | 30 | 29.8 | ‐0.6 | 30 | 29.5 | +1.3 | No difference |
| Loh 2007 (Brief Patient Health Questionnaire‐D) | 6 to 8 weeks | 191 | 29.8 (2.7) | 96 | 27.0 (3.6) | P = 0.236 | ||
| Nagle 2008 (Edinburgh Postnatal Depression Scale) | ˜1 to 12 weeks post DA | 167 | 19 (11.6) | 171 | 19 (11.2) | No difference | ||
| Tiller 2006 (Hospital Anxiety and Depression Scale) | 2 weeks post DA | 58 | 10.9 (5.6) | 61 | 10.7 (6.4) | P = 0.03 | ||
| 6 mos post DA | 50 | 10.1(4.7) | 56 | 10.8 (6.4) | P = 0.12 | |||
| van Peperstraten 2010 (Beck Depression Inventory) | after multifaceted intervention/ before IVF | 126 | 16 (13%) | 136 | 5 (4%) | P = 0.01 | ||
| at uptake of IVF | 147 | 16 (11%) | 151 | 113 (9%) | No difference | |||
| Whelan 2004 (20‐item CES‐D) | 1 week post DA | 94 | 13.8 (1.0) | 107 | 13.4 (1.1) | No difference | ||
| 6 months post DA | 94 | 15.1 (1.1) | 107 | 14.2 (1.2) | No difference | |||
| 12 months post DA | 94 | 13.2 (1.3) | 107 | 12.8 (1.2) | No difference | |||
| Detailed versus simple DA | ||||||||
| Wakefield 2008 (Hospital Anxiety and Depression Scale) | 1 week post | 48 | 61 | No difference | ||||
| Wakefield 2008a (Hospital Anxiety and Depression Scale) | 1 week post | 56 | 63 | No difference | ||||
| Wakefield 2008b (Hospital Anxiety and Depression Scale) | immediately | 55 | 55 | No difference | ||||
CES‐D: Centre for Epidemiology Studies Depresion Scale; DA: decision aid; IVF: in vitro fertilisation
Regret
Of 115 studies, 7 (6.1%) measured the effect of decision aids on decision regret, using the 5‐item Decisional Regret scale (Brehaut 2003) (see Table 20). Of the seven studies, two compared decision aids to usual care and five studies compared detailed to simple decision aids. There was no statistically‐significant difference for any of the seven studies.
| Author | Item | N Decision aid | Proportion or Mean (SD) | N Control | Proportion or Mean (SD) | Notes |
| DA vs usual care | ||||||
| 5‐item Decisional Regret Index | 126 | 11.9 | 127 | 14.3 | P = 0.14 | |
| Proportion of patients with decisional regret | 7% | 9% | P=0.91 | |||
| Detailed vs simple DA | ||||||
| Right decision | 63 | 58 (92.06%) | 44 | 42 (95.45%) | No difference | |
| Regret choice | 63 | 8 (12.70%) | 44 | 5 (11.36%) | No difference | |
| Would make same choice | 63 | 54 (85.71%) | 44 | 40 (90.91%) | No difference | |
| Choice did me harm | 63 | 7 (11.11%) | 44 | 3 (6.82%) | No difference | |
| Decision was wise | 63 | 54 (85.71%) | 44 | 41 (93.18%) | No difference | |
| Decisional Regret ‐ 3 items at 26 to 30 weeks gestation | 244 | 9.6 | 252 | 12.8 | P = 0.28 | |
| Decision Regret Scale at 6 months | 41 | 54 | No difference | |||
| Decision Regret Scale | ˜57 | 7.04 (12.12) | ˜63 | 6.39 (13.68) | No difference | |
| Decision Regret Scale | ˜56 | 9.78 (14.49) | ˜49 | 5.13 (10.16) | No difference | |
DA: decision aid
Confidence
Of 115 studies, 9 (7.8%) measured the effect of decision aids on confidence levels: 8 compared decision aids to usual care and Rothert 1997 compared detailed to simple decision aids (see Table 21). Four of these studies used the Decisional Self‐efficacy Scale (Allen 2010; Arterburn 2011; Fraenkel 2007; Smith 2010). Of these eight studies, four reported a statistically‐significant improvement in confidence or self‐efficacy with decision making in the decision aid compared to the usual care groups (Chambers 2012; Fraenkel 2007; Gattellari 2003; McBride 2002) and the other studies reported no difference between groups. The other study comparing detailed to simple decision aids found no difference in confidence scores immediately post decision aid or at 12 months (Rothert 1997).
| Study | Scale used | Timing | N Decision aid | Decision aid ‐ mean | N Comparison | Comparison ‐ mean | Notes |
| DA vs usual care | |||||||
| 11‐item self‐efficacy scale | post intervention | 291 | 83% (40.26% SD) | 334 | 79% (33.08% SD) | No difference | |
| Decisional self efficacy | changes from baseline | 75 | + 3.0 (95% CI 0.6 to 5.4) | 77 | + 2.8 (95%CI 0.9 to 4.8) | P = 0.78 | |
| Mean confidence with decision: scale from 1 (low confidence) to 5 (high confidence) | post intervention | 48 | 4 | 59 | 3.6 | P = 0.02 | |
| Decisional self‐efficacy scale | pre‐consultation | 43 | 32 (median) | 40 | 27 (median) | P = 0.001 | |
| Perceived ability to make an informed choice 1‐item; 5‐point Likert scale | 3 days post | 106 | 108 | P = 0.008; DA group more likely to agree that they could make an informed choice about PSA screening | |||
| Perceived ability to make an informed choice 1‐item; 5‐point Likert scale | Immediately post | 131 | 136 | No difference | |||
| Confidence with ability to understand outcomes of hormone replacement therapy, make a decision, engage in discussion with practitioner 3‐items (0 to 10; low to high confidence) | 1 month post | 273 | 78% (18% SD) | 284 | 70% (19% SD) | P < 0.0001 | |
| 9 months post | 261 | 80% (17%SD) | 278 | 75% (20% SD) | P = 0.0004 | ||
| 3 items adapted from the Decisional self‐efficacy scale | 2 week follow‐up | 357 | 4.67 (0.54 SD) | 173 | 4.61(0.62 SD) | P = 0.26 | |
| Detailed versus simple DA | |||||||
| 8‐items (1 to 10; low to high confidence) | post DA | 83 | 78% (16% SD) | 89 | 80% (19% SD) | No difference | |
| 12 months post | 63 | 78% (15% SD) | 74 | 80% (19% SD) | No difference | ||
CI: confidence interval; DA: decision aid; SD: standard deviation
Healthcare system effects
Consultation length
Of 115 studies, 10 (8.7%) evaluated the effect of a decision aid compared to usual care (n = 9) or simple decision aid (n = 1) on consultation length, with a range from 8 minutes shorter to 23 minutes longer (median 2.5 minutes longer) (see Table 22). Four studies evaluated decision aids in the form of decision boards used primarily within the consultation (Loh 2007; Vodermaier 2009; Weymiller 2007; Whelan 2003). Of 9 studies, Bekker 2004 reported consultations about prenatal diagnostic testing were 6 minutes longer for women who prepared for the consultation using a decision aid, Thomson 2007 reported consultations about treatment for atrial fibrillation were 23 minutes longer when using a computerized decision aid with standard gamble method within the consultation compared to guideline driven consultation, and Green 2004 reported that consultations about breast cancer genetic testing were shorter by 8 minutes when women prepared using a decision aid. The other six studies that evaluated decision aids compared to usual care and one study that evaluated detailed compared to simple decision aids reported no statistically‐significant difference in consultation length (see Table 22). Results were not pooled given the variability in the way length of time was reported, including many studies that did not include standard deviations.
| Study | Scale used | N Decision aid | Decision aid ‐ mean | N Comparison | Comparison ‐ mean | Difference between groups | Notes |
| Consultation length ‐ DA versus usual care | |||||||
| Consultation length using DA in consult (minutes) | 50 | 32.2 (13.0 SD) | 56 | 26.3 (11.5 SD) | +5.9 minutes | P = 0.01 (longer with decision aid) | |
| Consultation length with practitioner post DA (minutes) | 106 | 82 | 105 | 90 | ‐8 minutes | P = 0.03 (shorter with decision aid) | |
| Time spent discussing prostate cancer with practitioner post DA (minutes) ‐patient reported | 196 | 5.3 | 75 | 5.2 | +0.1 minutes | No difference between groups | |
| Time spent discussing prostate cancer with practitioner post DA (minutes) ‐ physician reported | 196 | 3.8 | 75 | 4.2 | ‐0.4 minutes | No difference between groups but physicians thought they spent less time than patients (P < 0.001) | |
| Consultation length using DA in consult (minutes) | 191 | 29.2 (10.7) | 96 | 26.7 (12.5) | +2.5 minutes | P = 0.681 | |
| Consultation length using DA in consult (minutes) | 15 | 24 | 15 | 21 | +3 minutes | P = 0.42 | |
| Consultation length using DA in consult (minutes) | 8 | 44 (39 to 55) | 10 | 21 (19 to 26) | +23 minutes | P = 0.001 Compared computerized decision aid with standard gamble within the consultation to guideline driven consultation | |
| Consultation length with practitioner post DA | |||||||
| 5 to 10 min | 53 | 6 (11.3%) | 54 | 5 (9.3%) | P = 0.91 | ||
| 10 to 15 min | 17 (32.1%) | 19 (35.2%) | |||||
| 15 to 25 min | 15 (28.3%) | 14 (25.9%) | |||||
| 25 to 35 min | 7 (13.2%) | 5 (9.3%) | |||||
| Above 35 min | 8 (15.1%) | 11 (20.4%) | |||||
| Consultation length using DA in consult (minutes) | 50 | 68.3 | 50 | 65.7 | +2.6 minutes | P = 0.53 | |
| Consultation length using DA in consult (minutes) | 52 | 46 | +3.8 minutes | Not statistically significant 3.8 min longer in DA group (95%CI ‐2.9 to 10.5) | |||
| Consultation length ‐ Detailed versus simple DA | |||||||
| Encounter length with practitioner post DA (minutes) | Median 16 minutes for both groups (range 6 to 44) | ||||||
| Cost and resource use ‐ DA versus usual care | |||||||
| Cost‐consequences analysis | 235 | £2019 (SD £741) | 238 | £2033 (SD £677) | no difference | ||
| Cost effectiveness | 204 | $1556 USD | 215 | $2751 USD | Mean difference $1184 (95%CI $684 to $2110) | ||
| Total costs excluding intervention | 57 | £310.3 (SD £602.0) | 48 | £188.8 (SD £300.4) | Mean difference £121.5 (95% CI £ ‐58.9 to £302.0) | ||
| Total costs including intervention | 57 | £594.10 (SD £602) | 48 | £188.8 (SD £300.4) | Mean difference £405.4 (95% CI £224.9 to £585.8) P < 0.001 | ||
| Total costs excluding intervention | 85 | £90.5 | 84 | £90.9 (SD £39.2) | No difference | ||
| Total costs including intervention | 85 | £306.5 (SD £42.8) | 84 | £90.9 (SD £39.2) | Mean difference £215.5 (95% CI £203.1 to £228.0) P < 0.001 | ||
| GP consultations post intervention | 39/51 | 32/54 | P = 0.35 | ||||
| Hospital appointments post intervention | 29/51 | 10/54 | P = 0.06 | ||||
| Mean total savings per couple | Mean total saving per couple in the intervention group were €169.75 ($219.12 USD) | ||||||
| Cost and productivity losses | 184 | €2760 Euro | 179 | €3094 Euro | P = 0.1 No difference between intervention and control when treatment cost and productivity losses were analysed. | ||
| Cost and resource use ‐ Detailed versus simple DA | |||||||
| Healthcare use at 1 year | 171 | 172 | No difference in most services; DA less surgery for herniated disk | ||||
CI: confidence interval; DA: decision aid; SD: standard deviation
Cost and resource use
Eight studies (7.0%) evaluated the impact of decision aids compared to usual care on costs (Kennedy 2002;Montgomery 2007; Murray 2001a; Murray 2001b; van Peperstraten 2010; Vuorma 2003) or resource use only (Deyo 2000; Thomson 2007) (see Table 22).
Both studies by Murray involved a cost‐minimization economic analysis from the perspective of the healthcare system decision‐maker, with less than 4% of resource use items being replaced by conditional means due to missing data. There was no significant difference between the groups in terms of health service resource use. There was a difference in costs, when the additional costs of interactive videodisc equipment was considered in the analysis.
The cost‐effectiveness analysis in the Kennedy 2002 study was also conducted from the healthcare system perspective, using 1999 to 2000 US dollars and calculated over two years. The decision aid with nurse coaching demonstrated the lowest mean cost ($1566) compared to decision aid alone ($2026) or usual care ($2751).
In the Vuorma 2003 study, despite the statistically‐insignificant trend for fewer diagnostic procedures (55 versus 89; P = 0.07) and lower rates for uterine‐preserving surgery procedures (16 versus 26; P = 0.08) in the intervention group, there was no difference between the intervention and control group when treatment cost and productivity losses were analyzed at one year follow‐up.
van Peperstraten 2010 evaluated the costs from a healthcare perspective and determined the difference in total costs per couple between groups. The mean total savings in the decision aid compared to usual care group was €169.75 per couple.
Montgomery 2007 evaluated the costs from the United Kingdom National Health Service perspective and reported that there was no difference in mean costs per patient between groups.
For healthcare resource use, there was no difference in most services for Deyo 2000 (except fewer surgeries for herniated disc in the detailed versus simple decision aid group) and no difference in general practitioner consultations was reported by Thomson 2007.
Litigation rates
None of the 115 studies examined the effect of decision aids on litigation.
Post‐hoc analysis
Effects of study quality
To examine the potential bias arising from including trials of low methodological quality, eight trials with a high risk of bias for any of the seven risk of bias criteria were excluded from the analysis (Auvinen 2004; Chambers 2012; Clancy 1988; Hamann 2006; Krist 2007; Lewis 2010; Man‐Son‐Hing 1999; Rostom 2002). Overall, the results remained the same (Table 23). For a more conservative post‐hoc analysis, we also excluded 64 trials with a 'high' risk of bias or 'unclear' risk of bias for at least 3 of the 7 criteria (Figure 3). Overall, the results of this more conservative analysis remained the same (Table 23).
| Outcome | Overall mean effect (95% CI) | Without trials having high risk of bias on at least 1 of 7 criteria | Without trials having high or unclear risk of bias for at least 3 of 7 criteria |
| Knowledge ‐ decision aid versus usual care | 13.29 (11.32 to 15.25) n = 42 | 13.67 (11.60 to 15.74) n = 39 | 14.97 (11.84 to 18.10) n = 21 |
| Knowledge ‐ detailed versus simple decision aid | 5.52 (3.9 to 7.15) n = 19 | 5.48 (3.78 to 7.18) n = 18 | 6.97 (2.39 to 11.55) n = 3 |
| Accurate risk perceptions ‐ with probabilities versus no probabilities | 1.82 (1.52 to 2.16) n = 19 | 1.76 (1.48 to 2.10) n = 18 | 2.28 (1.78 to 2.92) n = 7 |
| Values congruent with chosen option | 1.51 (1.17 to 1.96) n = 13 | 1.52 (1.17 to 1.97) n = 13 | 2.15 (1.35 to 3.44) n = 6 |
| Uninformed sub‐scale of Decisional Conflict Scale ‐ decision aid versus usual care | ‐7.26 (‐9.73 to ‐4.78) n = 22 | ‐7.40 (‐10.06 to ‐4.74) n = 21 | ‐8.26 (‐11.74 to ‐4.78) n = 15 |
| Uninformed sub‐scale of Decisional Conflict Scale ‐ detailed versus simple decision aid | ‐2.39 (‐4.39 to ‐0.39) n = 10 | ‐2.39 (‐4.39 to ‐0.39) n = 10 | too few to assess, n = 1 |
| Unclear values sub‐scale of Decisional Conflict Scale ‐ decision aid versus usual care | ‐6.09 (‐8.5 to ‐3.67) n = 18 | ‐6.40 (‐9.02 to ‐3.79) n = 17 | ‐7.02 (‐10.00 to ‐4.04) n = 14 |
| Unclear values sub‐scale of Decisional Conflict Scale ‐ detailed versus simple decision aid | ‐2.31 (‐4.67 to 0.05) n = 10 | ‐2.31 (‐4.67 to 0.05) n = 10 | too few to assess, n = 1 |
CI: confidence interval
We applied a fixed‐effect model for the primary outcomes and compared it to the random‐effects model used in the analysis reported earlier. The results were similar. For example, knowledge results were 13.34 (95% CI 11.17 to 15.51) using a random‐effects model compared to 13.61 (95% CI 12.83 to 14.38) using a fixed‐effect model. Therefore, there is little concern about the impact of small studies being included that could potentially have shown more beneficial effects (Sterne 2011).
Heterogeneity
When patient decision aids were compared to usual care, there was statistically‐significant heterogeneity in five of six of the IPDAS effectiveness criteria: knowledge; accurate risk perceptions; values congruence with choice; feeling uninformed; and feeling unclear regarding personal values. There was no statistically‐significant heterogeneity for participation in decision making. It should be noted that the heterogeneity of the effect was not manifested in its direction but only in its size. For the 2009 update (O'Connor 2009), we explored the potential factors contributing to heterogeneity (Table 24). Overall, scores for outcomes were similar to the overall effect regardless of sub‐analysis conducted as indicated by overlapping confidence intervals.
| Outcome | Overall effect | Treatment decision | Screening decision | Video/computer Decision aid | Audio/pamphlet Decision aid | Base risk control | Removal of Outliers* |
| Knowledge ‐ decision aid versus usual care | 15.2 (11.7 to 18.7) | 16.5 (11.9 to 21.2) | 13.1 (7.7 to 18.5) | 21.3 (16.3 to 26.2) | 11.9 (8.3 to 15.6) | 15.5 (11.3 to 19.8) | 17.3 (13.6 to 20.9) (*Bekker 2004, Gattellari 2003, Johnson 2006) |
| Accurate risk perceptions ‐ probabilities versus no probabilities | 1.6 (1.4 to 1.9) | 1.6 (1.4 to 1.9) | 1.6 (1.1 to 2.3) | No data | 1.6 (1.4 to 1.9) | 1.3 (1.2 to 1.5) (P = 0.3) | 1.5 (1.3 to 1.7) (*Gattellari 2003) |
| Uninformed sub‐scale of the Decisional Conflict Scale ‐ decision aid versus usual care | ‐8.4 (‐11.9 to ‐4.8) | ‐9.4 (‐13.3 to ‐5.5) | ‐3.5 (‐12.9 to 5.8) | ‐12.6 (‐19.5 to ‐5.8) | ‐4.9 (‐7.6 to ‐2.3) (P = 0.06) | ‐5.4 (‐7.7 to ‐3.2) (P = 0.11) | ‐6.2 (‐8.4 to ‐4.1) (P = 0.06) (*Montgomery 2003) |
| Unclear values sub‐scale of the Decisional Conflict Scale ‐ decision aid versus usual care | ‐6.3 (‐10.0 to ‐2.7) | ‐6.0 (‐9.8 to ‐2.3) | Insufficient data | ‐8.0 (‐15.1 to ‐1.0) | ‐4.5 (‐8.4 to ‐0.6) | ‐3.6 (‐6.8 to ‐0.5) | ‐4.0 (‐6.7 to ‐1.3) (*Montgomery 2003) |
Discusión
Principales efectos de la ayuda en la decisión
Los beneficios más grandes y más consistentes de las ayudas en las decisiones, con respecto a la atención habitual, son un mejor conocimiento de las opciones y los resultados, percepciones más exactas de las probabilidades de resultado y la coincidencia entre la opción elegida y los valores del paciente. Estas observaciones son clínicamente importantes porque el conocimiento y la comprensión del grupo de atención habitual de los resultados probables fueron menores que los del grupo de intervención; el conocimiento y la comprensión del riesgo probable son importantes para asegurar una toma de decisiones fundamentada. Estos efectos sobre el conocimiento y las percepciones del riesgo indican que la "atención habitual" actual puede no ser lo suficientemente buena para informar a los pacientes acerca de estas decisiones complejas que requieren valoraciones. Los pacientes necesitan comprender las opciones y los resultados probables con el fin de considerar y comunicar a sus médicos los valores personales que le asignan a los beneficios en comparación con los riesgos. En esta actualización también hay un aumento significativo de la elección centrada en valores cuando las ayudas en las decisiones con ejercicios explícitos de aclaración de valores se compararon con una ayuda en la decisión sencilla sin aclaración de valores explícita o atención habitual.
Las ayudas en las decisiones, en comparación con la atención habitual, también contribuyen a que los pacientes se sientan más cómodos con la elección que hicieron. Este resultado se muestra en la reducción de las puntuaciones de las subescalas de los conflictos asociados con la toma de decisiones. Los pacientes que emplearon las ayudas en la decisión generalmente sintieron que estaban mejor informados sobre las opciones y que estaban más seguros de sus valoraciones personales.
Comparadas con las estrategias de la atención habitual, las ayudas en la decisión mejoran la participación activa individual en la toma de decisiones. Esta observación indica que el criterio de los International Patient Decision Aids Standards de ayuda a los pacientes a participar “de la forma que prefieran” necesita evaluarse después de que un paciente tiene la información adecuada acerca de lo que la participación significa. Las personas pueden tener una preferencia equivocada por la pasividad, porque creen que la mejor elección depende de la pericia del médico (¿qué opción es médicamente razonable?) en lugar de las opiniones de la persona que experimentará los resultados (¿qué resultados me importan más a mí?).
Las pruebas apoyan que las ayudas en las decisiones tienen un efecto positivo sobre la consulta médico‐paciente en los nueve estudios que lo midieron, y tienen un efecto variable sobre la duración en estas consultas. De los estudios que midieron la comunicación entre el médico y el paciente, cinco incluyeron el uso de ayudas en las decisiones dentro de la consulta y en tres las ayudas en las decisiones se utilizaron en la preparación para la consulta. Es interesante señalar que la mayoría de los estudios de duración de la consulta se realizaron sobre las ayudas en las decisiones concebidas para utilizarse dentro de la consulta, y menos estudios se centraron en la duración de la consulta cuando las ayudas en las decisiones se utilizaron en la preparación para la consulta. De los diez estudios que midieron la duración de la consulta, dos que también midieron la comunicación entre el médico y el paciente informaron que hubo un aumento en la participación del paciente en la consulta en los que se expuso la ayuda en la decisión al paciente dentro de la consulta en comparación con la atención habitual (Weymiller 2007) pero no hubo diferencias cuando se utilizó la ayuda en la decisión detallada comparada con la sencilla en la preparación para la consulta (Myers 2011). Sin embargo, pocos estudios han evaluado la repercusión de las ayudas en las decisiones de los pacientes en la práctica clínica y se realizan estudios de investigación adicionales para evaluar mejor los resultados cuando el ensayo se realiza dentro de la práctica clínica versus como otro estudio de investigación.
Efectos variables de la ayuda en la decisión
Hay varias razones de la diversidad del impacto de las ayudas en las decisiones tomadas. Primero, la mayoría de los estudios tuvo un escaso poder estadístico para detectar diferencias importantes en las elecciones. Segundo, en los cinco estudios que informaron las decisiones seleccionadas al inicio y después de la ayuda en la decisión, algunas opciones pueden haber sido subutilizadas y otras sobreutilizadas, con relación a las decisiones que los sujetos hubieran adoptado si hubieran estado completamente informados. En estas circunstancias, se podría esperar la observación de efectos direccionales en las decisiones tomadas, una vez que los pacientes estuvieron mejor informados y participaran activamente en la toma de decisiones. Como ejemplo de opciones relativamente subutilizadas al inicio fueron el cribado del cáncer de colon y la vacunación contra la hepatitis B. Otra ilustración reside en el aumento de cinco veces (no significativo) en el número de pacientes que eligen la cirugía de próstata en el estudio del Reino Unido y la captación para la mastectomía profiláctica en pacientes portadoras del gen BRCA. En el ejemplo de la próstata había escasez de urólogos y tasas de referencia bajas para la hiperplasia benigna de próstata; mientras que el ejemplo de la mama refleja el número creciente de pacientes que tienen una prueba positiva para el gen que están conscientes de las opciones para prevenir el cáncer de mama. Esta situación puede haber dado lugar a subutilización de una opción elegida, que se corrigió con la exposición a una ayuda en la decisión. Por el contrario, los otros estudios de ayuda en la decisión quirúrgica tenían cantidades mayores de pacientes que elegían la cirugía en el grupo control. El procedimiento puede haber sido elegido porque los pacientes tienen percepciones exageradas de la probabilidad de los beneficios, falta de apreciación de la probabilidad de los daños y falta de conocimiento de las alternativas. La exposición a las ayudas en las decisiones redujo el número de pacientes que elegían la cirugía a favor de opciones más conservadoras.
Efectos limitados de la ayuda en la decisión
Los limitados efectos de la ayuda en la decisión, sobre la satisfacción con el proceso de toma de decisiones informada y con la decisión real tomada, pueden ser debidos a que la ayuda en la decisión tiene un efecto limitado sobre la satisfacción. Los efectos nulos también pueden ser debidos a la falta de sensibilidad de la medición. Lo anterior es especialmente probable cuando la satisfacción con la atención habitual ya es muy alta (p.ej. efectos tope) y cuando las elecciones son intrínsecamente difíciles de hacer debido a los efectos beneficiosos y perjudiciales en competencia. Además, una vez que se ha tomado la decisión, los pacientes se sienten psicológicamente más cómodos al decir que están satisfechos con su decisión, en vez de considerar dudas acerca de lo que escogieron (Gruppen 1994). Es interesante que en los dos estudios que utilizaron la Preparation for Decision Making Scale para comparar la ayuda en la decisión con la atención habitual, ambos informaron resultados positivos en la satisfacción en el grupo de ayuda en la decisión al paciente.
Las pequeñas diferencias en las puntuaciones del conocimiento y del conflicto en la decisión encontradas entre las versiones más sencillas y las detalladas de la ayuda en la decisión probablemente se deban a una superposición de la información presentada en las dos intervenciones. Esta afirmación plantea preguntas acerca de la información mínima necesaria para que la ayuda en la decisión sea efectiva. Por ejemplo, en el estudio Goel 2001, un folleto sencillo que describía las opciones y resultados de la mastectomía versus la tumorectomía fue comparable a un audio‐cuaderno detallado para las pacientes con cáncer de mama recién diagnosticado. Sin embargo, un análisis posterior reveló que las pacientes que tenían dudas acerca de su decisión al inicio del estudio o que optaban por la mastectomía, al parecer se beneficiaron más con la ayuda detallada. Estas observaciones indican la necesidad de determinar cuáles son los "ingredientes esenciales" que deben tener las ayudas en la toma de decisiones e identificar a los pacientes que más probablemente se beneficien con las versiones detalladas. A medida que aumente la información disponible sobre las investigaciones, será más fácil y más importante evaluar la utilidad de los diferentes componentes de apoyo a las decisiones, en los diversos contextos clínicos, problemas de decisión y grupos de personas. La Colaboración IPDAS trata de establecer las pruebas de los diversos componentes de las ayudas en las decisiones en el grupo reciente de revisiones que son la base de la lista de verificación IPDAS (IPDAS 2013). Como mínimo, la colaboración IPDAS propone los criterios para definir la intervención como una ayuda en la decisión de los pacientes y certifica los criterios (Joseph‐Williams 2013).
No es sorprendente que la ayuda en la decisión tuviera efectos limitados sobre los resultados sobre la salud. Un motivo para utilizar una ayuda en la decisión es que con frecuencia no hay opciones con ventajas claras de resultados sobre la salud. Por ejemplo, cuando los pacientes con cáncer de próstata localizado consideran las opciones de tratamiento activo sus resultados de salud pueden ser diferentes dependendiendo de si eligen la cirugía con riesgos mayores de incontinencia urinaria a más largo plazo o la radioterapia con riesgos mayores a más largo plazo de irritación intestinal. Por lo tanto, si los resultados de salud se utilizan en las investigaciones futuras de las ayudas en las decisiones en situaciones en las que claramente no hay ventajas de resultado sobre la salud, la pregunta clave a plantearse es: ¿Los pacientes obtienen los resultados sobre la salud que prefieren y evitan los que rechazan?
Más recientemente, las ayudas en las decisiones se utilizan en situaciones en las que puede haber una ventaja sobre la salud a más largo plazo; por ejemplo, en las decisiones preventivas acerca del tratamiento de la diabetes tipo II (Mann D 2010; Mullan 2009; Weymiller 2007) o la hipertensión (Montgomery 2003), cuando el resultado de salud a más largo plazo que quizás se pueda evitar sea el accidente cerebrovascular. Es interesante señalar que de estos estudios uno informó una diferencia estadísticamente significativa en el inicio de la medicación cuando la ayuda en la decisión se comparó con intervenciones alternativas (Mullan 2009), lo que destaca las tensiones entre las medidas de resultado y del proceso (Bekker 2010; Thomson 2005).
Efectos desconocidos de las ayudas en la decisión
El efecto de las ayudas en las decisiones de los pacientes sobre el cumplimiento es un área de incertidumbre. Los resultados del cumplimiento son difíciles de interpretar debido a los datos incompletos, la variación de la duración del seguimiento (cuatro a 36 meses), y el tamaño pequeño de la muestra (n = 33 en un estudio). Además, estudios como Man‐Son‐Hing 1999 tuvieron una variación muy pequeña en la elección (más del 90% de los consumidores de aspirina a largo plazo decidieron permanecer con la aspirina). Cuando se examina el cumplimiento, sería importante hacerlo: a) en una fase temprana, cuando probablemente el tema es en realidad de conflicto en las decisiones (p.ej. llenado de la prescripción, obtención de la prescripción, rellenado de la prescripción) en lugar de incluir lo relacionado con los efectos secundarios; y b) de una manera que separe los que eligen cambiar versus los que permanecen con el uso en un momento determinado.
A pesar de los efectos positivos de las ayudas en las decisiones sobre la comunicación entre el médico y el paciente, algunos autores están preocupados por la influencia negativa potencial que las ayudas en las decisiones pueden tener en aspectos relacionados con el proceso de toma de decisiones; esta inquietud destaca la necesidad de evaluación adicional cuando las ayudas en las decisiones se implementen como parte del proceso habitual de atención (Charles 2010; LeBlanc 2010).
La relación entre costo y eficacia, las utilidades de salud, y los resultados de salud vinculados con las preferencias son otros resultados secundarios acerca de los que se conoce poco y se necesita evaluación adicional. Es poco probable que se observe el efecto de las ayudas en las decisiones sobre las tasas de litigio en ensayos de ayudas en las decisiones, debido a la demora de los litigios y lo poco frecuente de este tipo de evento. De hecho, un ensayo simulado que utilizó una ayuda en las decisión de los pacientes para la realización de la prueba del antígeno específico de la próstata encontró que la mayoría de los miembros del jurado (94%) indicaría que el estándar de atención se había cumplido (Barry 2008).
Limitaciones
Esta revisión sistemática está limitada por el poder estadístico inadecuado para detectar diferencias importantes en la efectividad en los subgrupos y la variabilidad amplia en los ámbitos de decisión, los elementos dentro de las ayudas en las decisiones de los pacientes, el tipo de intervenciones de comparación, los resultados proyectados y los procedimientos de evaluación. Varios de los resultados demostraron una heterogeneidad estadísticamente significativa. Lo anterior refleja diferencias entre estudios clínicamente diversos; por lo tanto, el tamaño del efecto agrupado y los intervalos de confianza deben interpretarse como un intervalo a través de las situaciones, que no pueden ser aplicables a una situación específica. Un subanálisis para explorar tres posibles fuentes de heterogeneidad (p.ej. tipo de intervención control, puntuación de calidad IPDAS de ayuda en la decisión, percepción de riesgo exacta inicial de los pacientes) encontró que la percepción de riesgo exacta inicial de los pacientes fue una variable importante para explicar la heterogeneidad (Gentles 2013). Cuando las puntuaciones iniciales de los pacientes de la percepción de riesgo exacta son inferiores, se observa una gran mejoría. Además, los datos de estudio se limitaron a solo dos grupos de comparación (p.ej. más intensivo y menos intensivo).
Resumen de los resultados principales
La adición de 33 estudios en esta revisión actualizada confirma muchas de las observaciones informadas en las versiones anteriores de las revisiones (O'Connor 2003b; O'Connor 2009; Stacey 2011). Según la evaluación GRADE (Resumen de los hallazgos de la comparación principal; tabla 2), hay pruebas de alta calidad de que las ayudas en las decisiones en comparación con la atención habitual mejoran el conocimiento de los pacientes con respecto a las opciones, y reducen el conflicto en las decisiones relacionado con la sensación de no estar informado ni seguro acerca de los valores personales. Hay pruebas de calidad moderada de que las ayudas en las decisiones comparadas con la atención habitual estimulan a los pacientes a asumir una función más activa en la toma de decisiones y que mejoran las percepciones de riesgo exactas al incluir las probabilidades en comparación con las intervenciones que no incluyen las probabilidades. Hay pruebas de baja calidad de que las ayudas en las decisiones mejoran la coincidencia entre la opción elegida y los valores del paciente. En los resultados secundarios hay una disminución en la proporción de pacientes que permanecen indecisos. En comparación con las versiones sencillas, las ayudas en las decisiones detalladas mejoraron el conocimiento solo ligeramente.
Se mantiene la variabilidad en la repercusión de las ayudas en las decisiones sobre el aumento o la disminución del número de pacientes y sus preferencias por opciones particulares. Novedoso en esta actualización es el agrupamiento de pruebas que indica una tendencia no significativa a un aumento del 12% en el cribado del cáncer colorrectal en los pacientes expuestos a una ayuda en la decisión en comparación con la atención habitual. La cantidad de pacientes que eligen someterse a una cirugía mayor electiva disminuye a favor de opciones más conservadoras, excepto cuando las tasas iniciales son bajas (p.ej. cirugía por hiperplasia benigna de próstata, mastectomía profiláctica en pacientes portadoras del gen BRCA). La cantidad de pacientes que eligen la terapia de reemplazo hormonal y la prueba de antígeno específico de la próstata (PSA) se redujo con la exposición a las ayudas en las decisiones.
Las ayudas en las decisiones no son mejores que las intervenciones alternativas con respecto a la satisfacción de los pacientes con la toma de decisiones, la ansiedad o resultados de salud, como la calidad general de vida o la calidad de vida específica del trastorno. Sin embargo, ningún estudio midió los resultados de salud vinculados con la preferencia. Todavía hay muy pocos estudios para determinar los efectos de las ayudas en las decisiones sobre los costos y el uso de los recursos. Aunque proporcionar ayudas en las decisiones puede tener costos adicionales, una revisión independiente de ensayos de ayudas en las decisiones con resultados económicos concluyó que "era probable que los costos adicionales fueran pequeños con respecto al beneficio para los pacientes en cuanto a mejorar la calidad de la decisión cuando se utilizan eficaces ayudas en las decisiones" (NCGC/NICE 2012). Aunque varios estudios han medido el cumplimiento, la variabilidad en la medición dificulta determinar el efecto de las ayudas en las decisiones de los pacientes sobre el cumplimiento de la opción elegida.
En esta actualización es novedoso el análisis de los datos agrupados de las ayudas en las decisiones con respecto a las pruebas de detección por separado de las ayudas en las decisiones de tratamiento, y se encontró que los resultados fueron similares.
Calidad de la evidencia
Las calificaciones del riesgo de sesgo muestran la variabilidad en el riesgo de sesgo entre los estudios. Los dos criterios en los que los estudios fueron peor calificados fueron informe de resultado selectivo y cegamiento de los participantes y el personal. Cuando se realizó un análisis post‐hoc donde se eliminaron los estudios con alto riesgo de sesgo no hubo efectos sobre los resultados. Las conclusiones de esta revisión están limitadas por: a) el poder inadecuado para detectar diferencias importantes de la efectividad en los subgrupos; y b) la amplia variabilidad en los contextos de la decisión, los elementos en la ayuda en la decisión de los pacientes, el tipo de intervenciones de comparación, las medidas de resultado proyectadas y los procedimientos de evaluación. El pequeño número de estudios en la mayoría de los resultados no permitió el análisis del sesgo de publicación debido a no publicar los estudios negativos. Además, puede haber habido sesgo de publicación debido a que no se informaron todos los resultados negativos en un estudio publicado. Varios de los resultados demostraron una heterogeneidad estadísticamente significativa. En el resultado del conocimiento, por ejemplo, se esperaría heterogeneidad debido a que las pruebas del conocimiento no fueron estandarizadas. Además, la heterogeneidad encontrada en varios resultados refleja diferencias entre estudios clínicamente diversos; por lo tanto, el tamaño del efecto agrupado y los intervalos de confianza deben interpretarse como un intervalo a través de las situaciones, que no pueden ser aplicables a una situación específica.

Study flow diagram.

Risk of bias summary as percentages across all included studies.

Risk of bias summary for each included study.

Funnel plot of comparison: 1 Knowledge, outcome: 1.1 Knowledge: DA vs usual care ‐ all studies.
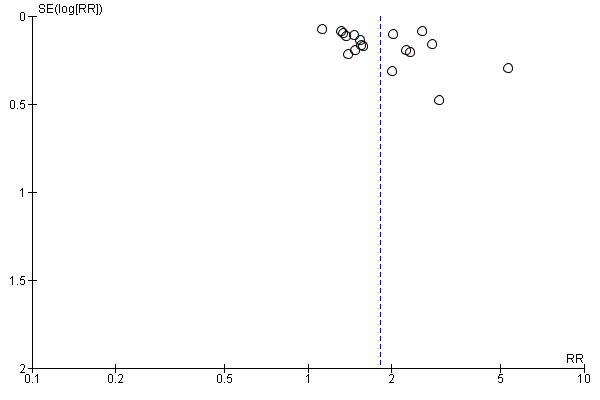
Funnel plot of comparison: 2 Accurate risk perceptions: Decision aid with outcome probabilities vs no outcome probability information, outcome: 2.1 Accurate risk perceptions ‐ all studies.

Funnel plot of comparison: 3 Values congruent with chosen option, outcome: 3.1 Values congruent with chosen option ‐ all studies.

Funnel plot of comparison: 4.1 Decisional conflict: DA vs usual care ‐ all studies, outcome: 4.1.2 Uninformed sub‐scale

Funnel plot of comparison: 4.1 Decisional conflict: DA vs usual care ‐ all studies, outcome: 4.1.3 Unclear sub‐scale
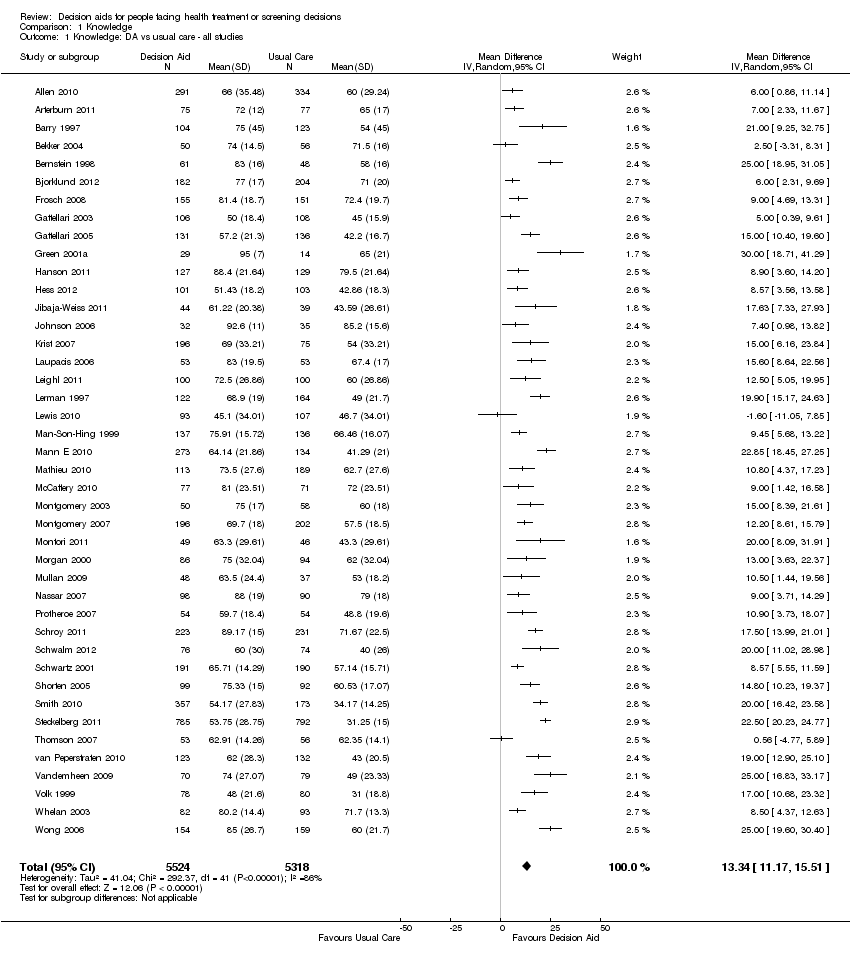
Comparison 1 Knowledge, Outcome 1 Knowledge: DA vs usual care ‐ all studies.

Comparison 1 Knowledge, Outcome 2 Knowledge: DA vs usual care ‐ treatment only.
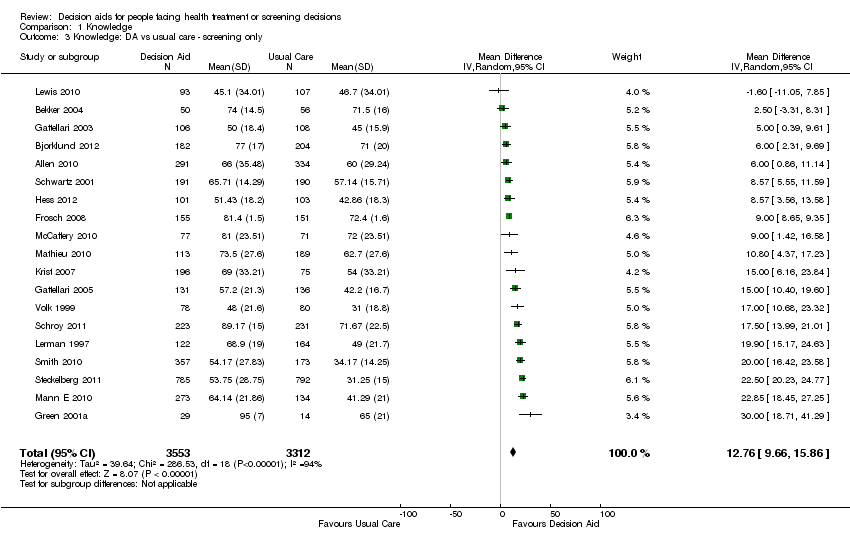
Comparison 1 Knowledge, Outcome 3 Knowledge: DA vs usual care ‐ screening only.

Comparison 1 Knowledge, Outcome 4 Knowledge: Detailed vs simple decision aids ‐ all studies.

Comparison 1 Knowledge, Outcome 5 Knowledge: Detailed vs simple decision aids ‐ treatment only.

Comparison 1 Knowledge, Outcome 6 Knowledge: Detailed vs simple decision aids ‐ screening only.

Comparison 2 Accurate risk perceptions: decision aid with outcome probabilities vs no outcome probability information, Outcome 1 Accurate risk perceptions ‐ all studies.

Comparison 2 Accurate risk perceptions: decision aid with outcome probabilities vs no outcome probability information, Outcome 2 Accurate risk perceptions ‐ treatments only.

Comparison 2 Accurate risk perceptions: decision aid with outcome probabilities vs no outcome probability information, Outcome 3 Accurate risk perceptions ‐ screening only.
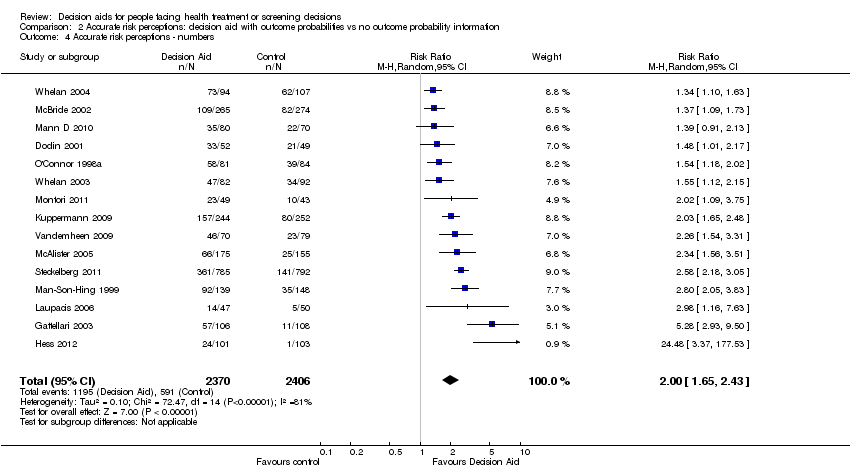
Comparison 2 Accurate risk perceptions: decision aid with outcome probabilities vs no outcome probability information, Outcome 4 Accurate risk perceptions ‐ numbers.

Comparison 2 Accurate risk perceptions: decision aid with outcome probabilities vs no outcome probability information, Outcome 5 Accurate risk perceptions ‐ words.
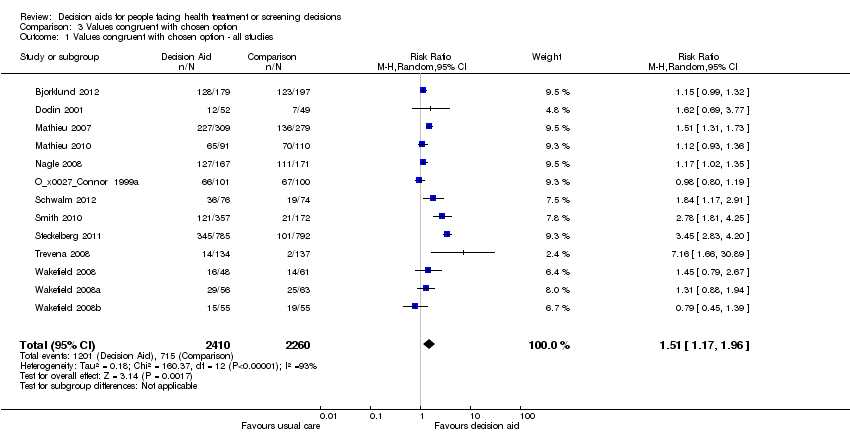
Comparison 3 Values congruent with chosen option, Outcome 1 Values congruent with chosen option ‐ all studies.

Comparison 3 Values congruent with chosen option, Outcome 2 Values congruent with chosen option ‐ treatment only.

Comparison 3 Values congruent with chosen option, Outcome 3 Values congruent with chosen option ‐ screening only.

Comparison 4 Decisional conflict, Outcome 1 Decisional conflict: DA vs usual care ‐ all studies.

Comparison 4 Decisional conflict, Outcome 2 Decisional conflict: DA vs usual care ‐ treatment only.

Comparison 4 Decisional conflict, Outcome 3 Decisional conflict: DA vs usual care ‐ screening only.
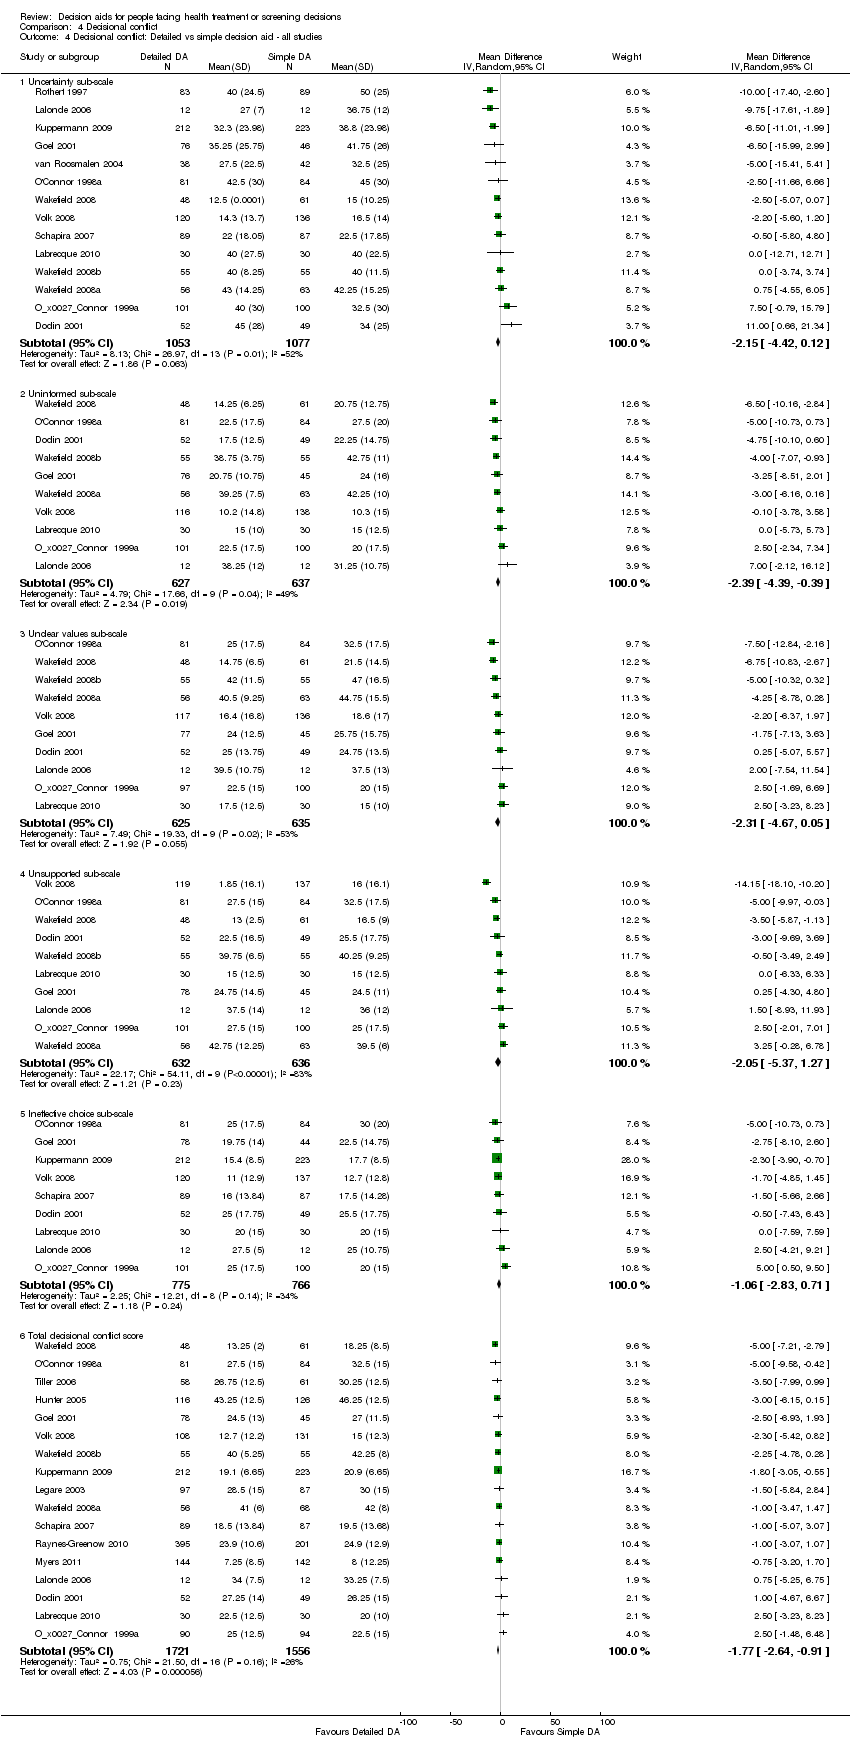
Comparison 4 Decisional conflict, Outcome 4 Decisional conflict: Detailed vs simple decision aid ‐ all studies.

Comparison 4 Decisional conflict, Outcome 5 Decisional conflict: Detailed vs simple decision aid ‐ treatment only.
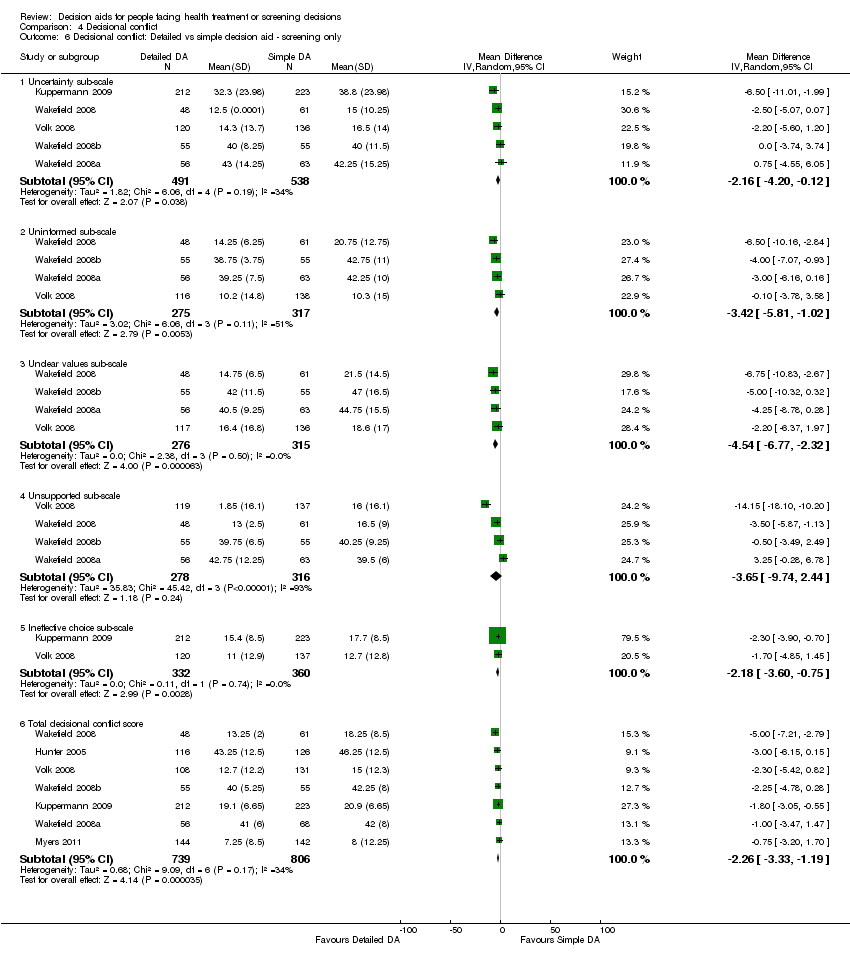
Comparison 4 Decisional conflict, Outcome 6 Decisional conflict: Detailed vs simple decision aid ‐ screening only.
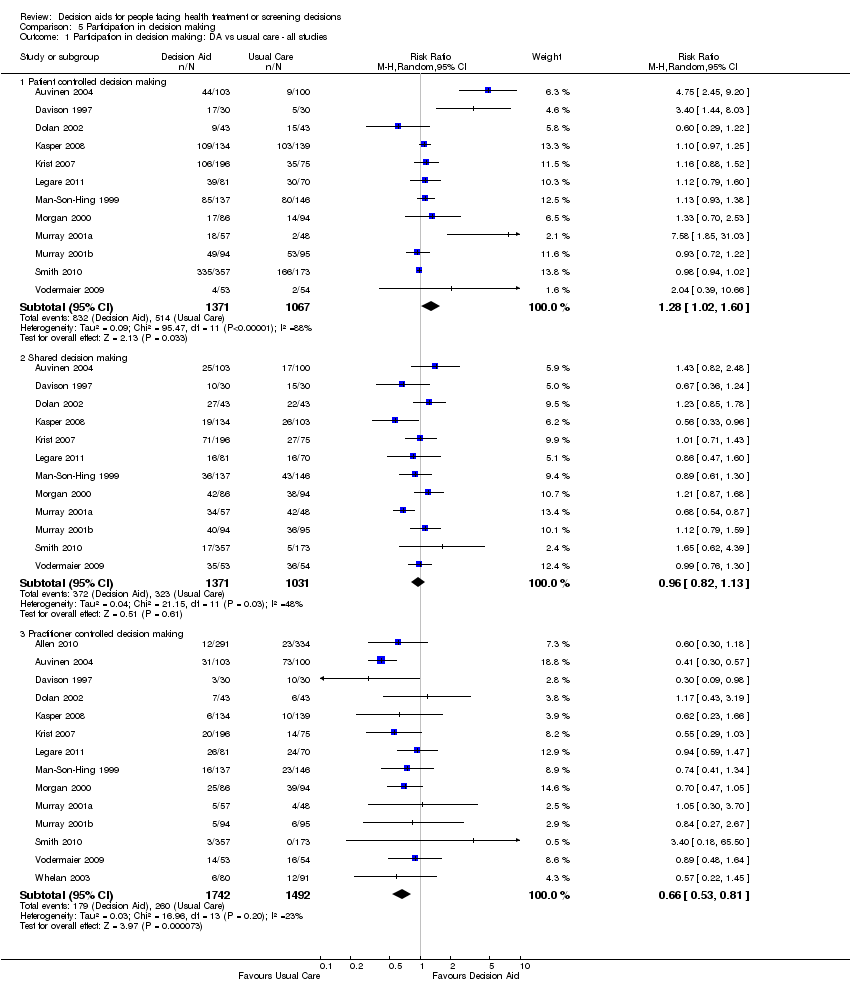
Comparison 5 Participation in decision making, Outcome 1 Participation in decision making: DA vs usual care ‐ all studies.

Comparison 5 Participation in decision making, Outcome 2 Participation in decision making: DA vs usual care ‐ treatment only.

Comparison 5 Participation in decision making, Outcome 3 Participation in decision making: DA vs usual care ‐ screening only.

Comparison 5 Participation in decision making, Outcome 4 Participation in decision making: Detailed vs simple decision aid ‐ all studies.

Comparison 5 Participation in decision making, Outcome 5 Participation in decision making: Detailed vs simple decision aid ‐ treatment only.
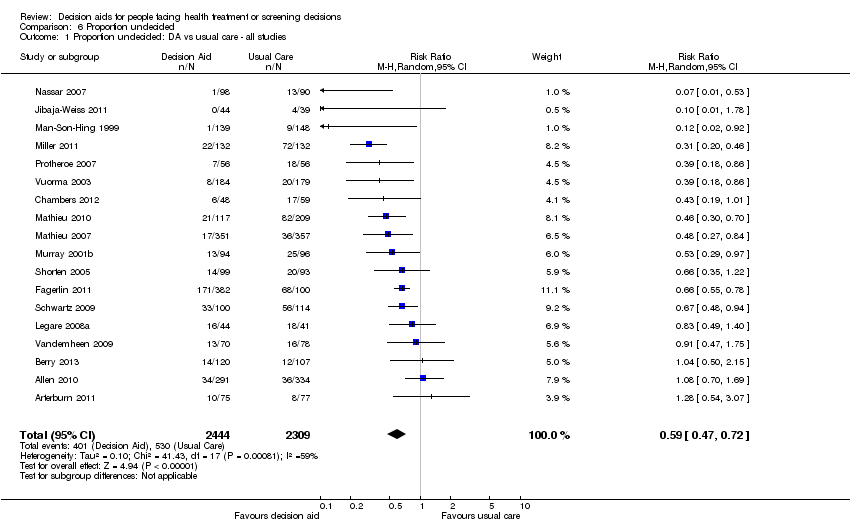
Comparison 6 Proportion undecided, Outcome 1 Proportion undecided: DA vs usual care ‐ all studies.
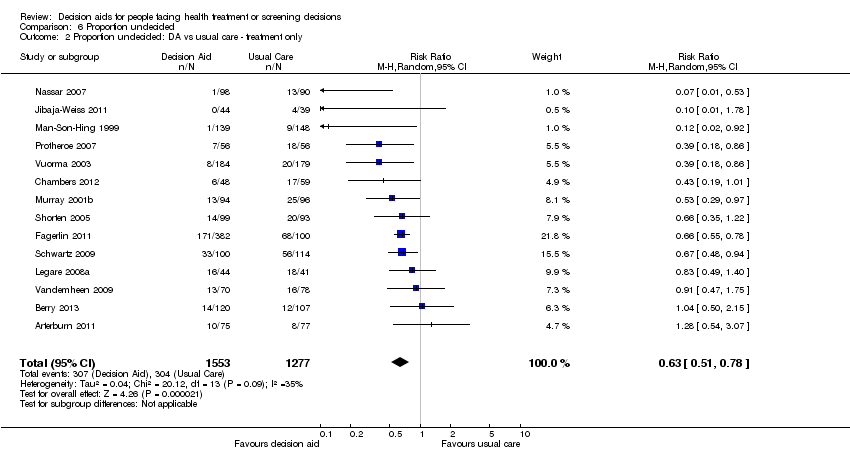
Comparison 6 Proportion undecided, Outcome 2 Proportion undecided: DA vs usual care ‐ treatment only.

Comparison 6 Proportion undecided, Outcome 3 Proportion undecided: DA vs usual care ‐ screening only.
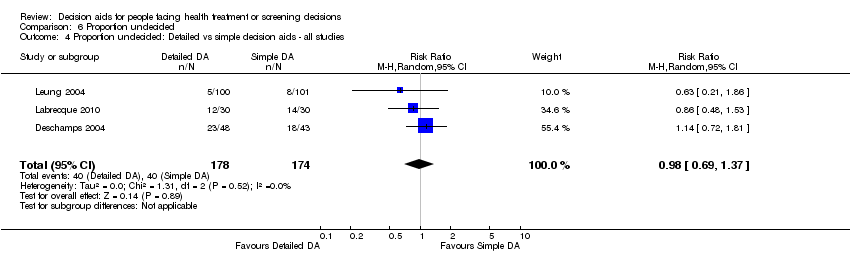
Comparison 6 Proportion undecided, Outcome 4 Proportion undecided: Detailed vs simple decision aids ‐ all studies.
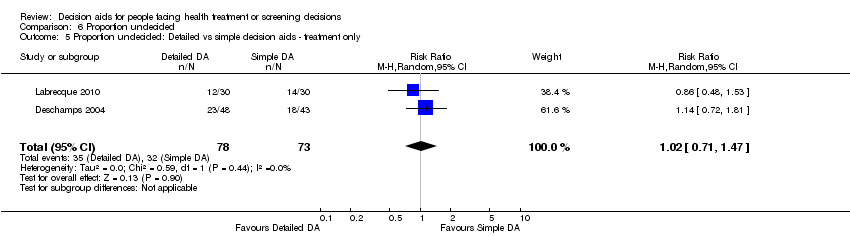
Comparison 6 Proportion undecided, Outcome 5 Proportion undecided: Detailed vs simple decision aids ‐ treatment only.
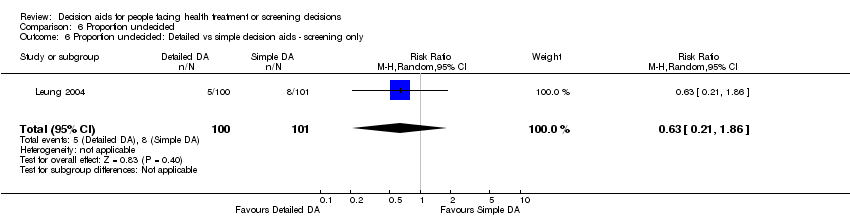
Comparison 6 Proportion undecided, Outcome 6 Proportion undecided: Detailed vs simple decision aids ‐ screening only.

Comparison 7 Satisfaction, Outcome 1 Satisfaction with the choice: DA vs usual care ‐ all studies.

Comparison 7 Satisfaction, Outcome 2 Satisfaction with the choice: DA vs usual care ‐ treatment only.

Comparison 7 Satisfaction, Outcome 3 Satisfaction with the choice: DA vs usual care ‐ screening only.

Comparison 7 Satisfaction, Outcome 4 Satisfaction with the choice: Detailed vs simple DA ‐ all studies.
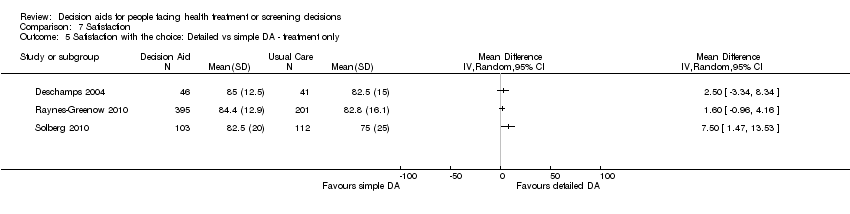
Comparison 7 Satisfaction, Outcome 5 Satisfaction with the choice: Detailed vs simple DA ‐ treatment only.
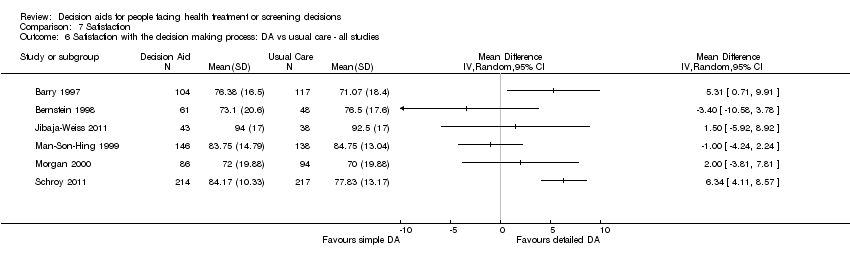
Comparison 7 Satisfaction, Outcome 6 Satisfaction with the decision making process: DA vs usual care ‐ all studies.

Comparison 7 Satisfaction, Outcome 7 Satisfaction with the decision making process: DA vs usual care ‐ treatment only.
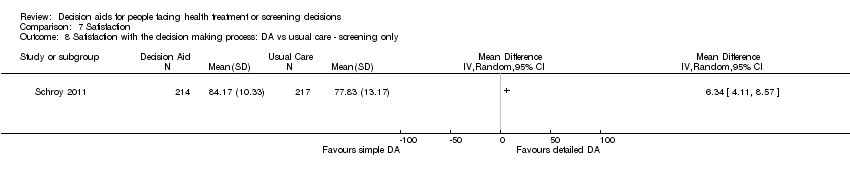
Comparison 7 Satisfaction, Outcome 8 Satisfaction with the decision making process: DA vs usual care ‐ screening only.
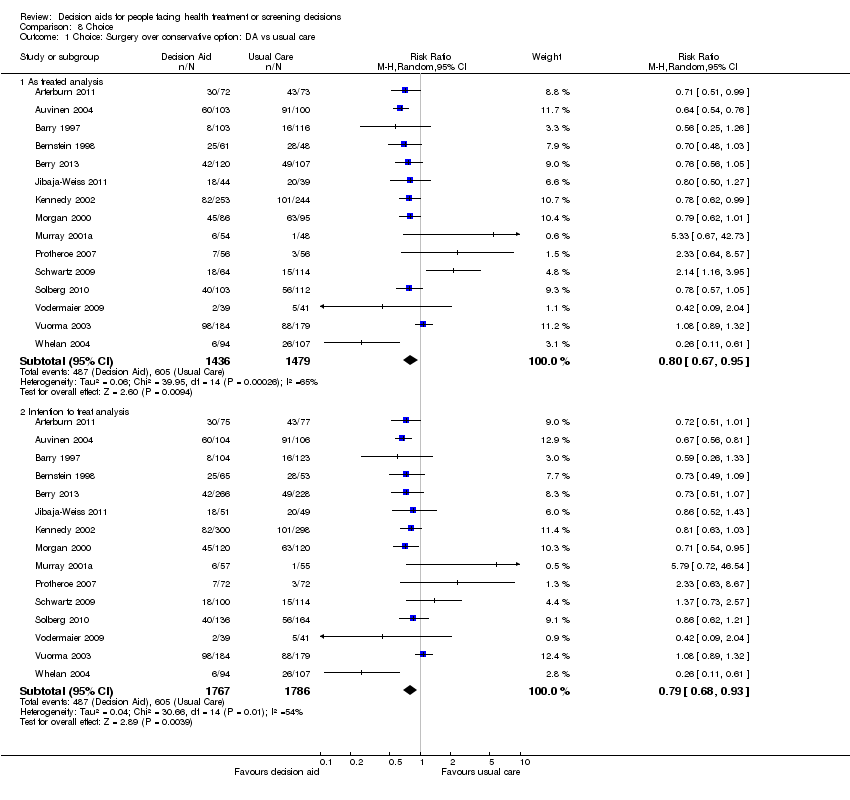
Comparison 8 Choice, Outcome 1 Choice: Surgery over conservative option: DA vs usual care.

Comparison 8 Choice, Outcome 2 Choice: Surgery over conservative option: Detailed vs simple decision aid.
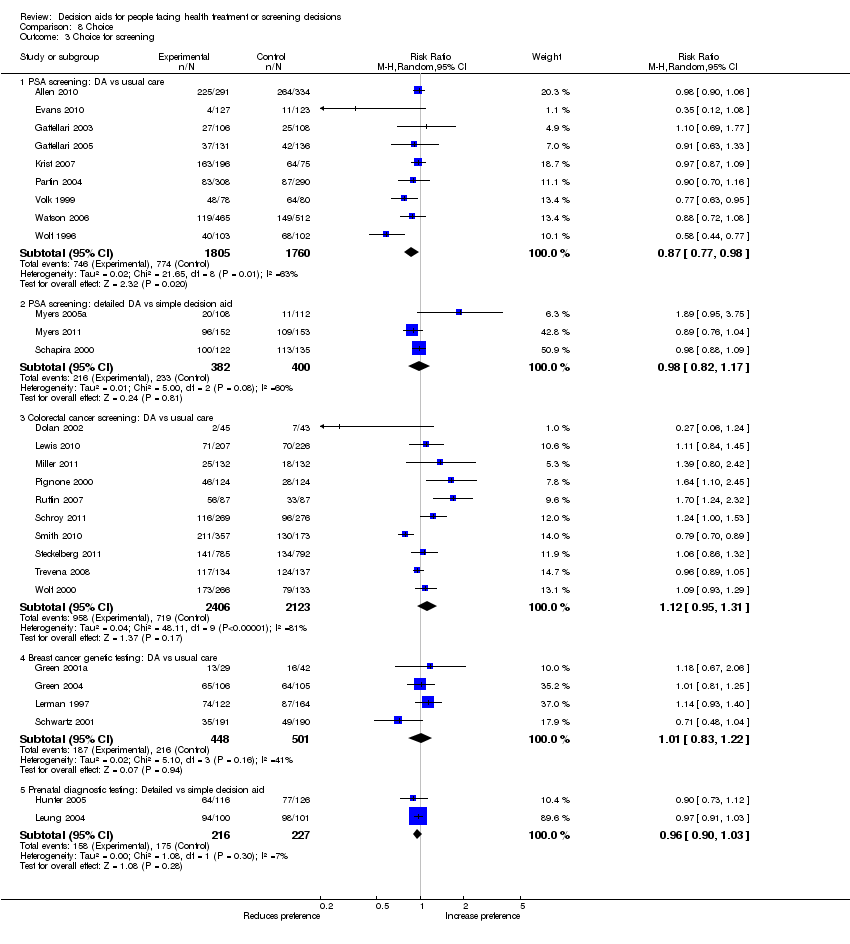
Comparison 8 Choice, Outcome 3 Choice for screening.
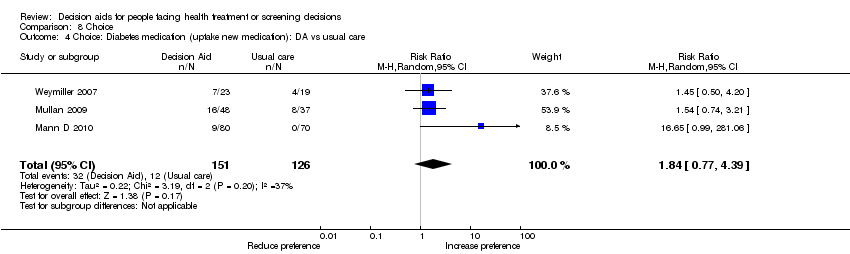
Comparison 8 Choice, Outcome 4 Choice: Diabetes medication (uptake new medication): DA vs usual care.

Comparison 8 Choice, Outcome 5 Choice: Menopausal hormone therapy: Detailed vs simple decision aid.
| Patient decision aids compared with usual care for adults considering treatment or screening decisions | ||||||
| Patient or population: adults considering treatment or screening decisions Settings: all settings Intervention: patient decision aid Comparison: usual care | ||||||
| Outcomes | Illustrative comparative benefits* (95% CI) | Relative effect | No of Participants | Quality of the evidence | Comments | |
| Assumed benefit | Corresponding benefit | |||||
| Usual care | Patient decision aid | |||||
| Knowledge: decision aid versus usual care ‐ all studies standardized on score from 0 (no knowledge) to 100 (perfect knowledge) [soon after exposure to the decision aid] | The mean knowledge score was 56.9% ranged across control groups from 31% to 85.2% | The mean knowledge score in the intervention groups was 13.34 higher (11.17 to 15.51 higher) | 10,842 | ⊕⊕⊕⊕ | Higher scores indicate better knowledge. 41 out of 42 studies showed an improvement in knowledge. | |
| Accurate risk perceptions ‐ all studies [soon after exposure to the decision aid] | 296 patients per 1000 | 542 patients per 1000 | RR 1.82 (95% CI: 1.52 to 2.16) | 5868 | ⊕⊕⊕⊝ | |
| Congruence between the chosen option and their values ‐ all studies [soon after exposure to the decision aid] | 316 patients per 1000 | 498 patients per 1000 | RR 1.51 (95% CI: 1.17 to 1.97) | 4670 (13 studies) | ⊕⊕⊝⊝ | |
| Decisional conflict: decision aid versus usual care ‐ all studies ‐ Uninformed sub‐scale standardized on score from 0 (not uninformed) to 100 (uninformed) [soon after exposure to the decision aid] | The mean feeling uninformed ranged across control groups from 12.75 to 49.1. Scores of 25 or lower are associated with follow‐through with decisions; whereas scores that exceed 38 are associated with delay in decision making | The mean feeling uninformed in the intervention groups was 7.26 lower (9.73 to 4.78 lower) | 4343 (22 studies) | ⊕⊕⊕⊕ | Lower scores indicate feeling more informed. | |
| Decisional conflict: decision aid versus usual care ‐ all studies ‐ Unclear values sub‐scale standardized on score from 0 (not unclear) to 100 (unclear) [soon after exposure to the decision aid] | The mean feeling unclear values ranged across control groups from 15.5 to 51.29. Scores of 25 or lower are associated with follow‐through with decisions; whereas scores that exceed 38 are associated with delay in decision making | The mean feeling unclear values in the intervention groups was 6.09 lower (8.50 to 3.67 lower) | 3704 (18 studies) | ⊕⊕⊕⊕ | Lower scores indicate feeling more clear about values | |
| Participation in decision making: decision aid versus usual care ‐ all studies ‐ Practitioner controlled decision making [soon after consultation with practitioner] | 174 patients per 1000 | 103 patients per 1000 | RR 0.66 (95%CI: 0.53 to 0.81) | 3234 | ⊕⊕⊕⊝ | Patient decision aids aim to increase patient involvement in making decisions. Lower proportion of practitioner controlled decision making is better. |
| *The basis for the assumed risk (e.g. the median control group risk across studies) is provided in footnotes. The corresponding risk (and its 95% confidence interval) is based on the assumed risk in the comparison group and the relative effect of the intervention (and its 95% CI). | ||||||
| GRADE Working Group grades of evidence | ||||||
| 1. The vast majority of studies measuring this outcome were not at high risk of bias. 2.The GRADE rating was downgraded given the lack of precision. 3.The GRADE rating was downgraded given the lack of consistency. 4.The GRADE rating was downgraded given the lack of directness. | ||||||
| Study | Topic | Availability | Source | Contact Information |
| Prostate cancer screening | No | Allen,Center for Community‐Based Research, Dana‐Farber Cancer Institute, Boston, MA, US, 2010 | requested access | |
| Bariatric surgery | Yes | Informed Medical Decisions Foundation, MA,US, 2010 | informedmedicaldecisions.org/imdf_decision_aid/making‐decisions‐about‐weight‐loss‐surgery/ | |
| Prostate cancer treatment | Yes | Auvinen, Helsinki, Finland, 1993 | included in publication | |
| Benign prostate disease treatment | Yes | Informed Medical Decisions Foundation, MA,US, 2001 | informedmedicaldecisions.org/imdf_decision_aid/treatment‐options‐for‐benign‐prostatic‐hyperplasia/ | |
| Prenatal screening | Yes | Bekker, Leeds, UK, 2003 | included in publication | |
| Ischaemic heart disease treatment | Yes | Informed Medical Decisions Foundation, MA,US, 2002 | informedmedicaldecisions.org/imdf_decision_aid/treatment‐choices‐for‐carotid‐artery‐disease/ | |
| Prostate cancer treatment | No | Berry, Phyllis F. Cantor Center, MA, USA, 2011 | ||
| Antenatal Down syndrome screening | Yes | Södersjukhuset, Department of Obstetrics and Gynecology, Stockholm, Sweden | vimeo.com/34600615/ | |
| Healthcare personnel’s influenza immunization | Yes | A McCarthy. Ottawa Influenza Decision Aid Planning Group, CA, 2008 | decisionaid.ohri.ca/decaids.html#oida | |
| Hepatitis B Vaccine | No | Clancy, Richmond VA, US, 1983 | ||
| Prostate cancer treatment | No | Davison, Manitoba CA, 1992‐1996 | ||
| Total | Yes | Informed Medical Decisions Foundation, MA,US | informedmedicaldecisions.org/imdf_decision_aid/treatment‐choices‐for‐knee‐osteoarthritis/ | |
| Hormone replacement therapy | No | O'Connor, Ottawa, CA, 1996 | decisionaid.ohri.ca/decaids‐archive.html | |
| Back surgery | Yes | Informed Medical Decisions Foundation, MA,US, 2001 | informedmedicaldecisions.org/imdf_decision_aid/managing‐chronic‐low‐back‐pain/ | |
| Hormone replacement therapy | No | O'Connor, Ottawa, CA, 1996 | decisionaid.ohri.ca/decaids‐archive.html | |
| Colon cancer screening | No | Dolan, Rochester NY, US, 1999 | ||
| Prostate cancer screening | Yes | Elwyn, Cardiff, UK | www.prosdex.com | |
| Breast cancer prevention | Yes | Fagerlin, Ann Arbor, MI, US | ||
| Osteoarthritis knee treatment | No | Fraenkel, New Haven CT, US | author said DA never fully developed, all info in paper | |
| Prostate cancer screening | No | Frosch, Los Angeles, US | Screenshots from author | |
| Prostate cancer screening | Yes | Gatellari , Sydney, AU, 2003 | included in publication | |
| Prostate cancer screening | Yes | Gatellari , Sydney, AU, 2003 | included in publication | |
| Breast cancer surgery | No | Goel/Sawka, Toronto CAN, 2001 | ||
| Breast cancer genetic testing | Yes | Green, Hershey PA, US, 2000 | 1‐800‐757‐4868 [email protected] | |
| Breast cancer genetic testing | Yes | Green, Hershey PA, US, 2000 | 1‐800‐757‐4868 [email protected] | |
| Schizophrenia treatment | Yes | Hamann, Munich, GER | emailed by author (in German) | |
| Feeding options in advanced | Yes | Mitchell, Tetroe, O'Connor; 2001 (updated 2008) | decisionaid.ohri.ca/decaids.html#feedingtube | |
| Breast reconstruction | Yes | University of Texas M.D. Anderson Cancer Center, Houston TX, US, 2003 | Disc mailed | |
| Stress testing for chest pain | Yes | Hess, Rochester, MN, US, 2012 | Included in publication | |
| Prenatal screening | No | Hunter, Ottawa, CA, 2000 | decisionaid.ohri.ca/decaids‐archive.html | |
| Breast cancer treatment | Yes | Jibaja‐Weiss, Baylor College of Medicine, 2010 | www.bcm.edu/patchworkoflife | |
| Endodontic treatment | Yes | Johnson, Chicago, US, 2004 | Included in publication | |
| Multiple Sclerosis | No | Jürgen Kasper | ||
| Abnormal uterine bleeding treatment | No | Kennedy/Coulter, London UK, 1996 | ||
| Prostate cancer screening | Yes | Krist, Fairfax VA, US | www.familymedicine.vcu.edu/research/misc/psa/index.html | |
| Prenatal screening | No | Kuppermann, San Francisco CA, US | Computerized tool | |
| Vasectomy | Yes | Labrecque, Quebec City, CA, 2010 | www.vasectomie.net (in French) | |
| Cardiovascular health treatment | No | Lalonde, Ottawa, CA, 2002 | decisionaid.ohri.ca/decaids‐archive.html | |
| Contraceptive method choice | Yes | World Health Organization, 2005 | www.who.int/reproductivehealth/publications/family_planning/9241593229index/en/index.html | |
| Pre‐operative autologous blood donation | No | Laupacis, Ottawa, CA, 2001 | decisionaid.ohri.ca/decaids‐archive.html | |
| Hormone replacement therapy | No | O'Connor, Ottawa, CA, 1996 | decisionaid.ohri.ca/decaids‐archive.html | |
| Natural health products | No | Legare, Quebec City, CA, 2006 | ||
| Use of antibiotics for acute | Yes | Legare, Quebec City, CA, 2007 | www.decision.chaire.fmed.ulaval.ca/index.php?id=192&L=2 | |
| Advanced colorectal cancer chemotherapy | Yes | Princess Margaret Hospital, Toronto, 2011 | ||
| Breast cancer genetic testing | No | Lerman/Schwartz, Washington DC, US, 1997 | ||
| Prenatal screening | No | Leung, Hong Kong, China, 2001 | ||
| Colorectal cancer | Yes | Lewis, University of North Carolina, Chapel Hill, NC, USA, 2010 | decisionsupport.unc.edu/CHOICE6/ | |
| Depression treatment | Yes | Loh, Freiburg, GER | (emailed to us by author ‐ in German) | |
| Atrial fibrillation treatment | No | McAlister/Laupacis, Ottawa CA, 2000 | decisionaid.ohri.ca/decaids‐archive.html | |
| Diabetes treatment ‐ statins | Yes | Montori, Rochester MN, US | mayoresearch.mayo.edu/mayo/research/ker_unit/form.cfm | |
| Diabetes | Yes | Marteau, King's College London, London, England, 2010 | Additional file 2 of publication | |
| Diabetes | Yes | Marteau, King's College London, London, England, 2010 | Provided by author, same DA as Mann E 2010 | |
| Mammography | Yes | Mathieu, Sydney, AU, | DA emailed by author | |
| Mammography | Yes | Mathieu, University of Sydney, AUS, 2010 | http://www.psych.usyd.edu.au/cemped/com_decision_aids.shtml | |
| Atrial fibrillation treatment | No | McAlister/Laupacis, Ottawa CAN, 2000 | decisionaid.ohri.ca/decaids‐archive.html | |
| Hormone replacement therapy | Yes, update in progress | Sigler/Bastien, Durham NC, US, 1998 | ||
| Screening after mildly abnormal pap smear | Yes | Screening & test evaluation program, School of public health, University of Sydney 2007 | ||
| BRCA1/BRCA2 gene testing | No | Miller, Fox Chase PA, US | ||
| Colorectal | Yes | University of North Carolina, Chapel Hill, NC, USA, 2007 | intmedweb.wakehealth.edu/choice/choice.html (no longer available) | |
| Hypertension treatment | No | Montgomery, UK, 2000 | ||
| Birthing options after caesarean | Yes | Montgomery, Bristol, UK, last update 2004 | www.computing.dundee.ac.uk/acstaff/cjones/diamond/Information.html | |
| Osteoporosis treatment | Yes | Montori, Mayo Foundation for Medical Education and Research, 2007 | shareddecisions.mayoclinic.org/decision‐aids‐for‐diabetes/other‐decision‐aids/ | |
| Ischaemic heart disease treatment | Yes | Informed Medical Decisions Foundation, MA,US, 2002 | informedmedicaldecisions.org/imdf_decision_aid/treatment‐choices‐for‐carotid‐artery‐disease/ | |
| Diabetes treatment | Yes | Montori or Mayo Foundation?, Rochester MN, US, | included in publication | |
| Benign prostate disease treatment | Yes | Informed Medical Decisions Foundation, MA,US, 2001 | informedmedicaldecisions.org/imdf_decision_aid/treatment‐options‐for‐benign‐prostatic‐hyperplasia/ | |
| Hormone replacement therapy | No, update in progress | Informed Medical Decisions Foundation, MA,US | informedmedicaldecisions.org/imdf_decision_aid/treatment‐choices‐for‐managing‐menopause/ | |
| Prostate cancer screening | No | Myers, Philadelphia PA, US, 1999 | ||
| Prostate cancer screening | Yes | Myers, Philadelphia PA, 1999 | ||
| Prenatal screening | Yes | Nagle, Victoria, AU | www.mcri.edu.au/Downloads/PrenatalTestingDecisionAid.pdf | |
| Birth breech presentation | Yes | Nassar, West Perth WA, AU | sydney.edu.au/medicine/public‐health/shdg/resources/decision_aids.php | |
| Hormone replacement therapy | No | O'Connor, Ottawa CA, 1996 | decisionaid.ohri.ca/decaids‐archive.html | |
| Hormone replacement therapy | No | O'Connor, Ottawa CA, 1996 | decisionaid.ohri.ca/decaids‐archive.html | |
| Osteoporosis treatment | No | Cranney, Ottawa CA, 2002 | decisionaid.ohri.ca/decaids‐archive.html | |
| Breast cancer prevention | No | Ozanne, Boston MA, US, | ||
| Prostate cancer screening | Yes | Informed Medical Decisions Foundation, MA,US, 2001 | informedmedicaldecisions.org/imdf_decision_aid/deciding‐if‐the‐psa‐test‐is‐right‐for‐you/ | |
| Colon cancer screening | Yes | Pignone, Chapel Hill NC, US, 1999 | www.med.unc.edu/medicine/edusrc/colon.htm | |
| Menorrhagia treatment | No | Protheroe, Manchester, UK | computerized decision aid, Clinical Guidance Tree ‐ no longer in existence, author sent chapter in thesis | |
| Labour | Yes | Raynes‐Greenow, Sydney,Australia, 2004 | http://www.psych.usyd.edu.au/cemped/com_decision_aids.shtml | |
| Hormone replacement therapy | No | O'Connor, Ottawa CA, 1996 | decisionaid.ohri.ca/decaids‐archive.html | |
| Hormone replacement therapy | No, update in progress | Rothert, East Lansing MI, US, 1999 | ||
| Prostate cancer screening | No | Centers for Disease Control and Prevention (CDC), US, 2010 | [No longer available] | |
| Colorectal cancer screening | Yes | Regents of the University of Michigan (copyright info), Ann Arbor MI, US, 2006 | colorectalweb.org | |
| Prostate cancer screening | Yes | Schapira, Milwaukee WI, US, 1995 | ||
| Hormone replacement therapy | Yes | Schapira, Milwaukee WI, US | computer‐based DA | |
| Colorectal | Yes | Schroy III, Boston, USA | ||
| Coronary angiogram access site | Yes | Schwalm, Hamilton, ON, Canada, 2009 | http://www.phri.ca/workfiles/studies/presentations/PtDA%20Vascular%20Access%2023‐May‐2012.pdf | |
| Breast cancer genetic testing | No | Schwartz/Lerman, Washington DC, US, 1997 | ||
| BRCA mutation prophylactic surgery | No | Schwartz, Washington DC, US | ||
| Cardiovascular prevention | Yes | Sheridan, Chapel Hill, NC, US | http://www.med‐decisions.com/cvtool/ | |
| Coronary heart | Yes | Sheridan, University of North Carolina at Chapel Hill, Division of General Internal Medicine, North Carolina, US, 2011 | http://www.med‐decisions.com/h2hv3/ | |
| Birthing options after previous caesarean | Yes (updated 2006) | Shorten, Wollongong, AU, 2000 | [email protected] or www.capersbookstore.com.au/product.asp?id=301 | |
| Bowel | Yes | Smith, Sydney, AU 2008 | sydney.edu.au/medicine/public‐health/shdg/resources/decision_aids.php | |
| Uterine fibroid treatment | Yes | Informed Medical Decisions Foundation, MA,US, 2006 | informedmedicaldecisions.org/imdf_decision_aid/treatment‐choices‐for‐uterine‐fibroids/ | |
| Colorectal cancer screening | Yes | Steckelberg, Hamburg, Germany | ||
| Breast cancer surgery | No | Street, College Station TX, US, 1995 | ||
| Atrial fibrillation treatment | Yes | Thomson, Newcastle Upon Thyne, UK | disc sent by mail | |
| Ovarian cancer risk management | No | Tiller, Randwick NSW, AU | ||
| Colorectal cancer screen | Yes | Trevena, Sydney, AU | sydney.edu.au/medicine/public‐health/shdg/resources/decision_aids.php | |
| Embryos transplant | Yes | Radboud University Nijmegen Medical Centre; 2006 | www.umcn.nl/ivfda‐en | |
| Cystic Fibrosis referral transplant | Yes | Aaron, Ottawa ON, CA, 2009 (last update 2011) | decisionaid.ohri.ca/decaids.html#cfda | |
| BRCA1/2 mutation: prophylactic surgery | Yes | vanRoosmalen, Netherlands, 1999 | see publication | |
| Breast cancer surgery | Yes | Vodermaier, Vancouver BC, CA | received by email (in German) | |
| Prostate cancer screening | Yes | Informed Medical Decisions Foundation, MA,US, 1999 | informedmedicaldecisions.org/imdf_decision_aid/deciding‐if‐the‐psa‐test‐is‐right‐for‐you/ | |
| Prostate cancer screening | No | Volk, Houston TX, US | ||
| Menorrhagia treatment | No | Vuorma, Helsinki Finland, 1996 | ||
| Colorectal cancer screening | Yes | Wakefield, Sydney, AU, | www.genetics.edu.au/Information/PublicationsBrochuresandPamphlets/Understanding%20Genetic%20Tests%20for%20Lynch%20Syndrome | |
| Breast cancer genetic testing | Yes | Wakefield, Sydney, AU, | ||
| Breast cancer genetic testing | Yes | Wakefield, Sydney, AU, | ||
| Prostate cancer screening | Yes | Oxford, UK | included in publication | |
| Diabetes mellitus type 2 treatment | Yes | Montori, Rochester MN, US | mayoresearch.mayo.edu/mayo/research/ker_unit/form.cfm | |
| Breast cancer chemotherapy | Yes | Whelan, Hamilton CA, 1995 | included in publication | |
| Breast cancer surgery | Yes | Whelan, Hamilton CA, 1997 | included in publication | |
| Prostate cancer screening | Yes | Wolf, Charlottesville VA, US, 1996 | Script in publication | |
| Colon cancer screening | Yes | Wolf, Charlottesville VA, US, 2000 | Script in publication | |
| Pregnancy termination | No | Bekker, Leeds, UK, 2002 |
| Outcome | Knowledge | Accurate risk perception | Value‐choice agreement | Uninformed | Unclear values | Participation ‐ practitioner controlled | |
| Total studies | n = 42 | n = 19 | n = 13 | n = 22 | n = 18 | n = 14 | |
| Random sequence generation | low | 35 (83.3%) | 8 (42.1%) | 7 (53.8%) | 19 (86.4%) | 17 (94.4%) | 12 (87.7%) |
| unclear | 7 (16.7%) | 11 (57.9%) | 6 (46.2%) | 3 (13.6%) | 1 (5.6%) | 2 (14.3%) | |
| high | 0 | 0 | 0 | 0 | 0 | 0 | |
| Allocation concealment | low | 30 (71.4%) | 12 (63.2%) | 11 (84.6%) | 20 (90.9%) | 17 (94.4%) | 10 (71.4%) |
| unclear | 12 (28.6%) | 7 (36.8%) | 2 (15.4%) | 2 (9.1%) | 1 (5.6%) | 4 (28.6%) | |
| high | 0 | 0 | 0 | 0 | 0 | 0 | |
| Incomplete outcome data | low | 26 (61.9%) | 11 (57.9%) | 11 (84.6%) | 15 (68.2%) | 13 (72.2%) | 10 (71.4%) |
| unclear | 16 (38.1%) | 8 (42.1%) | 2 (15.4%) | 7 (31.8%) | 5 (27.8%) | 4 (28.6%) | |
| high | 0 | 0 | 0 | 0 | 0 | 0 | |
| Selective reporting | low | 15 (35.7%) | 7 (36.8%) | 6 (46.2%) | 9 (40.9%) | 8 (44.4%) | 4 (28.6%) |
| unclear | 27 (64.3%) | 12 (63.2%) | 7 (53.8%) | 13 (59.1%) | 10 (55.6%) | 10 (71.4%) | |
| high | 0 | 0 | 0 | 0 | 0 | 0 | |
| Other bias | low | 34 (81.0%) | 14 (73.7%) | 11 (84.6%) | 19 (86.4%) | 17 (94.4%) | 11 (78.6%) |
| unclear | 7 (16.7%) | 5 (26.3%) | 2 (15.4%) | 3 (13.6%) | 1 (5.6%) | 3 ( 21.4%) | |
| high | 1 (2.4%) | 0 | 0 | 0 | 0 | 0 | |
| Blinding of participants and personnel | low | 9 (21.4%) | 1 (5.3%) | 2 (15.4%) | 3 (13.6%) | 2 (11.1%) | 2 (14.3%) |
| unclear | 31 (73.8%) | 17 (89.5%) | 11 (84.6%) | 18 (81.8%) | 15 (83.3%) | 9 (64.3%) | |
| high | 2 (4.8%) | 1 (5.3%) | 0 | 1 (4.5%) | 1 (5.6%) | 3 (21.4%) | |
| Blinding of outcome assessment | low | 41 (97.6%) | 19 (100%) | 13 (100%) | 22 (100%) | 18 (100%) | 13 (92.9%) |
| unclear | 1 (2.4%) | 0 | 0 | 0 | 0 | 1 (7.1%) | |
| high | 0 | 0 | 0 | 0 | 0 | 0 | |
| Study | Scale used | Timing | N Decision aid | Decision aid ‐ mean | N Comparison | Comparison ‐ mean | Notes |
| DA versus usual care | |||||||
| 12 true or false questions; scores ranging from ‐12 to +12 | immediately post | 89 | 4.9 | 103 | 2.17 | P < 0.001 | |
| 7‐item multiple choice knowledge test (unable to standardize results) | on discharge (˜ 1 month) | 49 | 15 (4.4 SD) | 58 | 10.9 (5.4 SD) | P = 0.01 | |
| 12‐item multiple choice | pre‐operatively | 66 | 14%* | 67 | 8%* | *mean increase from baseline P = 0.02 | |
| 10‐item yes/no/unsure general knowledge test about natural health products (not specific to outcomes of options) | change scores from baseline to 2 weeks | 43 | 0.86 ± 1.77 P = 0.002 | 41 | 0.51 ± 1.47 P = 0.031 | No difference between groups (P = 0.162) | |
| 14 items survey | immediately post | No difference in level of knowledge between groups | |||||
| 9 item ‐ 4 concept questions and 5 numeric questions | 351 | 357 | Significantly higher mean increase for the intervention group (2.62 ) compared to control group (0.68) from baseline, P < 0.001 | ||||
| 8 items survey | 2‐week, 2‐month, and 6‐month follow‐ups | Intervention type had no impact on general or specific knowledge | |||||
| Good level knowledge was scored higher than the mid point of the knowledge scale (greater than 4) | 88% (147/167) in DA group compared to 72% (123/171) pamphlet group. Odds ratio (3.43 95%CI 1.79 to 6.58) | ||||||
| Change in knowledge from baseline | post‐test | 15 | 48% to 64% | 15 | 45% to 57% | change in knowledge score was significant for decision aid (P = 0.01) but not control (P = 0.13) | |
| 10‐item knowledge index score | 2 weeks | 308 | 7.44 | 290 | 6.9 | P = 0.001 | |
| 24‐items adapted from existing prostate cancer knowledge measures | immediately post | 100 | 100 | the total mean standardized knowledge score was 84.38 (SD 12.38). | |||
| Adequate knowledge (positive score: understanding benefits/harms) | 1 month | 134 | 28/134 | 137 | 8/137 | P = 0.0001 | |
| 12‐item true/false/don't know | post‐test | 468 | 75% (range 0 to 100) | 522 | 25% (range 0 to 100) | P < 0.0001 | |
| 14‐item ‐ 9 addressed by decision aid; 5 were not | immediately post | 52 | 46 | Mean difference between groups 2.4 (95% CI 1.5 to 3.3) P < 0.05 (when decision aid administered during the consultation only ‐ not if prior to the consultation) | |||
| Detailed versus simple DA | |||||||
| 2 weeks | 233 | 223 | Significant improvement in knowledge with no difference between groups (entertainment decision aid or audio‐booklet) | ||||
| CI: confidence interval; DA: decision aid; SD: standard deviation | |||||||
| Study | Scale used | Timing | N Decision aid | Decision aid ‐ mean | N Comparison | Comparison ‐ mean | Notes |
| DA versus usual care | |||||||
| Expectation of benefit index 11 items score from 1 to 4 with lower score indicating better knowledge | post (after reviewing DA) | 127 | 2.3 | 129 | 2.6 | P = 0.001 | |
| 3 of 8 multiple choice items in the knowledge test (question 4, 5, 7) | 2 weeks post | total knowledge reported only | |||||
| 5 item numerical questions (max = 5) | post | 113 | 3.02 | 189 | 2.45 | P < 0.001 | |
| 2‐week, 2‐month, and 6‐month follow‐ups | Intervention type had no impact on risk perceptions | ||||||
| 8 numerical questions (max = 8) | 357 | 2.93 (SD 2.91) | 173 | 0.58 (SD1.28) | P < 0.001 | ||
| immediately | 52 | 46 | Difference between group OR 22.4 (95% CI 5.9 to 85.8) when decision aid administered during the consultation only (not if prior to) OR 6.7 (95% CI 2.2 to 19.7) when the decision aid administered prior to or during the consultation | ||||
| CI: confidence interval; DA: decision aid; OR: odds ratio; SD: standard deviation | |||||||
| Study | Scale used | Timing | N Decision aid | Decision aid ‐ mean | N Comparison | Comparison ‐ mean | Notes |
| DA versus usual care | |||||||
| Percent match procedures described by Sepucha et al (2007; 2008). For values items were most predictive and used to specify logistic models to estimate predicted probability of selecting surgery > 0.5. | post intervention | 75 | 77 | The intervention group experienced a more rapid early improvement in value concordance immediately after the intervention compared to control, see Figure 2. | |||
| Concordance between patient's preferences and values for potential outcomes related to the decision and the choice made | within weeks | 155 | 151 | Men assigned to the decision aid who chose not to have a PSA test rated their concern about prostate cancer lower than did men who requested a PSA test. Men assigned to usual care provided similar ratings of concern about prostate cancer regardless of their PSA decision. There was no statistically significant difference between groups. | |||
| Women valuing of non chemical aspect of nature health products was positively associated with their choice of nature health products, P = 0.006. | |||||||
| Association between values and choice | ‐‐‐‐‐‐ | ‐‐‐‐‐‐ | ‐‐‐‐‐‐ | ‐‐‐‐‐‐ | ‐‐‐‐‐‐ | No difference; between group differences were not reported | |
| Congruence between personal values and decision | 3 weeks | 70 | 70 | Patient choices were consistent with their values across both randomised groups | |||
| Detailed versus simple DA | |||||||
| Correlation between expected utilities and their likelihood of taking hormones | ‐‐‐‐‐‐ | ‐‐‐‐‐‐ | ‐‐‐‐‐‐ | ‐‐‐‐‐‐ | ‐‐‐‐‐‐ | Simple DA showed lower correlations between expected value of hormones and likelihood of taking hormones than did more detailed DA | |
| My decision was consistent with my personal values. (Likert Scale, ranged from 1‐5) | 4‐5 weeks after intervention | 103 | 87.5 (SD 20) | 112 | 80 (SD 22.5) | P < 0.01 | |
| multi‐nomial logistic regression analysis | No significant difference between groups | ||||||
| DA: decision aid; SD: standard deviation | |||||||
| Study | Scale used | Timing | N Decision aid | Decision aid ‐ mean | N Comparison | Comparison ‐ mean | Notes |
| DA versus usual care | |||||||
| Total Decisional Conflict‐ change from baseline (standardised values) | immediately post | 75 | mean (‐20) SD (19.44) | 77 | mean (‐11.8) SD (22.83) | P = 0.03 | |
| Decisional conflict scale | uncertainty | ‐3.61 units | P = 0.04 | ||||
| uninformed | No significant difference | ||||||
| unclear values | ‐3.57 units | P = 0.002 | |||||
| unsupported | No significant difference | ||||||
| Ineffective decision | No significant difference | ||||||
| total | ‐1.75 units | P = 0.07 | |||||
| Decisional conflict scale | immediately post | DCS was higher in the intervention group compared to control, P < 0.001. | |||||
| Decisional conflict ‐ sub‐scales only | Feeling uninformed | 155 | 23.37 | 151 | 29.68 | P < 0.05 | |
| Feeling unclear values | 155 | 32.25 | 151 | 37.93 | P < 0.05 | ||
| Feeling supported | 155 | 30.51 | 151 | 35.21 | P < 0.05 | ||
| Feeling uncertain | 155 | 151 | No difference | ||||
| Effective decisions | 155 | 151 | No difference | ||||
| Decisional conflict | immediately after office visit | 196 | 1.54 | 75 | 1.58 | No difference | |
| Decisional conflict scale median (range) | 1‐2 weeks post intervention | 107 | 26 (range 0‐79) | 100 | 26 (range 0‐67) | No difference | |
| Based on approaches suggested by Marteau et al. (informed choice) | immediately after intervention | 91 | 71% | 110 | 64% | P = 0.24 | |
| Decisional conflict | post consultation | 15 | 15 | Both groups showed lower decisional conflict post‐consultation (P < 0.001) but no difference between groups | |||
| Decisional conflict | immediately post | The total mean score was 24.5 with a SD of 15.25 (n=200) | |||||
| Decisional conflict | 12 of 16 items of the original scale | Significant longitudinal impact of the decision aid was moderated by baseline decision status; decision aid led to significant decreases in decisional conflict for those who were undecided at the time of randomisation | |||||
| Decisional conflict | post consultation | 53 | 56 | Difference between decision aid and control group were ‐0.18 (95% CI ‐0.34 to ‐0.01). P = 0.036 | |||
| 3‐months post | 51 | 55 | Difference between decision aid and control group were ‐0.15 (95% CI ‐0.37 to 0.06), no significant difference. | ||||
| 15 item questionnaire (1‐5) ‐ satisfaction‐uncertainty | post intervention, pre IVF | 124 | 72.5 | 128 | 75 | P = 0.76 | |
| 15 item questionnaire (1‐5) ‐ informed (includes some items from DCS). | post intervention, pre IVF | 124 | 77.5 | 128 | 87.5 | P = 0.001 | |
| Decisional conflict | immediately post | 52 | 46 | Mean difference indicates statistically significantly lower decisional conflict for decision aid compared to usual care. Total DCS ‐10.6 (‐15.4 to ‐5.9) Uncertain ‐12.8 (‐18.4 to ‐7.3) Informed ‐17.3 (‐22.6 to ‐12.0) if administered during consult ‐6.6 (‐14.3 to ‐1.1) if administered prior to consult Values clarity ‐8.5 (‐15.7 to ‐1.3) Support ‐9.4 (‐14.8 to ‐3.9) Effective decision ‐10.0 (‐15.0 to ‐5.0) | |||
| CI: confidence interval; DA: decision aid; DCS: decisional conflict scale; IVF: in vitro fertilisation; SD: standard deviation | |||||||
| Study | Scale used | Timing | N Decision aid | Decision aid ‐ mean | N Comparison | Comparison ‐ mean | Notes |
| DA versus usual care | |||||||
| Total DCS | 2 week follow‐up | 357 | 13.63 (SD 20.55) | 173 | 14.91(SD 18.34) | P = 0.02 | |
| Detailed versus simple DA | |||||||
| Uncertainty | 2 weeks | 39 | 5.8 (SD 18.0) | 48 | 6.8 (SD 18.0) | P = 0.80 | |
| Informed | 2 weeks | 39 | 9.1 (SD 26.0) | 46 | 18.8 (SD 26.1) | P = 0.09 | |
| Values | 2 weeks | 40 | 17.4 (SD 36.8) | 48 | 34.9 (SD 36.6) | P = 0.03 | |
| Social Support | 2 weeks | 39 | 17.8 (SD 29.6) | 48 | 27.6 (SD 29.5) | P = 0.12 | |
| Total DCS | 2 weeks | 38 | 12.0 (SD 21.9) | 46 | 21.7 (SD 21.8) | P = 0.04 | |
| DA: decision aid; DCS: decisional conflict scale; SD: standard deviation | |||||||
| Study | Scale used | Timing | N Decision aid | Decision aid ‐ mean | N Comparison | Comparison ‐ mean | Notes |
| DA versus usual care | |||||||
| Discussed feeding with physician, nurse practitioner, or physician's assistant | 3 months | 126 | 46% | 127 | 33% | P = 0.04 | |
| Discussed feeding with other nursing home staff | 3 months | 126 | 64% | 127 | 71% | P = 0.42 | |
| OPTION scale | analysis of the consultation using video‐recorded consultations | 101 | Mean of 26.6 (95% CI 24.9 to 8.2) | 103 | Mean of 7% (95%CI 5.9 to 8.1) | Significantly greater in the intervention arm | |
| DCS / Dolan's Provider DCS | immediately post | Difference 0.26 (95%CI ‐0.06 to 0.53, P = 0.06) | |||||
| OPTION 100 point Scale | analysis of the consultation using video‐recorded consultations | 38 | 49.8 | 32 | 27.3 | P < 0.001 | |
| OPTION Scale | analysis of the consultation using video‐recorded consultations | 48 used decision aid within consultation | 49.7% (SD 17.74) | 37 usual care | 27.7% (SD 11.75 | MD 21.8 (95% CI 13.0, 30.5) for decision aid vs usual care. All but 2 of the 12 items significantly | |
| Discussed CHD with doctor | patient reported immediately post | 16/41 decision aid pre‐consult with summary report to bring to consult |
| 8/34 usual care |
| absolute difference 16%; 95% CI | |
| Plan to reduce CHD risk & discussed with doctor | patient reported immediately post | 15/41 decision aid pre‐consult with summary report to bring to consult |
| 8/34 usual care |
| absolute difference 13%; 95% CI ‐7% to 34%). | |
| Plan to reduce CHD risk & not discussed with doctor | patient reported immediately post | 37/41 decision aid pre‐consult with summary report to bring to consult |
| 25/34 usual care | absolute difference 16%; 95% CI | ||
| OPTION Scale | analysis of the consultation using video‐recorded consultations | 1/2 used decision aid prior to consult and 1/2 used it during consult | usual care | Greater patient participation (MD 4.4; 95% CI 2.9 to 6.0) in decision aid compared to usual care | |||
| Detailed versus simple DA | |||||||
| Agreement between women’s and physicians’ decisional conflict scores | immediately post | 87 | ICC = 0.44 (95% CI 0.25 to 0.59) | 80 | ICC = 0.28 (95% CI 0.06 to 0.47) | Agreement measure was higher for the DA group. | |
| DCS / Dolan's Provider Decision Process Assessment Instrument | immediately post | 97 detailed decision aid pre consult | ICC 0.44 (0.9 SD) | 87 simple decision aid pre consult | ICC 0.28 (1.0 SD) | Agreement measure was higher for the DA group (ICC 0.44; 95% CI 0.25 to 0.59) than for the pamphlet group (ICC 0.28; 95% CI 0.06 to 0.47) | |
| Informed decision making | analysis of the physician–patient encounter using audio‐recordings | 3.0 items | 2.4 items | RR 1.30 (CI 1.03 to 1.64) P = 0.029 | |||
| CHD: coronary heart disease; CI: confidence interval; DA: decision aid; DCS: decisional conflict scale; ICC: intraclass correlation coefficient; OPTION scale: observing patient involvement scale; RR: risk ratio; SD: standard deviation | |||||||
| Study | Scale used | Timing | N Decision aid | Decision aid ‐ mean | N Comparison | Comparison ‐ mean | Notes |
| DA versus usual care | |||||||
| control preferences ‐ patients choosing active/ collaborative decision making | post intervention | 291 | 95% | 334 | 92% | No difference | |
| control preferences did not change | post intervention | 291 | 92% | 334 | 87% | No difference | |
| control preferences changed to passive | post intervention | 291 | 3% | 334 | 5% | No difference | |
| control preferences changed to active/ collaborative | post intervention | 291 | 3% | 334 | 7% | No difference | |
| COMRADE used to measure patients' perceived involvement in decisions | post‐consultation | 49 | 79.5 (SD 18.6) 76.8 (SD 20.9) | 58 | 69.7 (SD 20.0) 73.5 (SD 19.3) | increased patient involvement in decision aid group post intervention compared to usual care at baseline. At discharge there was no difference between groups. | |
| surrogates feeling somewhat or very involved in decision making | post intervention | 83% | 77% | P = 0.18 | |||
| achieved decision involvement | post intervention | 32% | 35% | No difference | |||
| patients' perceived involvement in decision making | post‐consultation | 191 | 26.3 pre 28.0 post | 96 | 24.5 pre 25.5 post | Improved patient participation from baseline to post exposure to the decision aid (P = 0.010) and in comparison to the usual care group (P = 0.003) but there was no change in the control group for the pre‐post comparison | |
| adapted from the Control Preferences Scale | post‐intervention | the total mean scores were: 2.74±1.25 (n=99) pre and 2.83±1.16 (n=199) post, no statistically significant difference. | |||||
| Decision Evaluation scale (15 item questionnaire) Decision control subscale | post‐consultation | 124 | 85 | 128 | 87.5 | P = 0.33 | |
| DA: decision aid; SD: standard deviation | |||||||
| Study | Scale used | Timing | N Decision aid | Decision aid ‐ mean | N Comparison | Comparison ‐ mean | Notes |
| DA versus usual care | |||||||
| single item ‐ ranging from '0 = completely undecided' to '100 = made my decision' | No difference | ||||||
| DA: decision aid | |||||||
| Study | Scale used | Timing | N Decision aid | Decision aid ‐ mean | N Comparison | Comparison ‐ mean | Notes |
| DA versus usual care | |||||||
| 1‐item; pleased with treatment choice | 1 month post‐surgery | 62/66 | 55/67 | P = 0.03 | |||
| satisfaction with decision scale: median (range) | 1 month post intervention | 107 | 22(13‐25) | 100 | 21(15‐25) | No difference | |
| 7‐point scale: ranging from 1‐7 | 4 weeks | 91.17 (14) | 91.33(14.50) | No difference | |||
| 6‐item | 1, 6, 12 months | 100 | 114 | Overall, no difference between groups; decision aid led to significantly increased satisfaction compared to US among those who were undecided at randomisation but not among those who had made a decision before randomisation; (only graph in paper with no raw data) | |||
| satisfaction with the decision | immediately post | 134 | 137 | No difference (P = 0.56) | |||
| Detailed versus simple DA | |||||||
| 6‐item scale (measured on 1 to 5) | 1 day | 83 | 4.0 (0.56) | 89 | 3.8 (0.66) | No difference | |
| 6 months | 63 | 3.8 (0.63) | 75 | 3.8 (0.67) | No difference | ||
| 12 months | 62 | 3.9 (0.62) | 74 | 3.9 (0.67) | No difference | ||
| 6‐item scale | 3 months | No difference | |||||
| DA: decision aid | |||||||
| Study | Scale used | Timing | N Decision aid | Decision aid ‐ mean | N Comparison | Comparison ‐ mean | Notes |
| DA versus usual care | |||||||
| Effectiveness of consultation ‐ patient assessment. Single item 1 (not at all effective) to 7 (extremely effective) | 106 | 6.6 | 105 | 6.6 | No difference | ||
| Effectiveness of consultation ‐ counsellor assessment. Single item 1 to 7 | 5.9 | 5.8 | No difference | ||||
| Satisfaction with decision process (0 for strongly agree to 5 for strongly disagree) | 101 | 103 | Patients in DA group reported greater satisfaction with the DM process (strongly agree, 61% DA vs 40% usual care) | ||||
| Measured satisfaction with opportunities to participate in decision making using a single item | Compared to usual care, women who received the decision aid followed by nurse coaching were statistically significantly more satisfied with the opportunities to participate in decision making (OR 1.5; 95% CI 1.1 to 2.0). | ||||||
| Satisfaction with information received sub‐scale 4‐item (0 to 100; low to high) | average 10 days | 54 | 76 (15.5 SD) | 56 | 59 (23.3 SD) | P = 0.001 | |
| Satisfaction with practitioner treatment during decision process sub‐scale 4‐item (0 to 100; low to high) | average 10 days | 54 | 69 (25.3 SD) | 56 | 54 (26.7 SD) | P = 0.004 | |
| Satisfaction with cancer information service 1‐item (1 to 5; low to high) | 2 weeks | 4.37 (0.84 SD) | 4.38 (0.86 SD) | No difference | |||
| 6 months | 4.51 (0.75 SD) | 4.51 (0.64 SD) | No difference | ||||
| (7 point scales) Participants' satisfaction with knowledge transfer ‐amount of information ‐clarity of information ‐helpfulness of the information ‐would want other decisions ‐recommend to others | post intervention | 49 | 6.6 6 6 6.1 6.4 | 46 | 6.3 6 5.8 5.8 6.2 | P = 0.798 P = 0.296 P = 0.624 P = 0.248 P = 0.435 | |
| Clinicians' satisfaction with knowledge transfer ‐helpfulness of the information ‐would want other decisions ‐recommend to others | post intervention | 39 | 5.8 6.1 5.9 | 33 | 5.2 4.9 4.8 | P = 0.006 P < 0.001 P < 0.001 | |
| Satisfaction with information about medicines | 4 months post | 16 | 10.4 (SD 2.9) | 17 | 10.1 (SD 2.2) | No difference | |
| ‐ physician helped me understand ‐ physician understood important to me ‐ physician answered questions ‐ satisfied with involvement ‐ satisfied with physician's involvement ‐ satisfied with process | 1 week follow‐up | 53 | 49 (92.5%) 47 47 44 36 42 | 56 | 53 (94.6%) 50 51 45 36 50 | High satisfaction with no difference by group | |
| Detailed versus simple DA | |||||||
| Satisfaction with decision making process 7‐item scale (5‐point response) | 3 months | 171 | separate responses provided with no total | 172 | separate responses provided with no total | No difference except DA more likely to report they had as much information as they wanted and less likely to report having relied too much on physician's opinion | |
| Satisfaction with genetic counselling 11‐item short form (range 4 to 44; low to high) | immediately post | 116 | 37.27 (5.74 SD) | 126 | 40.48 (4.26 SD) | P < 0.001 higher satisfaction with individual counselling compared to decision aid | |
| Satisfaction with involvement in decision making (3 questions) | 26 to 30 weeks gestation | 244 | 44.8 44.3 72.6 | 252 | 49.2 48.1 79.9 | P = 0.40 P = 0.45 P = 0.10 | |
| DA: decision aid; SD: standard deviation | |||||||
| Study | Scale used | Timing | N Decision aid | Decision aid ‐ mean | N Comparison | Comparison ‐ mean | Notes |
| DA versus usual care | |||||||
| Preparation for Decision Making Scale | Pre‐consultation | 43 | 35 (median) | 40 | 20.5 (median) | P = 0.0001 | |
| Preparation for Decision Making Scale | 3 weeks | 70 | 65.1 (24.9 SD) | 79 | 53.9 (27.1 SD) | P = 0.009 | |
| Detailed versus simple DA | |||||||
| Preparation for Decision Making Scale | Post‐physician consultation | 48 | 28 (6.1 SD) | 42 | 27(5.5 SD) | No difference | |
| DA: decision aid; SD: standard deviation | |||||||
| Study | Type of comparison | N Decision aid | Decision aid ‐ mean | N Comparison | Comparison ‐ mean | Notes |
| Other elective surgery ‐ uptake | ||||||
| DA versus usual care | 127 | 1 | 129 | 3 | No difference | |
| DA versus usual care | No difference | |||||
| Other elective surgery ‐ preference | ||||||
| Detailed versus simple DA | 32 | 13 | 31 | 14 | No difference | |
| Screening ‐ Breast cancer genetic testing ‐ uptake | ||||||
| Detailed versus simple DA | No difference | |||||
| Detailed versus simple DA | No difference | |||||
| Screening ‐ Breast cancer genetic testing ‐ preference | ||||||
| DA versus usual care | The intervention decreased intention to obtain genetic testing among women at average risk, but increased in women at high risk | |||||
| Screening ‐ Cardiac stress testing ‐ uptake | ||||||
| DA versus usual care | 101 | 58% | 100 | 77% | P < 0.0001 | |
| Screening ‐ Colorectal cancer genetic testing ‐ uptake | ||||||
| Detailed versus simple DA | No difference | |||||
| Screening ‐ Breast screening ‐ uptake | ||||||
| DA versus usual care | No difference | |||||
| DA versus usual care | 117 | 82% | 209 | 61% | P < 0.001 | |
| Screening ‐ Diabetes ‐ uptake | ||||||
| DA versus usual care | 633 | 353 | 639 | 368 | P = 0.51 | |
| Screening ‐ Diabetes ‐ preference | ||||||
| DA versus usual care | 273 | 134 | No difference | |||
| Screening ‐ Prenatal ‐ uptake | ||||||
| DA versus usual care | No difference | |||||
| DA versus usual care | 184 | 50% | 206 | 53.8% | No difference | |
| DA versus usual care | No difference | |||||
| Screening ‐ PSA ‐ uptake | ||||||
| DA versus usual care | The experimental interventions led to significant reductions in requests for prostate‐specific antigen tests ( ˜2 times greater decline). | |||||
| Medication ‐ Antibiotics for upper respiratory infections ‐ uptake | ||||||
| DA versus usual care | 81 | 33 | 70 | 49 | P = 0.08 | |
| Medication ‐ Cardiovascular disease ‐ preference | ||||||
| DA versus usual care | 79 | 63% | 78 | 42% | P < 0.01 | |
| Medication ‐ Breast cancer prevention ‐ uptake | ||||||
| DA versus usual care | 382 | 0.5% | 100 | 0% | No difference | |
| Medication ‐ Chemotherapy for advanced cancer | ||||||
| DA versus usual care | 107 | 77% | 100 | 71% | No difference | |
| Medication ‐ Hormone replacement therapy ‐ uptake | ||||||
| DA versus usual care | 8% decrease in DA group, not statistically significant | |||||
| Detailed versus simple DA | No difference | |||||
| Medication ‐ Natural heath products ‐ preference | ||||||
| DA versus usual care | 41% | 41% | No difference | |||
| Medication ‐ Anti‐thrombosis ‐ uptake | ||||||
| DA versus usual care | 25% decrease in DA group, not statistically significant | |||||
| DA versus usual care | No difference | |||||
| DA versus usual care | 93.8% | 25% | risk ratio 0.27 (95% CI 0.11 to 0.63) | |||
| Medication ‐ Hypertension ‐ uptake | ||||||
| DA versus usual care | No difference | |||||
| Medication ‐ Chemotherapy for breast cancer ‐ preference | ||||||
| DA versus usual care | No difference | |||||
| Medication ‐ Osteoporosis ‐ uptake | ||||||
| DA versus usual care | 52 | 44% | 48 | 40% | No difference | |
| Medication ‐ Immunotherapy ‐ uptake | ||||||
| DA versus usual care | No difference | |||||
| Medication ‐ Schizophrenia treatment ‐ uptake | ||||||
| Hamann 2006 ‐ prescriptions | DA versus usual care | No difference | ||||
| Hamann 2006 ‐ psycho‐education | DA versus usual care | Higher uptake in DA group (P = 0.003) | ||||
| Obstetrics ‐ Birth control method ‐ preference | ||||||
| DA versus usual care | 114 | 108 | No difference in the methods chosen between groups, participants in the intervention group were not more likely to initiate the requested method immediately compared to those in | |||
| Obstetric ‐ Childbirth procedure ‐ uptake | ||||||
| DA versus usual care | No difference | |||||
| DA versus usual care | No difference | |||||
| Obstetric ‐ Childbirth procedure ‐ preference | ||||||
| DA versus usual care | No difference | |||||
| Obstetric ‐ Embryo transplant ‐ uptake | ||||||
| van Peperstraten 2010 ‐ single embryo transfer | DA versus usual care | 152 | 43% | 156 | 32% | P = 0.05 |
| Obstetric ‐ Pain relief in labour ‐ uptake | ||||||
| Detailed versus simple DA | 308 | 146 | No difference | |||
| Other‐ Lung transplant referral | ||||||
| DA versus usual care | No difference | |||||
| Other ‐ Pre‐operative blood transfusion ‐ uptake | ||||||
| DA versus usual care | No difference | |||||
| Vaccine ‐ Flu shot ‐ uptake | ||||||
| DA versus usual care | 48 | 46% | 59 | 27% | No difference | |
| Vaccine ‐ Hepatitis B ‐ uptake | ||||||
| DA versus usual care | Significant increase of 76% in the DA group | |||||
| DA: decision aid; OR: odds ratio | ||||||
| Reference | Scale used | N Decision aid | Mean (SD) Decision aid | N Comparison | Mean (SD) Comparison | Notes |
| DA versus usual care | ||||||
| 3 months ‐ Using a contraceptive method that was in the same effectiveness group as the method requested at enrolment, 'very effective', as chosen option ‐ eg. if chose sterilization and ended up using an IUD counted as adhering | 48 | 85% | 52 | 77% | P = 0.28 | |
| 3 months ‐ Using a contraceptive method that was in the same effectiveness group, 'effective', as chosen option | 41 | 68% | 31 | 68% | P = 0.96 | |
| 6 to 8 weeks ‐ Patient reported ‐ 5‐point Likert scale on steadiness of following the treatment plan: 1‐very bad to 5‐very good | 191 | 4.3 (0.9) | 96 | 3.9 (1.0) | P = 0.073 | |
| 6 to 8 weeks ‐ Physician reported ‐ 5‐point Likert scale steadiness of following the treatment plan: 1‐very bad to 5‐very good | 191 | 4.8 (0.6) | 96 | 4.3 (1.1) | P = 0.56 | |
| 3 months ‐ telephone administration of the 8‐item Morisky adherence (7 yes/no items and 1 item with 5 point Likert scale to elicit behaviours such as skipping medicines when they have no symptoms) | 70% of participants reported good adherence to statins with no difference between groups | |||||
| 6 months ‐ telephone administration of the 8‐item Morisky adherence (7 yes/no items and 1 item with 5 point Likert scale to elicit behaviours such as skipping medicines when they have no symptoms) | 80% of participants reported good adherence to statins with no difference between groups | |||||
| 6 months ‐ Self reported – Measured % of patients taking therapy initially chosen | 129 | 95.35% | 134 | 93.28% | P = 0.44 | |
| ˜ 3 years ‐ Self reported – 6 item Adherence Questionnaire: from "I take all my tablets at the same time of day" to "I take hardly any of my tablets“ | No difference | |||||
| 6 months ‐ Percentage of participants that self‐reported currently taking medication who have not missed one dose within last week | 17 | 65% | 19 | 63% | P = 0.92 | |
| 6 months ‐ Percentage of participants who opted to take biophosphonates who took their medication on more than 80% of the days for which it was prescribed, based on pharmacy records | 23 | 100% | 19 | 74% | P = 0.009 | |
| 6 months ‐ Pharmacy records ‐ days covered (range) | 48 | 97.5% (range 0 to 100) | 37 | 100 (range 73.9 to 100) | AMD −8.88 (−13.6% to −4.14%) Positive AMD favours decision aid arm. This finding is statistically significant | |
| 6 months ‐ Self reported by telephone call – did not miss a dose in last week | 41 | 76% | 31 | 81% | OR 0.74 (95% CI 0.24‐2.32) | |
| 4 months ‐ Extent to which the patients' behaviour in taking medications coincides with the clinical prescription | 16 | 10.4% (32) [improvement from baseline] | 17 | 2% (26) [improvement from baseline] | Not significant | |
| 3 month ‐ adherence to initial choice post intervention | ||||||
| Any therapy promoted in decision aid | 76 | 45 (59%) | 73 | 25 (34%) | P < 0.01 | |
| any therapy promoted in decision aid + others (eg. diet or physical activity) | 77 | 64 (83%) | 77 | 52 (68%) | P = 0.02 | |
| aspirin | 32 | 30 (94%) | 19 | 11 (58%) | P < 0.01 | |
| cholesterol medicine | 14 | 12 (86%) | 6 | 5 (83%) | The intervention had little effect blood pressure or cholesterol medication, | |
| blood pressure medicine | 9 | 9 (100%) | 12 | 11 (92%) | ||
| stop smoking | 8 | 25% | 5 | 20% | No effect on smoking, although subgroups were small | |
| 3 months ‐ Self reported – mailed surveys & telephone call to non‐respondents on adherence to statin use: missed 1 dose or more within the last week. | 33 | 93.94% | 29 | 79.31% | No difference in adherence when analysis adjusted by sex, cardiovascular disease, and number of medications | |
| Detailed versus simple DA | ||||||
| 12 months ‐ Self reported – Telephone call to patients to ask estimated days missed per week and reasons Response categories: 1) taking medication as prescribed (omitting no more than one day/week) , 2) missing doses occasionally and randomly, 3) systematically deviating from the prescribed directions | 16 | ˜72% | 20 | ˜72% | No difference | |
| 12 months ‐ Self reported – daily adherence recorded on a calendar | 62 | ˜89% | 74 | ˜89% | No difference | |
| 1 month ‐ faecal occult blood test uptake | 134 | 5.2% | 137 | 6.6% | P = 0.64 | |
| DA: decision aid; OR: odds ratio | ||||||
| Reference | Timing | N Decision aid | Mean Decision aid (SD) | Change from baseline | N Comparison | Mean Comparison (SD) | Change from Baseline | Notes |
| General health ‐ DA versus usual care | ||||||||
| Barry 1997 (SF‐36) | Baseline | 104 | 67.2 (19.0) | 123 | 71.1 (17.6) | P = 0.02 | ||
| 3 months | ‐0.96 (1.41) | ‐3.59 (1.57) | ||||||
| 6 months | ‐1.46 (1.41) | ‐4.93 (1.45) | ||||||
| 12 months | 0.61 (1.58) | ‐4.99 (1.44) | ||||||
| Legare 2011 (percentage of people who felt they had a stable and better health, (SF‐12)) | 2 weeks post | not reported | 94 | +7 | not reported | 85 | ‐6 | P = 0.08 |
| Morgan 2000 (SF‐36) | 6 months post | 72 | 62 (23) | +4.0 | 88 | 65 (20) | +7.0 | No difference |
| Kennedy 2002 (SF‐36) | 2 years | 176 | 157 | No difference | ||||
| Vuorma 2003 (RAND‐36) | 1 year | 156 | 2.2 | 159 | 2.8 | No difference | ||
| Physical function ‐ DA versus usual care | ||||||||
| Barry 1997 (SF‐36) | Baseline | 104 | 81.9 (20.0) | 123 | 83.0 (18.9) | P = 0.02 | ||
| 3 months | ‐0.34 (1.61) | ‐1.81 (1.07) | ||||||
| 6 months | 0.10 (1.28) | ‐3.26 (1.37) | ||||||
| 12 months | 0.15 (1.40) | ‐3.74 (1.18) | ||||||
| Morgan 2000 (SF‐36) | 6 months post | 72 | 67 (29) | +7.0 | 88 | 71 (24) | +10.0 | No difference |
| Kennedy 2002 (SF‐36) | 2 years | 176 | 157 | No difference | ||||
| Vuorma 2003 (RAND‐36) | 1 year | 156 | 2.4 | 159 | 2.2 | No difference | ||
| Physical function ‐ Detailed versus simple DA | ||||||||
| Bernstein 1998 (SF‐12) | 3 months post | 61 | 38 (12.1) | +0.6 | 48 | 37.6 (10.6) | +3.8 | No difference |
| Social function ‐ DA versus usual care | ||||||||
| Barry 1997 (SF‐36) | Baseline | 104 | 90.6 (15.5) | 123 | 91.7 (15.7) | P = 0.17 | ||
| 3 months | 0.34 (1.58) | ‐2.26 (1.36) | ||||||
| 6 months | ‐0.05 (1.92) | ‐2.46 (1.45) | ||||||
| 12 months | ‐1.46 (1.85) | ‐3.52 (1.71) | ||||||
| Kennedy 2002 (SF‐36) | 2 years | 176 | 157 | No difference | ||||
| McCaffery 2010 (SF‐36) | 2 weeks | 77 | 84.7 | 71 | 82.1 | P = 0.39 | ||
| Vuorma 2003 (RAND‐36) | 1 year | 156 | 5.2 | 159 | 7.1 | No difference | ||
| Mental function ‐ DA versus usual care | ||||||||
| McCaffery 2010 (SF‐36) | 2 weeks | 77 | 71.3 | 71 | 71.6 | P = 0.46 | ||
| Kennedy 2002 (SF‐36) | 2 years | 176 | 157 | No difference | ||||
| Vuorma 2003 (RAND‐36) | 1 year | 156 | 4.7 | 159 | 5.3 | No difference | ||
| Mental function ‐ Detailed versus simple DA | ||||||||
| Bernstein 1998 (SF‐12) | 3 months post | 61 | 49.1 (11.4) | 0.0 | 48 | 48.9 (10.8) | +0.9 | No difference |
| Role function ‐ DA versus usual care | ||||||||
| Morgan 2000 (SF‐36) | 6 months post | 72 | 62 (44) | +20.0 | 88 | 58 (43) | +15.0 | No difference |
| Kennedy 2002 (SF‐36) | 2 years | 176 | 157 | P = 0.04 | ||||
| Vuorma 2003 (RAND‐36) | 1 year | 9.2 | 6.3 | No difference | ||||
| Bodily pain ‐ DA versus usual care | ||||||||
| Morgan 2000 (SF‐36) | 6 months post | 72 | 81 (22) | +6.0 | 88 | 77 (24) | +5.0 | No difference |
| Kennedy 2002 (SF‐36) | 2 years | 176 | 157 | No difference | ||||
| Vuorma 2003 (RAND‐36) | 1 year | 156 | 6.5 | 159 | 6.2 | No difference | ||
| Role emotional ‐ DA versus usual care | ||||||||
| Kennedy 2002 (SF‐36) | 2 years | 176 | 157 | No difference | ||||
| McCaffery 2010 (SF‐36) | 2 weeks | 77 | 80.3 | 71 | 77.4 | P = 0.61 | ||
| Vuorma 2003 (RAND‐36) | 1 year | 156 | 12.6 | 159 | 1.9 | P = 0.01 | ||
| Energy/vitality ‐ DA versus usual care | ||||||||
| Kennedy 2002 (SF‐36) | 2 years | 176 | 157 | No difference | ||||
| McCaffery 2010 (SF‐36) | 2 weeks | 77 | 55.2 | 71 | 54.1 | P = 0.09 | ||
| Vuorma 2003 (RAND‐36) | 1 year | 156 | 8.9 | 159 | 8.8 | No difference | ||
| SF‐36 all dimensions ‐ DA versus usual care | ||||||||
| McCaffery 2010 (SF‐36) | 2 weeks | 77 | 47 | 71 | 46.3 | P = 0.35 | ||
| Murray 2001b (SF‐36) | 9 months | 93 | 94 | No difference | ||||
| Murray 2001a (SP‐36) | 9 months | 54 | 48 | No difference | ||||
| Functional status ‐ DA versus usual care | ||||||||
| Deyo 2000 (Roland Disability Questionnaire) | 1 year | 171 | 20.4 | +5.4 | 173 | 20.9 | +5.7 | No difference |
| Leighl 2011 (FACT‐G) median (range) | 1 month post | 74 | 17 (6‐28) | 68 | 17.5 (7‐28) | P = 0.02 | ||
| Health utilities ‐ DA versus usual care | ||||||||
| Murray 2001a (Euroqol EQ‐5D) | No difference | |||||||
| Murray 2001b (Euroqol EQ‐5D) | No difference | |||||||
| DA: decision aid; SF‐36: Medical Outcomes Study 36‐item Short‐Form Health Survey; SF‐12: 12‐item Short‐Form Health Survey; RAND‐36: the 36‐item short form survey from the RAND Medical Outcomes Study FACT‐G: Functional Assessment of Cancer Therapy‐General | ||||||||
| Study | Outcome | Scale used | Timing | N Decision aid | Decision aid mean change | N Comparison | Comparison mean change | Notes |
| DA versus usual care | ||||||||
| Urinary symptoms | AUA Symptom Index (0 to 100) | 3 months | 104 | ‐4.80% (1.74) | 117 | ‐1.40% (1.37) | No difference; trend toward DA | |
| Urinary symptoms | AUA | 6 months | 104 | ‐3.66% (2.06) | 117 | ‐3.17% (1.77) | No difference | |
| Urinary symptoms | AUA | 12 months | 104 | ‐2.51% (2.11) | 117 | ‐4.14% (1.66) | No difference; trend toward control | |
| Impact of symptoms | BPH Impact Index (0 to 100) | 3 months | 104 | ‐6.58% (1.10) | 117 | ‐3.00% (1.05) | No difference; trend toward DA | |
| Impact of symptoms | BPH | 6 months | 104 | ‐4.37% (1.32) | 117 | ‐3.89% (1.16) | No difference; trend toward DA | |
| Impact of symptoms | BPH | 12 months | 104 | ‐5.53% (1.32) | 117 | ‐2.63% (1.32) | No difference; trend toward DA | |
| Satisfaction | SAQ (0 to 100) | 3 months | 61 | +6.2% | 48 | +10.5% | Control significantly more satisfied | |
| Angina stability | SAQ | 3 months | 61 | +17.2% | 48 | +28.3% | No difference | |
| Angina frequency | SAQ | 3 months | 61 | +5.5% | 48 | +15.3% | No difference | |
| Disease Perception | SAQ | 3 months | 61 | +14.1% | 48 | +18.8% | No difference | |
| Physical Capacity | SAQ | 3 months | 61 | ‐0.5% | 48 | +7.1% | No difference | |
| (FACT‐G) median (range) | Physical function at 1 month post | 74 | 21 (0‐28) | 68 | 20 (4‐28) | No difference | ||
| Role emotional at 1 month post | 74 | 17 (0‐20) | 68 | 17(7‐20) | No difference | |||
| No Angina | CCVA | 6 months | 72 | +49% | 88 | +48% | No difference | |
| Class I Angina | CCVA | 6 months | 72 | ‐1% | 88 | +6% | No difference | |
| Class II Angina | CCVA | 6 months | 72 | ‐23% | 88 | ‐26% | No difference | |
| Class III Angina | CCVA | 6 months | 72 | ‐26% | 88 | ‐28% | No difference | |
| Class IV Angina | CCVA | 6 months | 72 | 0% | 88 | 0% | No difference | |
| Urinary symptoms | AUA symptom Index (0 to100) | No difference | ||||||
| Menopausal symptoms | MenQol | No difference | ||||||
| Menorrhagia specific utility scale | (0 to 100) | 6 months | 60 | 59.3 (30.0) | 56 | 50.9 (25.1) | P = 0.03 higher menorrhagia quality of life favouring DA group | |
| Strokes or bleeds requiring admission | 3 months | 51 | 55 | No strokes and no bleeds requiring admission. 1 bleed and 1 transient stroke both in control group that required GP consultation | ||||
| Ongoing pregnancies (> 12 weeks gestation) | after 1st IVF cycle | 152 | 156 | 32% of participants in the intervention group and 38% of participants in the control group had ongoing pregnancies, P = 0.25 | ||||
| Twin pregnancies (> 12 weeks gestation) | after 1st IVF cycle | 152 | 156 | 4% of participants in intervention group and 6% of participants in control group had twin pregnancies, P = 0.33 | ||||
| Inconvenience due to menstrual bleeding | (5 to 25) | 1 year | 156 | 10.4 | 159 | 10.5 | No difference | |
| Menstrual pain | (0 to 12) | 1 year | 156 | 4.7 | 159 | 4.6 | No difference | |
| Detailed versus simple DA | ||||||||
| % working | 1 year | 171 | +17.3% | 173 | +18.3% | No difference | ||
| % missed 1+ day work within past month | 1 year | 171 | ‐38.4% | 173 | ‐35.2% | No difference | ||
| Back pain severity | 1 year | 171 | ‐22.4% | 173 | ‐22% | 1 year scores: DA 27.6% significantly better than control 37.2% | ||
| Leg pain severity | 1 year | 171 | ‐42.1% | 173 | ‐43.9% | No difference | ||
| Seeking compensation | 1 year | 171 | ‐2.9% | 173 | ‐5.9% | No difference | ||
| Satisfied with symptoms | 1 year | 171 | +32.1% | 173 | +32.4% | No difference | ||
| Apgar score | scores > 7 | 1 minute after birth | 395 | 221 (82%) | 201 | 149 (75%) | P = 0.12 | |
| scores > 7 | 5 minutes after birth | 395 | 235 (90%) | 201 | 167 (84%) | P = 0.68 | ||
| Birth weight | in grams | mean (SD) | 395 | 3445 (451) | 201 | 3412 (450) | P = 0.11 | |
| AUA: American Urological Association; CCVA: Canadian Cardiovascular Angina; BPH: benign prostatic hyperplasia; DA: decision aid; SAQ: Seattle Angina Questionnaire; | ||||||||
| Study | Timing | N Decision aid | Mean Decision aid (SD) | Change from baseline | N Comparison | Mean Comparison (SD) | Change from Baseline | Notes |
| State Anxiety Inventory: < 30 days post‐intervention ‐ DA versus usual care | ||||||||
| Bekker 2004; prenatal screening | Immediately post | 50 | 58.9 (16.6) | 56 | 61.2 (13.7) | No difference | ||
| Evans 2010; PSA screening | immediately post DA | 89 | 4.98 | 103 | 4.88 | P = 0.98 | ||
| Green 2004; breast cancer screening (low risk group) | Immediately post | 56 | 29 | ‐4 | 61 | 30 | ‐3 | P = 0.04 (for difference in change score) |
| Green 2004; breast cancer screening (high risk group) | Immediately post | 50 | 30 | ‐3 | 44 | 33 | ‐5 | P = 0.04 (for difference in change score) |
| post consult, 1‐2 weeks and 4 weeks post | No difference; see Figure 3 | |||||||
| Mathieu 2007; mammography screening | immediately after | 321 | 29.61 | 315 | 29.34 | No difference | ||
| McCaffery 2010; HPV screening (state trait anxiety inventory) | 2 weeks | 77 | 10.5 | 71 | 10.6 | P = 0.25 | ||
| Montgomery 2003; hypertension | immediately post DA | 44 | 35.45 (10.52) | 50 | 37.67 (13.92) | No difference | ||
| Montgomery 2007; previous cesarean section | 37 weeks gestation | 196 | 38.7 (12.2) | 195 | 42.1 (12.2) | P = 0.016 | ||
| Nassar 2007; breech presentation | 1 week | 98 | 41.4 (12.5) | 90 | 44.4 (13.9) | No difference | ||
| Protheroe 2007; menorrhagia | 2 weeks | 59 | 11.6 (3.7) | 61 | 12.2 (3.7) | P = 0.016 | ||
| Rubel 2010; PSA screening | immediately after | 20 items adapted from state portion of State‐Trait Anxiety Inventory Scale STAI ‐ Form Y; total mean score= 1.66±0.59 (n=200) for patients in both groups | ||||||
| Smith 2010; bowel cancer screening | 2 week follow‐up | 357 | 13.67 | 173 | 14.05 | P= 0.80 | ||
| Thomson 2007; anti‐thrombotic treatment for atrial fibrillation | immediately after | 53 | 56 | Significant fall in anxiety (‐4.57) but no difference between groups (P = 0.98) | ||||
| Trevena 2008 colorectal cancer screening | immediately after | 134 | 137 | No difference (P = 0.59) | ||||
| van Peperstraten 2010; number of embryos transferred | immediately after | 152 | 27.33% | 156 | 24.5% | P = 0.14 | ||
| Whelan 2004; breast cancer surgery | 7 days post DA | 94 | 42.3 (1.3) | 107 | 41.9 (1.3) | No difference | ||
| Whelan 2003; breast chemotherapy | 7 days post DA | 82 | 45.6 | +2.2 | 93 | 47.4 | +0.8 | No difference |
| Wong 2006; pregnancy termination | Immediately post | 154 | 54 (15.8) | 159 | 54 (16.1) | No difference | ||
| State Anxiety Inventory: < 30 days post‐intervention ‐ Detailed versus simple DA | ||||||||
| Goel 2001; breast cancer surgery | 1 to 3 days post DA | 74 | 51.2 (14.2) | ‐0.7 | 43 | 50.7 (14.8) | ‐0.1 | No difference |
| Hunter 2005; prenatal screening | Immediately post | 116 | 45.50 (9.69) | ‐1.17 | 126 | 47.98 (10.14) | ‐0.37 | No difference |
| Raynes‐Greenow 2010; labour analgesia | 37 weeks gestation | 395 | 33.3 (9.3) | ‐0.6 | 201 | 34.3 (11.0) | 0 | P = 0.32 |
| Tiller 2006; prophylactic ovarian cancer treatment | 2 weeks | 58 | 38.2 (13.4) | 60 | 38.0 (15.2) | No difference | ||
| State Anxiety Inventory: 1 month post‐intervention ‐ DA versus usual care | ||||||||
| Bekker 2004; prenatal screening | 1 month post DA | 29 | 35.3 (12.5) | 39 | 34.7(14.8) | No difference | ||
| Davison 1997; prostate cancer treatment | 5 to 6 weeks post DA | 30 | 35.5 | ‐9.0 | 30 | 34.5 | ‐2.5 | No difference |
| State Anxiety Inventory: 1 month post‐intervention ‐ Detailed versus simple DA | ||||||||
| 1 month post DA | 43 | 35.4 (11.7) | 43 | 37.4 (10.7) | No difference | |||
| State Anxiety Inventory: 3 months post‐intervention ‐ DA vs usual care | ||||||||
| Murray 2001a; benign prostatic hypertrophy | 3 months post DA | 55 | 36.36 (14.99) | +2.4 | 48 | 32.08 (9.836) | +0.7 | No difference |
| Murray 2001b; hormone replacement therapy | 3 months post DA | 93 | 38.42 (10.83) | ‐0.5 | 95 | 40.53 (12.96) | +1.8 | No difference |
| Nagle 2008; prenatal screening | ˜1 to 12 weeks post DA | 167 | 37.2 (12.1) | 171 | 37.36 (12.6) | No difference | ||
| Nassar 2007; breech presentation | 3 months post DA | 86 | 29.2 (9.9) | 84 | 30.8 (10.5) | No difference | ||
| Vuorma 2003; menorrhagia treatment | 3 months post DA | 184 | 37.1 | +1.0 | 179 | 35.9 | ‐1.0 | No difference |
| Whelan 2003; breast chemotherapy | 3 months post DA | 82 | 36.0 | 93 | 37.8 | No difference | ||
| State Anxiety Inventory: 6 months post‐intervention ‐ DA versus usual care | ||||||||
| Protheroe 2007; menorrhagia | 6 months post DA | 47 | 11.2 (4.2) | 52 | 13.3 (4.9) | P = 0.067 | ||
| Whelan 2004; breast cancer surgery | 6 months post DA | 94 | 39.3 (1.3) | 107 | 38.9 (1.6) | No difference | ||
| Whelan 2003; breast chemotherapy | 6 months post DA | 82 | 38.2 | 93 | 38.2 | No difference | ||
| State Anxiety Inventory: 6 months post‐intervention ‐ Detailed versus simple DA | ||||||||
| Goel 2001; breast cancer surgery | 6 months post DA | 59 | 36.6 (12.9) | ‐15.3 | 39 | 34.3 (11.6) | ‐16.5 | No difference |
| Tiller 2006; prophylactic ovarian cancer treatment | 6 months post DA | 53 | 35.7 (9.0) | 55 | 36.2 (13.6) | No difference | ||
| State Anxiety Inventory: 12 months post‐intervention ‐ DA versus usual care | ||||||||
| Whelan 2004; breast cancer surgery | 12 months post DA | 94 | 37.5 (1.4) | 107 | 36.6 (1.5) | No difference | ||
| Whelan 2003; breast chemotherapy | 12 months post DA | 82 | 39.2 | 93 | 40.2 | No difference | ||
| Other ‐ DA versus usual care | ||||||||
| Johnson 2006; endodontic treatment | Immediately post ‐ single question 7‐point Likert scale. | 32 | 3.2 (1.7) | 35 | 3.8 (2.1) | P = 0.27 | ||
| Lewis 2010; colorectal cancer screening | intrusive thoughts ‐ 3 items; 4 point scale ‐ not at all | 139 | 66.2% | 157 | 68.0% | P = 0.92 | ||
| intrusive thoughts ‐ 3 items; 4 point scale ‐ sometimes | 66 | 31.4% | 69 | 29.9% | ||||
| intrusive thoughts ‐ 3 items; 4 point scale ‐ often | 5 | 2.4% | 5 | 2.2% | ||||
| intrusive thoughts ‐ measured using 1 item from the impact of events scale | 77 | 43% | 71 | 32% | No difference | |||
| Worry about developing bowel cancer ‐ quite or very | 357 | 6% | 173 | 8% | P = 0.78 | |||
| Worry about developing bowel cancer ‐ none or a bit | 357 | 94% | 173 | 92% | ||||
| DA: decision aid; HPV: human papilloma virus; PSA: prostate‐specific antigen | ||||||||
| Study | Timing | N Decision aid | Mean Decision aid (SD) | Change from Baseline | N Comparison | MeanComparison (SD) | Change from Baseline | Notes |
| DA versus usual care | ||||||||
| Davison 1997 (20‐item CES‐D) | 5 to 6 weeks | 30 | 29.8 | ‐0.6 | 30 | 29.5 | +1.3 | No difference |
| Loh 2007 (Brief Patient Health Questionnaire‐D) | 6 to 8 weeks | 191 | 29.8 (2.7) | 96 | 27.0 (3.6) | P = 0.236 | ||
| Nagle 2008 (Edinburgh Postnatal Depression Scale) | ˜1 to 12 weeks post DA | 167 | 19 (11.6) | 171 | 19 (11.2) | No difference | ||
| Tiller 2006 (Hospital Anxiety and Depression Scale) | 2 weeks post DA | 58 | 10.9 (5.6) | 61 | 10.7 (6.4) | P = 0.03 | ||
| 6 mos post DA | 50 | 10.1(4.7) | 56 | 10.8 (6.4) | P = 0.12 | |||
| van Peperstraten 2010 (Beck Depression Inventory) | after multifaceted intervention/ before IVF | 126 | 16 (13%) | 136 | 5 (4%) | P = 0.01 | ||
| at uptake of IVF | 147 | 16 (11%) | 151 | 113 (9%) | No difference | |||
| Whelan 2004 (20‐item CES‐D) | 1 week post DA | 94 | 13.8 (1.0) | 107 | 13.4 (1.1) | No difference | ||
| 6 months post DA | 94 | 15.1 (1.1) | 107 | 14.2 (1.2) | No difference | |||
| 12 months post DA | 94 | 13.2 (1.3) | 107 | 12.8 (1.2) | No difference | |||
| Detailed versus simple DA | ||||||||
| Wakefield 2008 (Hospital Anxiety and Depression Scale) | 1 week post | 48 | 61 | No difference | ||||
| Wakefield 2008a (Hospital Anxiety and Depression Scale) | 1 week post | 56 | 63 | No difference | ||||
| Wakefield 2008b (Hospital Anxiety and Depression Scale) | immediately | 55 | 55 | No difference | ||||
| CES‐D: Centre for Epidemiology Studies Depresion Scale; DA: decision aid; IVF: in vitro fertilisation | ||||||||
| Author | Item | N Decision aid | Proportion or Mean (SD) | N Control | Proportion or Mean (SD) | Notes |
| DA vs usual care | ||||||
| 5‐item Decisional Regret Index | 126 | 11.9 | 127 | 14.3 | P = 0.14 | |
| Proportion of patients with decisional regret | 7% | 9% | P=0.91 | |||
| Detailed vs simple DA | ||||||
| Right decision | 63 | 58 (92.06%) | 44 | 42 (95.45%) | No difference | |
| Regret choice | 63 | 8 (12.70%) | 44 | 5 (11.36%) | No difference | |
| Would make same choice | 63 | 54 (85.71%) | 44 | 40 (90.91%) | No difference | |
| Choice did me harm | 63 | 7 (11.11%) | 44 | 3 (6.82%) | No difference | |
| Decision was wise | 63 | 54 (85.71%) | 44 | 41 (93.18%) | No difference | |
| Decisional Regret ‐ 3 items at 26 to 30 weeks gestation | 244 | 9.6 | 252 | 12.8 | P = 0.28 | |
| Decision Regret Scale at 6 months | 41 | 54 | No difference | |||
| Decision Regret Scale | ˜57 | 7.04 (12.12) | ˜63 | 6.39 (13.68) | No difference | |
| Decision Regret Scale | ˜56 | 9.78 (14.49) | ˜49 | 5.13 (10.16) | No difference | |
| DA: decision aid | ||||||
| Study | Scale used | Timing | N Decision aid | Decision aid ‐ mean | N Comparison | Comparison ‐ mean | Notes |
| DA vs usual care | |||||||
| 11‐item self‐efficacy scale | post intervention | 291 | 83% (40.26% SD) | 334 | 79% (33.08% SD) | No difference | |
| Decisional self efficacy | changes from baseline | 75 | + 3.0 (95% CI 0.6 to 5.4) | 77 | + 2.8 (95%CI 0.9 to 4.8) | P = 0.78 | |
| Mean confidence with decision: scale from 1 (low confidence) to 5 (high confidence) | post intervention | 48 | 4 | 59 | 3.6 | P = 0.02 | |
| Decisional self‐efficacy scale | pre‐consultation | 43 | 32 (median) | 40 | 27 (median) | P = 0.001 | |
| Perceived ability to make an informed choice 1‐item; 5‐point Likert scale | 3 days post | 106 | 108 | P = 0.008; DA group more likely to agree that they could make an informed choice about PSA screening | |||
| Perceived ability to make an informed choice 1‐item; 5‐point Likert scale | Immediately post | 131 | 136 | No difference | |||
| Confidence with ability to understand outcomes of hormone replacement therapy, make a decision, engage in discussion with practitioner 3‐items (0 to 10; low to high confidence) | 1 month post | 273 | 78% (18% SD) | 284 | 70% (19% SD) | P < 0.0001 | |
| 9 months post | 261 | 80% (17%SD) | 278 | 75% (20% SD) | P = 0.0004 | ||
| 3 items adapted from the Decisional self‐efficacy scale | 2 week follow‐up | 357 | 4.67 (0.54 SD) | 173 | 4.61(0.62 SD) | P = 0.26 | |
| Detailed versus simple DA | |||||||
| 8‐items (1 to 10; low to high confidence) | post DA | 83 | 78% (16% SD) | 89 | 80% (19% SD) | No difference | |
| 12 months post | 63 | 78% (15% SD) | 74 | 80% (19% SD) | No difference | ||
| CI: confidence interval; DA: decision aid; SD: standard deviation | |||||||
| Study | Scale used | N Decision aid | Decision aid ‐ mean | N Comparison | Comparison ‐ mean | Difference between groups | Notes |
| Consultation length ‐ DA versus usual care | |||||||
| Consultation length using DA in consult (minutes) | 50 | 32.2 (13.0 SD) | 56 | 26.3 (11.5 SD) | +5.9 minutes | P = 0.01 (longer with decision aid) | |
| Consultation length with practitioner post DA (minutes) | 106 | 82 | 105 | 90 | ‐8 minutes | P = 0.03 (shorter with decision aid) | |
| Time spent discussing prostate cancer with practitioner post DA (minutes) ‐patient reported | 196 | 5.3 | 75 | 5.2 | +0.1 minutes | No difference between groups | |
| Time spent discussing prostate cancer with practitioner post DA (minutes) ‐ physician reported | 196 | 3.8 | 75 | 4.2 | ‐0.4 minutes | No difference between groups but physicians thought they spent less time than patients (P < 0.001) | |
| Consultation length using DA in consult (minutes) | 191 | 29.2 (10.7) | 96 | 26.7 (12.5) | +2.5 minutes | P = 0.681 | |
| Consultation length using DA in consult (minutes) | 15 | 24 | 15 | 21 | +3 minutes | P = 0.42 | |
| Consultation length using DA in consult (minutes) | 8 | 44 (39 to 55) | 10 | 21 (19 to 26) | +23 minutes | P = 0.001 Compared computerized decision aid with standard gamble within the consultation to guideline driven consultation | |
| Consultation length with practitioner post DA | |||||||
| 5 to 10 min | 53 | 6 (11.3%) | 54 | 5 (9.3%) | P = 0.91 | ||
| 10 to 15 min | 17 (32.1%) | 19 (35.2%) | |||||
| 15 to 25 min | 15 (28.3%) | 14 (25.9%) | |||||
| 25 to 35 min | 7 (13.2%) | 5 (9.3%) | |||||
| Above 35 min | 8 (15.1%) | 11 (20.4%) | |||||
| Consultation length using DA in consult (minutes) | 50 | 68.3 | 50 | 65.7 | +2.6 minutes | P = 0.53 | |
| Consultation length using DA in consult (minutes) | 52 | 46 | +3.8 minutes | Not statistically significant 3.8 min longer in DA group (95%CI ‐2.9 to 10.5) | |||
| Consultation length ‐ Detailed versus simple DA | |||||||
| Encounter length with practitioner post DA (minutes) | Median 16 minutes for both groups (range 6 to 44) | ||||||
| Cost and resource use ‐ DA versus usual care | |||||||
| Cost‐consequences analysis | 235 | £2019 (SD £741) | 238 | £2033 (SD £677) | no difference | ||
| Cost effectiveness | 204 | $1556 USD | 215 | $2751 USD | Mean difference $1184 (95%CI $684 to $2110) | ||
| Total costs excluding intervention | 57 | £310.3 (SD £602.0) | 48 | £188.8 (SD £300.4) | Mean difference £121.5 (95% CI £ ‐58.9 to £302.0) | ||
| Total costs including intervention | 57 | £594.10 (SD £602) | 48 | £188.8 (SD £300.4) | Mean difference £405.4 (95% CI £224.9 to £585.8) P < 0.001 | ||
| Total costs excluding intervention | 85 | £90.5 | 84 | £90.9 (SD £39.2) | No difference | ||
| Total costs including intervention | 85 | £306.5 (SD £42.8) | 84 | £90.9 (SD £39.2) | Mean difference £215.5 (95% CI £203.1 to £228.0) P < 0.001 | ||
| GP consultations post intervention | 39/51 | 32/54 | P = 0.35 | ||||
| Hospital appointments post intervention | 29/51 | 10/54 | P = 0.06 | ||||
| Mean total savings per couple | Mean total saving per couple in the intervention group were €169.75 ($219.12 USD) | ||||||
| Cost and productivity losses | 184 | €2760 Euro | 179 | €3094 Euro | P = 0.1 No difference between intervention and control when treatment cost and productivity losses were analysed. | ||
| Cost and resource use ‐ Detailed versus simple DA | |||||||
| Healthcare use at 1 year | 171 | 172 | No difference in most services; DA less surgery for herniated disk | ||||
| CI: confidence interval; DA: decision aid; SD: standard deviation | |||||||
| Outcome | Overall mean effect (95% CI) | Without trials having high risk of bias on at least 1 of 7 criteria | Without trials having high or unclear risk of bias for at least 3 of 7 criteria |
| Knowledge ‐ decision aid versus usual care | 13.29 (11.32 to 15.25) n = 42 | 13.67 (11.60 to 15.74) n = 39 | 14.97 (11.84 to 18.10) n = 21 |
| Knowledge ‐ detailed versus simple decision aid | 5.52 (3.9 to 7.15) n = 19 | 5.48 (3.78 to 7.18) n = 18 | 6.97 (2.39 to 11.55) n = 3 |
| Accurate risk perceptions ‐ with probabilities versus no probabilities | 1.82 (1.52 to 2.16) n = 19 | 1.76 (1.48 to 2.10) n = 18 | 2.28 (1.78 to 2.92) n = 7 |
| Values congruent with chosen option | 1.51 (1.17 to 1.96) n = 13 | 1.52 (1.17 to 1.97) n = 13 | 2.15 (1.35 to 3.44) n = 6 |
| Uninformed sub‐scale of Decisional Conflict Scale ‐ decision aid versus usual care | ‐7.26 (‐9.73 to ‐4.78) n = 22 | ‐7.40 (‐10.06 to ‐4.74) n = 21 | ‐8.26 (‐11.74 to ‐4.78) n = 15 |
| Uninformed sub‐scale of Decisional Conflict Scale ‐ detailed versus simple decision aid | ‐2.39 (‐4.39 to ‐0.39) n = 10 | ‐2.39 (‐4.39 to ‐0.39) n = 10 | too few to assess, n = 1 |
| Unclear values sub‐scale of Decisional Conflict Scale ‐ decision aid versus usual care | ‐6.09 (‐8.5 to ‐3.67) n = 18 | ‐6.40 (‐9.02 to ‐3.79) n = 17 | ‐7.02 (‐10.00 to ‐4.04) n = 14 |
| Unclear values sub‐scale of Decisional Conflict Scale ‐ detailed versus simple decision aid | ‐2.31 (‐4.67 to 0.05) n = 10 | ‐2.31 (‐4.67 to 0.05) n = 10 | too few to assess, n = 1 |
| CI: confidence interval | |||
| Outcome | Overall effect | Treatment decision | Screening decision | Video/computer Decision aid | Audio/pamphlet Decision aid | Base risk control | Removal of Outliers* |
| Knowledge ‐ decision aid versus usual care | 15.2 (11.7 to 18.7) | 16.5 (11.9 to 21.2) | 13.1 (7.7 to 18.5) | 21.3 (16.3 to 26.2) | 11.9 (8.3 to 15.6) | 15.5 (11.3 to 19.8) | 17.3 (13.6 to 20.9) (*Bekker 2004, Gattellari 2003, Johnson 2006) |
| Accurate risk perceptions ‐ probabilities versus no probabilities | 1.6 (1.4 to 1.9) | 1.6 (1.4 to 1.9) | 1.6 (1.1 to 2.3) | No data | 1.6 (1.4 to 1.9) | 1.3 (1.2 to 1.5) (P = 0.3) | 1.5 (1.3 to 1.7) (*Gattellari 2003) |
| Uninformed sub‐scale of the Decisional Conflict Scale ‐ decision aid versus usual care | ‐8.4 (‐11.9 to ‐4.8) | ‐9.4 (‐13.3 to ‐5.5) | ‐3.5 (‐12.9 to 5.8) | ‐12.6 (‐19.5 to ‐5.8) | ‐4.9 (‐7.6 to ‐2.3) (P = 0.06) | ‐5.4 (‐7.7 to ‐3.2) (P = 0.11) | ‐6.2 (‐8.4 to ‐4.1) (P = 0.06) (*Montgomery 2003) |
| Unclear values sub‐scale of the Decisional Conflict Scale ‐ decision aid versus usual care | ‐6.3 (‐10.0 to ‐2.7) | ‐6.0 (‐9.8 to ‐2.3) | Insufficient data | ‐8.0 (‐15.1 to ‐1.0) | ‐4.5 (‐8.4 to ‐0.6) | ‐3.6 (‐6.8 to ‐0.5) | ‐4.0 (‐6.7 to ‐1.3) (*Montgomery 2003) |
| Outcome or subgroup title | No. of studies | No. of participants | Statistical method | Effect size |
| 1 Knowledge: DA vs usual care ‐ all studies Show forest plot | 42 | 10842 | Mean Difference (IV, Random, 95% CI) | 13.34 [11.17, 15.51] |
| 2 Knowledge: DA vs usual care ‐ treatment only Show forest plot | 23 | 3977 | Mean Difference (IV, Random, 95% CI) | 13.75 [11.08, 16.43] |
| 3 Knowledge: DA vs usual care ‐ screening only Show forest plot | 19 | 6865 | Mean Difference (IV, Random, 95% CI) | 12.76 [9.66, 15.86] |
| 4 Knowledge: Detailed vs simple decision aids ‐ all studies Show forest plot | 19 | 3531 | Mean Difference (IV, Random, 95% CI) | 5.52 [3.90, 7.15] |
| 5 Knowledge: Detailed vs simple decision aids ‐ treatment only Show forest plot | 12 | 1930 | Mean Difference (IV, Random, 95% CI) | 4.98 [2.64, 7.33] |
| 6 Knowledge: Detailed vs simple decision aids ‐ screening only Show forest plot | 7 | 1601 | Mean Difference (IV, Random, 95% CI) | 6.33 [4.49, 8.17] |
| Outcome or subgroup title | No. of studies | No. of participants | Statistical method | Effect size |
| 1 Accurate risk perceptions ‐ all studies Show forest plot | 19 | 5868 | Risk Ratio (M‐H, Random, 95% CI) | 1.82 [1.52, 2.16] |
| 2 Accurate risk perceptions ‐ treatments only Show forest plot | 12 | 2435 | Risk Ratio (M‐H, Random, 95% CI) | 1.72 [1.47, 2.01] |
| 3 Accurate risk perceptions ‐ screening only Show forest plot | 7 | 3433 | Risk Ratio (M‐H, Random, 95% CI) | 2.03 [1.40, 2.93] |
| 4 Accurate risk perceptions ‐ numbers Show forest plot | 15 | 4776 | Risk Ratio (M‐H, Random, 95% CI) | 2.00 [1.65, 2.43] |
| 5 Accurate risk perceptions ‐ words Show forest plot | 4 | 1092 | Risk Ratio (M‐H, Random, 95% CI) | 1.31 [1.13, 1.52] |
| Outcome or subgroup title | No. of studies | No. of participants | Statistical method | Effect size |
| 1 Values congruent with chosen option ‐ all studies Show forest plot | 13 | 4670 | Risk Ratio (M‐H, Random, 95% CI) | 1.51 [1.17, 1.96] |
| 2 Values congruent with chosen option ‐ treatment only Show forest plot | 3 | 452 | Risk Ratio (M‐H, Random, 95% CI) | 1.35 [0.80, 2.30] |
| 3 Values congruent with chosen option ‐ screening only Show forest plot | 10 | 4321 | Risk Ratio (M‐H, Random, 95% CI) | 1.56 [1.16, 2.11] |
| Outcome or subgroup title | No. of studies | No. of participants | Statistical method | Effect size |
| 1 Decisional conflict: DA vs usual care ‐ all studies Show forest plot | 32 | Mean Difference (IV, Random, 95% CI) | Subtotals only | |
| 1.1 Uncertainty sub‐scale | 23 | 4837 | Mean Difference (IV, Random, 95% CI) | ‐2.47 [‐4.28, ‐0.66] |
| 1.2 Uninformed sub‐scale | 22 | 4343 | Mean Difference (IV, Random, 95% CI) | ‐7.26 [‐9.73, ‐4.78] |
| 1.3 Unclear values sub‐scale | 18 | 3704 | Mean Difference (IV, Random, 95% CI) | ‐6.09 [‐8.50, ‐3.67] |
| 1.4 Unsupported sub‐scale | 19 | 3851 | Mean Difference (IV, Random, 95% CI) | ‐4.77 [‐6.86, ‐2.69] |
| 1.5 Ineffective choice sub‐scale | 19 | 3878 | Mean Difference (IV, Random, 95% CI) | ‐4.86 [‐7.04, ‐2.68] |
| 1.6 Total decisional conflict score | 28 | 5830 | Mean Difference (IV, Random, 95% CI) | ‐6.22 [‐8.00, ‐4.44] |
| 2 Decisional conflict: DA vs usual care ‐ treatment only Show forest plot | 23 | Mean Difference (IV, Random, 95% CI) | Subtotals only | |
| 2.1 Uncertainty sub‐scale | 16 | 3020 | Mean Difference (IV, Random, 95% CI) | ‐3.06 [‐5.33, ‐0.79] |
| 2.2 Uninformed sub‐scale | 17 | 3007 | Mean Difference (IV, Random, 95% CI) | ‐8.06 [‐10.52, ‐5.60] |
| 2.3 Unclear values sub‐scale | 14 | 2474 | Mean Difference (IV, Random, 95% CI) | ‐6.31 [‐9.01, ‐3.61] |
| 2.4 Unsupported sub‐scale | 15 | 2621 | Mean Difference (IV, Random, 95% CI) | ‐5.28 [‐7.74, ‐2.82] |
| 2.5 Ineffective choice sub‐scale | 15 | 2746 | Mean Difference (IV, Random, 95% CI) | ‐6.07 [‐8.41, ‐3.72] |
| 2.6 Total decisional conflict score | 22 | 3783 | Mean Difference (IV, Random, 95% CI) | ‐6.14 [‐7.78, ‐4.50] |
| 3 Decisional conflict: DA vs usual care ‐ screening only Show forest plot | 9 | Mean Difference (IV, Random, 95% CI) | Subtotals only | |
| 3.1 Uncertainty sub‐scale | 7 | 1817 | Mean Difference (IV, Random, 95% CI) | ‐1.32 [‐4.47, 1.83] |
| 3.2 Uninformed sub‐scale | 5 | 1336 | Mean Difference (IV, Random, 95% CI) | ‐4.67 [‐10.61, 1.27] |
| 3.3 Unclear values sub‐scale | 4 | 1230 | Mean Difference (IV, Random, 95% CI) | ‐5.94 [‐13.44, 1.56] |
| 3.4 Unsupported sub‐scale | 4 | 1230 | Mean Difference (IV, Random, 95% CI) | ‐2.94 [‐6.90, 1.02] |
| 3.5 Ineffective choice sub‐scale | 4 | 1132 | Mean Difference (IV, Random, 95% CI) | ‐0.17 [‐1.88, 1.55] |
| 3.6 Total decisional conflict score | 6 | 2047 | Mean Difference (IV, Random, 95% CI) | ‐6.83 [‐12.64, ‐1.03] |
| 4 Decisional conflict: Detailed vs simple decision aid ‐ all studies Show forest plot | 19 | Mean Difference (IV, Random, 95% CI) | Subtotals only | |
| 4.1 Uncertainty sub‐scale | 14 | 2130 | Mean Difference (IV, Random, 95% CI) | ‐2.15 [‐4.42, 0.12] |
| 4.2 Uninformed sub‐scale | 10 | 1264 | Mean Difference (IV, Random, 95% CI) | ‐2.39 [‐4.39, ‐0.39] |
| 4.3 Unclear values sub‐scale | 10 | 1260 | Mean Difference (IV, Random, 95% CI) | ‐2.31 [‐4.67, 0.05] |
| 4.4 Unsupported sub‐scale | 10 | 1268 | Mean Difference (IV, Random, 95% CI) | ‐2.05 [‐5.37, 1.27] |
| 4.5 Ineffective choice sub‐scale | 9 | 1541 | Mean Difference (IV, Random, 95% CI) | ‐1.06 [‐2.83, 0.71] |
| 4.6 Total decisional conflict score | 17 | 3277 | Mean Difference (IV, Random, 95% CI) | ‐1.77 [‐2.64, ‐0.91] |
| 5 Decisional conflict: Detailed vs simple decision aid ‐ treatment only Show forest plot | 12 | Mean Difference (IV, Random, 95% CI) | Subtotals only | |
| 5.1 Uncertainty sub‐scale | 9 | 1101 | Mean Difference (IV, Random, 95% CI) | ‐2.02 [‐6.65, 2.61] |
| 5.2 Uninformed sub‐scale | 6 | 672 | Mean Difference (IV, Random, 95% CI) | ‐1.16 [‐4.40, 2.09] |
| 5.3 Unclear values sub‐scale | 6 | 669 | Mean Difference (IV, Random, 95% CI) | ‐0.46 [‐3.72, 2.80] |
| 5.4 Unsupported sub‐scale | 6 | 674 | Mean Difference (IV, Random, 95% CI) | ‐0.65 [‐3.09, 1.79] |
| 5.5 Ineffective choice sub‐scale | 7 | 849 | Mean Difference (IV, Random, 95% CI) | ‐0.27 [‐2.97, 2.44] |
| 5.6 Total decisional conflict score | 10 | 1732 | Mean Difference (IV, Random, 95% CI) | ‐0.96 [‐2.30, 0.38] |
| 6 Decisional conflict: Detailed vs simple decision aid ‐ screening only Show forest plot | 7 | Mean Difference (IV, Random, 95% CI) | Subtotals only | |
| 6.1 Uncertainty sub‐scale | 5 | 1029 | Mean Difference (IV, Random, 95% CI) | ‐2.16 [‐4.20, ‐0.12] |
| 6.2 Uninformed sub‐scale | 4 | 592 | Mean Difference (IV, Random, 95% CI) | ‐3.42 [‐5.81, ‐1.02] |
| 6.3 Unclear values sub‐scale | 4 | 591 | Mean Difference (IV, Random, 95% CI) | ‐4.54 [‐6.77, ‐2.32] |
| 6.4 Unsupported sub‐scale | 4 | 594 | Mean Difference (IV, Random, 95% CI) | ‐3.65 [‐9.74, 2.44] |
| 6.5 Ineffective choice sub‐scale | 2 | 692 | Mean Difference (IV, Random, 95% CI) | ‐2.18 [‐3.60, ‐0.75] |
| 6.6 Total decisional conflict score | 7 | 1545 | Mean Difference (IV, Random, 95% CI) | ‐2.26 [‐3.33, ‐1.19] |
| Outcome or subgroup title | No. of studies | No. of participants | Statistical method | Effect size |
| 1 Participation in decision making: DA vs usual care ‐ all studies Show forest plot | 14 | Risk Ratio (M‐H, Random, 95% CI) | Subtotals only | |
| 1.1 Patient controlled decision making | 12 | 2438 | Risk Ratio (M‐H, Random, 95% CI) | 1.28 [1.02, 1.60] |
| 1.2 Shared decision making | 12 | 2402 | Risk Ratio (M‐H, Random, 95% CI) | 0.96 [0.82, 1.13] |
| 1.3 Practitioner controlled decision making | 14 | 3234 | Risk Ratio (M‐H, Random, 95% CI) | 0.66 [0.53, 0.81] |
| 2 Participation in decision making: DA vs usual care ‐ treatment only Show forest plot | 11 | Risk Ratio (M‐H, Random, 95% CI) | Subtotals only | |
| 2.1 Patient controlled decision making | 10 | 2147 | Risk Ratio (M‐H, Random, 95% CI) | 1.33 [1.05, 1.68] |
| 2.2 Shared decision making | 10 | 2111 | Risk Ratio (M‐H, Random, 95% CI) | 0.95 [0.78, 1.15] |
| 2.3 Practitioner controlled decision making | 11 | 2318 | Risk Ratio (M‐H, Random, 95% CI) | 0.70 [0.54, 0.90] |
| 3 Participation in decision making: DA vs usual care ‐ screening only Show forest plot | 4 | Risk Ratio (M‐H, Random, 95% CI) | Subtotals only | |
| 3.1 Patient controlled decision making | 3 | 887 | Risk Ratio (M‐H, Random, 95% CI) | 0.99 [0.82, 1.20] |
| 3.2 Shared decision making | 3 | 887 | Risk Ratio (M‐H, Random, 95% CI) | 1.13 [0.89, 1.45] |
| 3.3 Practitioner controlled decision making | 4 | 1512 | Risk Ratio (M‐H, Random, 95% CI) | 0.67 [0.44, 1.01] |
| 4 Participation in decision making: Detailed vs simple decision aid ‐ all studies Show forest plot | 2 | Risk Ratio (M‐H, Random, 95% CI) | Subtotals only | |
| 4.1 Patient controlled decision making | 2 | 687 | Risk Ratio (M‐H, Random, 95% CI) | 1.06 [0.68, 1.64] |
| 4.2 Shared decision making | 2 | 687 | Risk Ratio (M‐H, Random, 95% CI) | 1.07 [0.63, 1.81] |
| 4.3 Practitioner controlled decision making | 2 | 687 | Risk Ratio (M‐H, Random, 95% CI) | 1.12 [0.56, 2.23] |
| 5 Participation in decision making: Detailed vs simple decision aid ‐ treatment only Show forest plot | 2 | Risk Ratio (M‐H, Random, 95% CI) | Subtotals only | |
| 5.1 Patient controlled decision making | 2 | 687 | Risk Ratio (M‐H, Random, 95% CI) | 1.06 [0.68, 1.64] |
| 5.2 Shared decision making | 2 | 687 | Risk Ratio (M‐H, Random, 95% CI) | 1.07 [0.63, 1.81] |
| 5.3 Practitioner controlled decision making | 2 | 687 | Risk Ratio (M‐H, Random, 95% CI) | 1.12 [0.56, 2.23] |
| Outcome or subgroup title | No. of studies | No. of participants | Statistical method | Effect size |
| 1 Proportion undecided: DA vs usual care ‐ all studies Show forest plot | 18 | 4753 | Risk Ratio (M‐H, Random, 95% CI) | 0.59 [0.47, 0.72] |
| 2 Proportion undecided: DA vs usual care ‐ treatment only Show forest plot | 14 | 2830 | Risk Ratio (M‐H, Random, 95% CI) | 0.63 [0.51, 0.78] |
| 3 Proportion undecided: DA vs usual care ‐ screening only Show forest plot | 4 | 1923 | Risk Ratio (M‐H, Random, 95% CI) | 0.52 [0.30, 0.90] |
| 4 Proportion undecided: Detailed vs simple decision aids ‐ all studies Show forest plot | 3 | 352 | Risk Ratio (M‐H, Random, 95% CI) | 0.98 [0.69, 1.37] |
| 5 Proportion undecided: Detailed vs simple decision aids ‐ treatment only Show forest plot | 2 | 151 | Risk Ratio (M‐H, Random, 95% CI) | 1.02 [0.71, 1.47] |
| 6 Proportion undecided: Detailed vs simple decision aids ‐ screening only Show forest plot | 1 | 201 | Risk Ratio (M‐H, Random, 95% CI) | 0.63 [0.21, 1.86] |
| Outcome or subgroup title | No. of studies | No. of participants | Statistical method | Effect size |
| 1 Satisfaction with the choice: DA vs usual care ‐ all studies Show forest plot | 10 | Mean Difference (IV, Random, 95% CI) | Totals not selected | |
| 2 Satisfaction with the choice: DA vs usual care ‐ treatment only Show forest plot | 9 | Mean Difference (IV, Random, 95% CI) | Totals not selected | |
| 3 Satisfaction with the choice: DA vs usual care ‐ screening only Show forest plot | 1 | Mean Difference (IV, Random, 95% CI) | Totals not selected | |
| 4 Satisfaction with the choice: Detailed vs simple DA ‐ all studies Show forest plot | 3 | Mean Difference (IV, Random, 95% CI) | Totals not selected | |
| 5 Satisfaction with the choice: Detailed vs simple DA ‐ treatment only Show forest plot | 3 | Mean Difference (IV, Random, 95% CI) | Totals not selected | |
| 6 Satisfaction with the decision making process: DA vs usual care ‐ all studies Show forest plot | 6 | Mean Difference (IV, Random, 95% CI) | Totals not selected | |
| 7 Satisfaction with the decision making process: DA vs usual care ‐ treatment only Show forest plot | 5 | Mean Difference (IV, Random, 95% CI) | Totals not selected | |
| 8 Satisfaction with the decision making process: DA vs usual care ‐ screening only Show forest plot | 1 | Mean Difference (IV, Random, 95% CI) | Totals not selected | |
| Outcome or subgroup title | No. of studies | No. of participants | Statistical method | Effect size |
| 1 Choice: Surgery over conservative option: DA vs usual care Show forest plot | 15 | Risk Ratio (M‐H, Random, 95% CI) | Subtotals only | |
| 1.1 As treated analysis | 15 | 2915 | Risk Ratio (M‐H, Random, 95% CI) | 0.80 [0.67, 0.95] |
| 1.2 Intention to treat analysis | 15 | 3553 | Risk Ratio (M‐H, Random, 95% CI) | 0.79 [0.68, 0.93] |
| 2 Choice: Surgery over conservative option: Detailed vs simple decision aid Show forest plot | 3 | Risk Ratio (M‐H, Random, 95% CI) | Subtotals only | |
| 2.1 As treated analysis | 3 | 513 | Risk Ratio (M‐H, Random, 95% CI) | 0.82 [0.63, 1.08] |
| 2.2 Intention to treat analysis | 3 | 584 | Risk Ratio (M‐H, Random, 95% CI) | 0.82 [0.63, 1.08] |
| 3 Choice for screening Show forest plot | 28 | Risk Ratio (M‐H, Random, 95% CI) | Subtotals only | |
| 3.1 PSA screening: DA vs usual care | 9 | 3565 | Risk Ratio (M‐H, Random, 95% CI) | 0.87 [0.77, 0.98] |
| 3.2 PSA screening: detailed DA vs simple decision aid | 3 | 782 | Risk Ratio (M‐H, Random, 95% CI) | 0.98 [0.82, 1.17] |
| 3.3 Colorectal cancer screening: DA vs usual care | 10 | 4529 | Risk Ratio (M‐H, Random, 95% CI) | 1.12 [0.95, 1.31] |
| 3.4 Breast cancer genetic testing: DA vs usual care | 4 | 949 | Risk Ratio (M‐H, Random, 95% CI) | 1.01 [0.83, 1.22] |
| 3.5 Prenatal diagnostic testing: Detailed vs simple decision aid | 2 | 443 | Risk Ratio (M‐H, Random, 95% CI) | 0.96 [0.90, 1.03] |
| 4 Choice: Diabetes medication (uptake new medication): DA vs usual care Show forest plot | 3 | 277 | Risk Ratio (M‐H, Random, 95% CI) | 1.84 [0.77, 4.39] |
| 5 Choice: Menopausal hormone therapy: Detailed vs simple decision aid Show forest plot | 3 | 357 | Risk Ratio (M‐H, Random, 95% CI) | 0.73 [0.55, 0.98] |