| 1 Acute exacerbations Show forest plot | 1 | | Odds Ratio (M‐H, Fixed, 95% CI) | Totals not selected |
|
| 1.1 Vaccine >14 serotypes | 1 | | Odds Ratio (M‐H, Fixed, 95% CI) | 0.0 [0.0, 0.0] |
| 1.2 Vaccine 14 or less serotypes | 0 | | Odds Ratio (M‐H, Fixed, 95% CI) | 0.0 [0.0, 0.0] |
| 2 Pneumonia Show forest plot | 3 | 748 | Odds Ratio (M‐H, Fixed, 95% CI) | 0.89 [0.58, 1.37] |
|
| 2.1 Vaccine >14 serotypes | 2 | 645 | Odds Ratio (M‐H, Fixed, 95% CI) | 0.97 [0.61, 1.53] |
| 2.2 Vaccine 14 or less serotypes | 1 | 103 | Odds Ratio (M‐H, Fixed, 95% CI) | 0.42 [0.10, 1.72] |
| 3 Pneumonia by lung function at baseline Show forest plot | 1 | 596 | Odds Ratio (M‐H, Fixed, 95% CI) | 0.71 [0.41, 1.22] |
|
| 3.1 FEV1<40% expected | 1 | 246 | Odds Ratio (M‐H, Fixed, 95% CI) | 0.47 [0.22, 1.01] |
| 3.2 FEV1>=40% expected | 1 | 350 | Odds Ratio (M‐H, Fixed, 95% CI) | 1.12 [0.50, 2.49] |
| 4 Hospital admissions (exacerbation of COPD) Show forest plot | 1 | | Rate Ratio (Fixed, 95% CI) | Totals not selected |
|
| 4.1 Vaccine >14 serotypes | 0 | | Rate Ratio (Fixed, 95% CI) | 0.0 [0.0, 0.0] |
| 4.2 Vaccine 14 or less serotypes | 1 | | Rate Ratio (Fixed, 95% CI) | 0.0 [0.0, 0.0] |
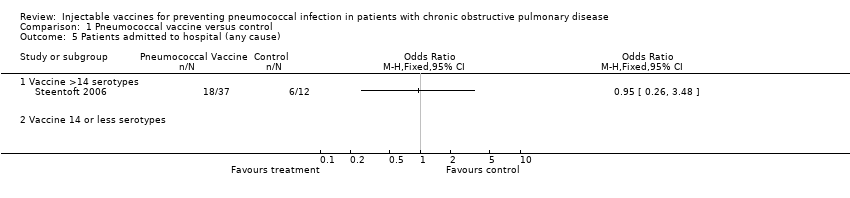
| 5 Patients admitted to hospital (any cause) Show forest plot | 1 | | Odds Ratio (M‐H, Fixed, 95% CI) | Totals not selected |
|
| 5.1 Vaccine >14 serotypes | 1 | | Odds Ratio (M‐H, Fixed, 95% CI) | 0.0 [0.0, 0.0] |
| 5.2 Vaccine 14 or less serotypes | 0 | | Odds Ratio (M‐H, Fixed, 95% CI) | 0.0 [0.0, 0.0] |
| 6 Hospital admissions (pneumonia) Show forest plot | 1 | | Rate Ratio (Fixed, 95% CI) | Totals not selected |
|
| 6.1 Vaccine >14 serotypes | 0 | | Rate Ratio (Fixed, 95% CI) | 0.0 [0.0, 0.0] |
| 6.2 Vaccine 14 or less serotypes | 1 | | Rate Ratio (Fixed, 95% CI) | 0.0 [0.0, 0.0] |
| 7 Hospital admissions (all causes) Show forest plot | 1 | | Rate Ratio (Fixed, 95% CI) | Totals not selected |
|
| 7.1 Vaccine >14 serotypes | 0 | | Rate Ratio (Fixed, 95% CI) | 0.0 [0.0, 0.0] |
| 7.2 Vaccine 14 or less serotypes | 1 | | Rate Ratio (Fixed, 95% CI) | 0.0 [0.0, 0.0] |
| 8 Emergency visits (upper respiratory tract infection) Show forest plot | 1 | | Rate Ratio (Fixed, 95% CI) | Totals not selected |
|
| 8.1 Vaccine >14 serotypes | 0 | | Rate Ratio (Fixed, 95% CI) | 0.0 [0.0, 0.0] |
| 8.2 Vaccine 14 or less serotypes | 1 | | Rate Ratio (Fixed, 95% CI) | 0.0 [0.0, 0.0] |
| 9 Emergency visits (pneumonia) Show forest plot | 1 | | Rate Ratio (Fixed, 95% CI) | Totals not selected |
|
| 9.1 Vaccine >14 serotypes | 0 | | Rate Ratio (Fixed, 95% CI) | 0.0 [0.0, 0.0] |
| 9.2 Vaccine 14 or less serotypes | 1 | | Rate Ratio (Fixed, 95% CI) | 0.0 [0.0, 0.0] |
| 10 Emergency visits (lower respiratory tract infection) Show forest plot | 1 | | Rate Ratio (Fixed, 95% CI) | Totals not selected |
|
| 10.1 Vaccine >14 serotypes | 0 | | Rate Ratio (Fixed, 95% CI) | 0.0 [0.0, 0.0] |
| 10.2 Vaccine 14 or less serotypes | 1 | | Rate Ratio (Fixed, 95% CI) | 0.0 [0.0, 0.0] |
| 11 Emergency visits (any cause) Show forest plot | 1 | | Rate Ratio (Fixed, 95% CI) | Totals not selected |
|
| 11.1 Vaccine >14 serotypes | 0 | | Rate Ratio (Fixed, 95% CI) | 0.0 [0.0, 0.0] |
| 11.2 Vaccine 14 or less serotypes | 1 | | Rate Ratio (Fixed, 95% CI) | 0.0 [0.0, 0.0] |
| 12 Death from cardio‐respiratory causes, 6‐48 months post vaccine Show forest plot | 3 | 888 | Odds Ratio (M‐H, Fixed, 95% CI) | 1.07 [0.69, 1.66] |
|
| 12.1 Vaccine >14 serotypes | 1 | 596 | Odds Ratio (M‐H, Fixed, 95% CI) | 1.11 [0.66, 1.88] |
| 12.2 Vaccine 14 or less serotypes | 2 | 292 | Odds Ratio (M‐H, Fixed, 95% CI) | 0.98 [0.44, 2.18] |
| 13 Death from all causes, 6‐48 months post vaccine Show forest plot | 3 | 888 | Odds Ratio (M‐H, Fixed, 95% CI) | 0.94 [0.67, 1.33] |
|
| 13.1 Vaccine >14 serotypes | 1 | 596 | Odds Ratio (M‐H, Fixed, 95% CI) | 0.98 [0.65, 1.47] |
| 13.2 Vaccine 14 or less serotypes | 2 | 292 | Odds Ratio (M‐H, Fixed, 95% CI) | 0.86 [0.44, 1.66] |