Bisphosphonate untuk osteoporosis disebabkan oleh steroid
Abstract
Background
This is an update of a Cochrane Review first published in 1999. Corticosteroids are widely used in inflammatory conditions as an immunosuppressive agent. Bone loss is a serious side effect of this therapy. Several studies have examined the use of bisphosphonates in the prevention and treatment of glucocorticosteroid‐induced osteoporosis (GIOP) and have reported varying magnitudes of effect.
Objectives
To assess the benefits and harms of bisphosphonates for the prevention and treatment of GIOP in adults.
Search methods
We searched CENTRAL, MEDLINE and Embase up to April 2016 and International Pharmaceutical Abstracts (IPA) via OVID up to January 2012 for relevant articles and conference proceedings with no language restrictions. We searched two clinical trial registries for ongoing and recently completed studies (ClinicalTrials.gov and the World Health Organization (WHO) International Clinical Trials Registry Platform (ICTRP) search portal). We also reviewed reference lists of relevant review articles.
Selection criteria
We included randomised controlled trials (RCTs) satisfying the following criteria: 1) prevention or treatment of GIOP; 2) adults taking a mean steroid dose of 5.0 mg/day or more; 3) active treatment including bisphosphonates of any type alone or in combination with calcium or vitamin D; 4) comparator treatment including a control of calcium or vitamin D, or both, alone or with placebo; and 4) reporting relevant outcomes. We excluded trials that included people with transplant‐associated steroid use.
Data collection and analysis
At least two review authors independently selected trials for inclusion, extracted data, performed ‘risk of bias’ assessment and evaluated the certainty of evidence using the GRADE approach. Major outcomes of interest were the incidence of vertebral and nonvertebral fractures after 12 to 24 months; the change in bone mineral density (BMD) at the lumbar spine and femoral neck after 12 months; serious adverse events; withdrawals due to adverse events; and quality of life. We used standard Cochrane methodological procedures.
Main results
We included a total of 27 RCTs with 3075 participants in the review. Pooled analysis for incident vertebral fractures included 12 trials (1343 participants) with high‐certainty evidence and low risk of bias. In this analysis 46/597 (or 77 per 1000) people experienced new vertebral fractures in the control group compared with 31/746 (or 44 per 1000; range 27 to 70) in the bisphosphonate group; relative improvement of 43% (9% to 65% better) with bisphosphonates; absolute increased benefit of 2% fewer people sustaining fractures with bisphosphonates (5% fewer to 1% more); number needed to treat for an additional beneficial outcome (NNTB) was 31 (20 to 145) meaning that approximately 31 people would need to be treated with bisphosphonates to prevent new vertebral fractures in one person.
Pooled analysis for incident nonvertebral fractures included nine trials with 1245 participants with low‐certainty evidence (downgraded for imprecision and serious risk of bias as a patient‐reported outcome). In this analysis 30/546 (or 55 per 1000) people experienced new nonvertebral fracture in the control group compared with 29/699 (or 42 per 1000; range 25 to 69) in the bisphosphonate group; relative improvement of 21% with bisphosphonates (33% worse to 53% better); absolute increased benefit of 1% fewer people with fractures with bisphosphonates (4% fewer to 1% more).
Pooled analysis on BMD change at the lumbar spine after 12 months included 23 trials with 2042 patients. Eighteen trials with 1665 participants were included in the pooled analysis on BMD at the femoral neck after 12 months. Evidence for both outcomes was moderate‐certainty (downgraded for indirectness as a surrogate marker for osteoporosis) with low risk of bias. Overall, the bisphosphonate groups reported stabilisation or increase in BMD, while the control groups showed decreased BMD over the study period. At the lumbar spine, there was an absolute increase in BMD of 3.5% with bisphosphonates (2.90% to 4.10% higher) with a relative improvement of 1.10% with bisphosphonates (0.91% to 1.29%); NNTB 3 (2 to 3). At the femoral neck, the absolute difference in BMD was 2.06% higher in the bisphosphonate group compared to the control group (1.45% to 2.68% higher) with a relative improvement of 1.29% (0.91% to 1.69%); NNTB 5 (4 to 7).
Pooled analysis on serious adverse events included 15 trials (1703 participants) with low‐certainty evidence (downgraded for imprecision and risk of bias). In this analysis 131/811 (or 162 per 1000) people experienced serious adverse events in the control group compared to 136/892 (or 147 per 1000; range 120 to 181) in the bisphosphonate group; absolute increased harm of 0% more serious adverse events (2% fewer to 2% more); a relative per cent change with 9% improvement (12% worse to 26% better).
Pooled analysis for withdrawals due to adverse events included 15 trials (1790 patients) with low‐certainty evidence (downgraded for imprecision and risk of bias). In this analysis 63/866 (or 73 per 1000) people withdrew in the control group compared to 76/924 (or 77 per 1000; range 56 to 107) in the bisphosphonate group; an absolute increased harm of 1% more withdrawals with bisphosphonates (95% CI 1% fewer to 3% more); a relative per cent change 6% worse (95% CI 47% worse to 23% better).
Quality of life was not assessed in any of the trials.
Authors' conclusions
There was high‐certainty evidence that bisphosphonates are beneficial in reducing the risk of vertebral fractures with data extending to 24 months of use. There was low‐certainty evidence that bisphosphonates may make little or no difference in preventing nonvertebral fractures. There was moderate‐certainty evidence that bisphosphonates are beneficial in preventing and treating corticosteroid‐induced bone loss at both the lumbar spine and femoral neck. Regarding harm, there was low‐certainty evidence that bisphosphonates may make little or no difference in the occurrence of serious adverse events or withdrawals due to adverse events. We are cautious in interpreting these data as markers for harm and tolerability due to the potential for bias.
Overall, our review supports the use of bisphosphonates to reduce the risk of vertebral fractures and the prevention and treatment of steroid‐induced bone loss.
PICO
Ringkasan bahasa mudah
Bisphosphonate bagi merawat osteoporosis yang disebabkan oleh penggunaan steroid
Latar belakang
Steroid (glukokortikosteroid) digunakan secara meluas untuk merawat keradangan. Kehilangan tulang (osteoporosis) dan keretakan tulang belakang merupakan kesan sampingan yang serius akibat terapi ini. Bisphosphonates dianggap sebagai rawatan barisan pertama untuk osteoporosis dan telah digunakan sejak 1990‐an.
Kaedah‐kaedah
Penulis mengkaji penyelidikan yang diterbitkan sehingga April 2016 dan mendapati sejumlah 27 ujian yang layak, dan melibatkan 3075 dewasa dengan penyakit keradangan yang memerlukan rawatan steroid untuk sekurang‐kurangnya satu tahun. Mereka dibahagikan secara rawak untuk menerima rawatan bisphosphonate (sahaja atau dengan kalsium atau vitamin D, atau kedua‐duanya) atau 'tiada rawatan' (diberikan kalsium atau vitamin D atau plasebo). Objektif penulis adalah untuk menentukan manfaat dan kemudaratan bisphosphonate bagi orang dewasa yang menjalani terapi steroid jangka panjang.
Hasil utama
Keretakan tulang belakang baru (12 hingga 24 bulan)
Terdapat 12 kajian melibatkan 1343 orang dalam analisis ini. Kami mendapati bahawa 77 bagi setiap 1000 orang tanpa rawatan mengalami keretakan tulang belakang baru berbanding 44 bagi setiap 1000 (julat 27 hingga 70) orang yang mengambil bisphosphonate; terdapat faedah mutlak dengan 2% kurang orang (kurang 5% hingga lebih 1%) mengalami keretakan tulang apabila mengambil bisphosphonate.
Hampir 31 orang (julat 20 hingga145) perlu dirawat dengan bisphosphonate untuk mengelakkan keretakan tulang belakang pada seseorang.
Keretakan bukan tulang‐belakang baru (12 hingga 24 bulan)
Terdapat sembilan kajian melibatkan 1245 orang dalam analisis ini. Kami mendapati bahawa 55 bagi setiap 1000 orang tanpa rawatan mengalami keretakan bukan tulang‐belakang baru berbanding 42 bagi setiap 1000 (julat 25 hingga 69) orang yang mengambil bisphosphonate; terdapat faedah mutlak dengan 1% kurang orang (kurang 4% hingga lebih 1%) mengalami keretakan bukan tulang‐belakang apabila mengambil bisphosphonates.
Ketumpatan mineral tulang pada tulang belakang lumbar (BMD) pada 12 bulan
Terdapat 23 kajian melibatkan 2042 orang untuk hasil kajian ini. Kami mendapati bahawa BMD tulang belakang lumbar orang yang mengambil bisphosphonate 3.50% lebih tinggi (2.90% hingga 4.10% lebih tinggi) daripada orang yang tidak menjalani rawatan.
Hampir tiga orang (julat 2 hingga 3) perlu dirawat dengan bisphosphonate selama 12 bulan untuk seseorang dapat melihat perbezaan minimal penting dalam BMD pada tulang belakang lumbar.
BMD leher femoral (atas tulang paha) pada 12 bulan
Terdapat 18 kajian melibatkan 1665 orang untuk hasil kajian ini. Kami mendapati bahawa BMD pada leher femoral 2.06% lebih tinggi dalam kumpulan bisphosphonate (1.45% hingga lebih 2.68%) daripada orang tanpa rawatan.
Hampir lima orang (julat 4 hingga 7) perlu dirawat dengan bisphosphonate selama 12 bulan untuk seseorang dapat melihat perbezaan minimal penting dalam BMD pada bahagian leher femoral.
Kesan buruk yang serius (memerlukan kemasukan ke hospital, mengancam kehidupan atau kematian)
Terdapat 15 kajian melibatkan 1703 orang untuk hasil kajian ini. Penulis mendapati bahawa 162 bagi setiap 1000 orang tanpa rawatan mengalami kesan buruk yang serius berbanding 147 bagi setiap 1000 (julat 120 hingga 181) yang mengambil bisphosphonate; terdapat peningkatan mutlak kemudaratan dengan 0% lebih kesan serius (kurang 2% hingga lebih 2%) dengan bisphosphonate.
Penarikan diri disebabkan oleh kesan buruk
Terdapat 15 kajian melibatkan 1790 orang untuk hasil kajian ini. Kami mendapati bahawa 73 bagi setiap 1000 orang tanpa rawatan menarik diri berbanding dengan 77 setiap 1000 (julat 56 hingga 107) orang yang mengambil bisphosphonate; peningkatan kemudaratan mutlak sebanyak 1% lebih penarikan diri disebabkan oleh kesan buruk (kurang 1% hingga lebih 3%) dengan bisphosphonate.
Kesimpulan penulis
Berdasarkan bukti‐bukti berkepastian sederhana hingga tinggi, penulis mendapati bahawa bisphosphonate adalah bermanfaat dalam mencegah keretakan tulang belakang baru dan mencegah serta merawat kehilangan tulang pada lumbar tulang belakang dan leher femoral yang disebabkan oleh steroid. Untuk mencegah keretakan bukan tulang‐belakang pula, penulis mendapati sedikit atau tiada perbezaan sama ada pesakit menggunakan bisphosphonates atau tidak, walaupun bukti‐bukti adalah berkepastian rendah kerana kaedah yang digunakan untuk menilai keretakan bukan tulang‐belakang tertakluk kepada bias.
Penulis mendapati bahawa tiada atau sedikit perbezaan dalam bilangan kesan buruk serius atau penarikan diri disebabkan oleh kesan buruk apabila membandingkan bisphosphonates dengan tiada rawatan. Bukti bagi hasil kajian tersebut adalah berkepastian rendah dan penulis berhati‐hati dalam membuat kesimpulan yang kukuh tentang kemudaratan bisphosphonate yang hanya berdasarkan hasil ukuran ini.
Secara keseluruhannya, ulasan penulis menyokong penggunaan bisphosphonate untuk mengurangkan risiko keretakan tulang belakang dan dalam aspek pencegahan dan rawatan kehilangan tulang berpunca dari steroid.
Authors' conclusions
Summary of findings
| Bisphosphonates (alone or with calcium and/or vitamin D) compared with control (calcium and/or vitamin D and/or placebo) for adults with GIOP | ||||||
| Patient or population: adults with GIOP Settings: ambulatory Intervention: bisphosphonates (alone or with calcium and/or vitamin D) Comparison: control (calcium and/or vitamin D and/or placebo) | ||||||
| Outcomes | Illustrative comparative risks* (95% CI) | Relative effect | No of Participants | Quality of the evidence | Comments | |
| Assumed risk | Corresponding risk | |||||
| Control (calcium and/or vitamin D and/or placebo) | Bisphosphonates (alone or with calcium and/or vitamin D) | |||||
| Incident vertebral fractures Radiographic follow‐up: 12‐24 months | 77 per 1000 | 44 per 1000 | RR 0.57 (0.35 to 0.91) RD ‐0.02 (‐0.05 to 0.01) | 1343 | ⊕⊕⊕⊕ | Absolute increased benefit 2% fewer people with fractures using bisphosphonates (95% CI 5.00% fewer to 1.00% more) Relative per cent change 43% improvement with bisphosphonates (95% CI 9.00% to 65.00% better) NNTB = 31 (95% CI 20 to 145) |
| Incident nonvertebral fractures Radiographic follow‐up: 12‐24 months | 55 per 1000 | 42 per 1000 | RR 0.79 (0.47 to 1.33) RD ‐0.01 (‐0.04 to 0.01) | 1245 | ⊕⊕⊝⊝ due to risk of bias and imprecision | Absolute increased benefit 1% fewer people with fractures using bisphosphonates (95% CI 4.00% fewer to 1.00% more) Relative per cent change 21% improvement with bisphosphonates (95% CI 33.00% worse to 53.00% better) NNTB = n/a4 |
| Lumbar spine BMD DEXA follow‐up: 12 months | Mean per cent change in BMD across control groups was ‐3.19% (‐8.08% to 1.70%) from baseline5 | Mean per cent change in BMD from baseline in bisphosphonate groups was 3.50% higher than control groups (2.90% to 4.10% higher) | ‐ | 2042 | ⊕⊕⊕⊝ due to indirectness | Absolute increased benefit 3.50% with bisphosphonates (95% CI 2.90 to 4.10) Relative per cent change 1.10% (95% CI 0.91 to 1.29) with bisphosphonates NNTB = 3 (95% CI 2 to 3) |
| Femoral neck BMD DEXA follow‐up: 12 months | Mean per cent change in BMD across control groups was ‐1.59% (‐10.49% to 7.31%) from baseline 5 | Mean per cent change in BMD from baseline in bisphosphonate groups was 2.06% higher than control groups (1.45% to 2.68% higher) | ‐ | 1665 | ⊕⊕⊕⊝ due to indirectness | Absolute increased benefit 2.06% with bisphosphonates (95% CI 1.45 to 2.68) Relative per cent change 1.29% with bisphosphonates (95% CI 0.91 to 1.69) NNTB = 5 (95% CI 4 to 7) |
| Serious adverse events follow‐up: 12‐24 months | 162 per 1000 | 147 per 1000 | RR 0.91 (0.74 to 1.12) RD 0.00 (‐0.02, 0.02) | 1703 | ⊕⊕⊕⊝ due to risk of bias and imprecision | Absolute increased harm 0% more adverse events with bisphosphonates (95% CI 2.00% fewer to 2.00% more) Relative per cent change 9% improvement with bisphosphonates (95% CI 12.00% worse to 26.00% better) NNTH = n/a4 |
| Withdrawals due to adverse events follow‐up: 12‐24 months | 73 per 1000 | 77 per 1000 | RR 1.06 (0.77 to 1.47) RD 0.01 (‐0.01 to 0.03) | 1790 | ⊕⊕⊕⊝ due to risk of bias and imprecision | Absolute increased harm 1% more withdrawals with bisphosphonates (95% CI 1.00% fewer to 3.00% more) Relative per cent change 6% worsening with bisphosphonates (95% CI 47.00% worse to 23.00% better) NNTH = n/a4 |
| Quality of life | 0 per 1000 | 0 per 1000 | Not estimable | (0 studies) | This outcome was not assessed by any of the trials | |
| *The basis for the assumed risk (e.g. the median control group risk across studies) is provided in footnotes. The corresponding risk (and its 95% confidence interval) is based on the assumed risk in the comparison group and the relative effect of the intervention (and its 95% CI). | ||||||
| GRADE Working Group grades of evidence | ||||||
| 1Vertebral fractures meet calculated OIS threshold of 1174 (calculation not shown ‐ Brant 2014) 2Downgraded for risk of bias: nonvertebral fractures were a patient‐reported, subjective outcome 3Downgraded for imprecision: total sample size is below calculated optimal information size (OIS) (calculations not shown ‐ Brant 2014) and the 95% confidence interval around the pooled estimate of effect includes both the possibility of no effect and appreciable benefit or harm 4Number needed to treat for an additional beneficial outcome (NNTB) or number needed to treat for an additional harmful outcome (NNTH) is not applicable when result is not statistically significant 5We calculated mean baseline risk for the control group in RevMan using generic inverse variance (calculations not shown) 6Most heterogeneity explained through sensitivity analyses 7Downgraded for indirectness: bone density is a surrogate marker for fracture risk 8Clinically relevant change in BMD: the natural history of participants starting steroid therapy based on control arms in our prevention trials is to see a 1%‐6% decrease in lumbar spine BMD and 1%‐4% decrease in femoral neck BMD in the first year of treatment. We have used an SMD of 0.5 as an estimate of the minimal clinically important difference for BMD change to calculate the NNTB (Schünemann 2011b) 9Downgraded for risk of bias: the protocols for the collection of harm data in a large number of trials were unclear | ||||||
Background
Description of the condition
Corticosteroids are widely used in inflammatory conditions as an immunosuppressive agent. Diseases treated with corticosteroids include connective tissue diseases, respiratory diseases, haematological diseases, inflammatory bowel disease and organ transplantation. Bone loss is a serious side effect of this therapy, commonly referred to as glucocorticoid‐induced osteoporosis (GIOP), and is likely mediated through a variety of mechanisms.
The most widely accepted mechanisms in the pathogenesis of GIOP are the direct inhibition of bone formation and increase in bone resorption. Inhibition of bone formation is mediated by a decrease in osteoblast differentiation, impaired maturation and function, and premature osteoblast apoptotic death, as evidenced by decreased serum osteocalcin levels (Canalis 2007; Saag 2003). Glucocorticoids enhance osteoclast‐mediated bone resorption by suppressing osteoprotegerin; stimulating RANK/RANKL; and decreasing apoptosis, all of which result in increased levels of osteoclasts. There is also evidence of decreased calcium absorption, increased calcium excretion and decreased serum concentration of sex hormones (Canalis 2007; Saag 2003). In addition to their effect on bone density, steroids are known to affect bone architecture and quality (Kanis 2007; Saag 2003; Van Staa 2002). These two factors likely contribute to a lower BMD threshold for fracture in people with GIOP.
There is controversy in the literature regarding the minimum dose and duration of corticosteroids required to produce bone loss and fractures, with reports of doses as low as 2.5 to 7.5 mg/day leading to statistically significant bone loss and a 2.5 fold increase in vertebral fractures (Canalis 2007; Steinbuch 2004; Van Staa 2002). Fracture risk may be confounded by the underlying inflammatory disease processes themselves, which may independently lead to bone loss and fractures (Saag 2003).
Description of the intervention
Bisphosphonates have been used to treat osteoporosis since the 1990s and are considered to be first line treatment when pharmacological therapy is recommended. Various types of bisphosphonates exist, most commonly in oral pill form, although intravenous bisphosphonates are also available and in North America are reserved traditionally for individuals who are unable to tolerate oral bisphosphonates. Oral regimes include daily or weekly administration, whereas intravenous bisphosphonates are administered every few months or on a yearly basis (National Osteoporosis Foundation 2014).
How the intervention might work
Bisphosphonates reduce bone loss through various mechanisms of actions that are not fully understood. In general, bisphosphonates are shown to reduce the rate of bone turnover through a strong affinity for bone mineral, which translates to a decrease in bone loss. They also have an inhibitory effect that decreases the number and activity of osteoclasts, which dissolve bone as part of the normal bone turnover process (Russell 2007). Bisphosphonate efficacy, measured as per cent change in BMD over one year, ranges from ‐3% to +12% in bisphosphonate studies.
Why it is important to do this review
A consequence of low bone mass is the development of vertebral and nonvertebral fractures. GIOP often manifests as clinically silent until the development of a fracture. BMD is commonly used as an intermediate outcome to extrapolate fracture risk, however it should be noted that the correlation between BMD and fracture risk that exists in post‐menopausal osteoporosis has not been established in corticosteroid‐induced osteoporosis. Therefore it is important to have direct evidence of the benefit of bisphosphonates in reducing fracture risk in GIOP.
The routine use of prophylactic therapy to prevent bone loss and fractures is suboptimal despite recommendations from American College of Rheumatology (ACR) practice guidelines (Grossman 2010). Recent North American prescription patterns for GIOP prevention demonstrate a prevalence of anti‐resorptive co‐prescription of only 15% to 37% in people receiving long‐term steroid treatment (Curtis 2005; Feldstein 2005; Mckeown 2012).
A Cochrane Systematic Review and meta‐analysis is useful to determine the benefits and harms of bisphosphonates in the prevention and treatment of GIOP and fractures in order to justify and encourage their routine use.
Objectives
To assess the benefits and harms of bisphosphonates for the prevention and treatment of GIOP in adults.
Methods
Criteria for considering studies for this review
Types of studies
Randomised controlled trials (RCT).
Types of participants
Participants were men or women over the age of 18 with underlying inflammatory disorders, initiating treatment or currently being treated with systemic corticosteroids, and who had not received bisphosphonates in the six months prior to the start of the study. We defined prevention studies by bisphosphonate treatment starting within three months of initiating corticosteroids, while treatment (secondary prevention) studies included those that initiated bisphosphonate treatment beyond three months of starting corticosteroid therapy. These definitions are widely used in GIOP literature and are based on the notion that rapid bone loss is seen within the first three to six months of corticosteroid use (Canalis 2007; Van Staa 2002).
Due to controversy in the literature regarding low‐dose steroids and the risk of osteoporosis and fracture, we used only those trials where the mean corticosteroid dose was 5 mg/day or higher. Participants had to be continuing corticosteroid treatment throughout the entire course of the study. We excluded trials that included people with transplant‐associated steroid use from the review.
Types of interventions
We included trials that evaluated any bisphosphonate alone or in combination with calcium or vitamin D, or both, as the active treatment group. The control groups were taking calcium or vitamin D, or both, alone or with placebo.
Types of outcome measures
Benefits
Major outcomes
-
Number of participants with incident radiographic vertebral fractures.
-
Number of participants with incident radiographic nonvertebral fractures.
-
Per cent change in BMD of the lumbar spine and femoral neck measured by dual energy X‐ray absorptiometry (DEXA).
-
Quality of life using any measurement tool.
Minor outcomes
-
Per cent change in BMD of the lumbar spine using low‐dose versus standard‐dose bisphosphonates.
-
Per cent change in BMD of the femoral neck using low‐dose versus standard‐dose bisphosphonates.
Harms
Major outcomes
-
Serious adverse events (requiring hospitalisation, life threatening or fatal).
-
Withdrawals due to adverse events.
Timing of outcome assessment
-
We extracted incident fracture data, serious adverse events and withdrawals due to adverse events for any time points where available.
-
We extracted data for our BMD outcomes at 12 months and at 18 to 24 months for use in separate analyses.
-
We extracted data on low‐dose versus standard‐dose bisphosphonates at 12 months.
-
If data existed at multiple time points within the above periods, we only extracted data at the latest possible time point of each period.
Search methods for identification of studies
Electronic searches
The original review searched MEDLINE and Embase from inception to 1997 (Appendix 1). For this review update we searched the Cochrane Central Register of Controlled Trials (CENTRAL Issue 5, 2015); MEDLINE, Embase, and the International Pharmaceutical Abstracts (IPA) via OVID for relevant articles and conference proceedings. We also searched two clinical trials registries (ClinicalTrials.gov and World Health Organization (WHO) International Clinical Trials Registry Platform (ICTRP) search portal) for ongoing and recently completed studies.
-
CENTRAL from inception to 1 April 2016 (Appendix 2)
-
MEDLINE from January 1997 to 25 January 2010 (Appendix 3) and updated searches from January 2010 to 3 April 2013 and January 2013 to 1 April 2016 (Appendix 4)
-
Embase from January 1997 to 27 January 2010 (Appendix 5) and updated searches from January 2010 to 3 April 2013 and January 2013 to 1 April 2016 Appendix 6)
-
IPA from 1970 to 27 January 2012 (Appendix 7)
-
clinicaltrials.gov/ from inception to March 15 2016 (search terms were (diphosphonates OR biphosphonates) AND osteoporosis)
-
WHO ICTRP from inception to 15 March 2016 (search terms were bisphosphonates AND osteoporosis)
Differences in search strategy keywords reflect changes in database indexing over time. All languages were included in the search and retrieved.
Searching other resources
We reviewed the reference lists of relevant review articles and the existing Cochrane Review by the same author (Homik 1999) to identify any other potentially relevant trials.
Data collection and analysis
Selection of studies
We included RCTs that satisfied the following initial criteria:
-
prevention or treatment of GIOP;
-
included adults taking a mean steroid dose of 5 mg/day or more;
-
active treatment included any bisphosphonate alone or in combination with calcium or vitamin D;
-
comparator included calcium and/or vitamin D alone or with placebo; and
-
reported relevant outcomes (see Types of outcome measures).
We excluded trials including people with transplant‐associated steroid use.
After fulfilling the above initial criteria, we looked for the following in order for a study to be included in the review:
-
adequate description of the intervention medications in terms of administration route and schedule;
-
use of standard doses of bisphosphonates (National Osteoporosis Foundation 2014) in at least one treatment group; and
-
for incident vertebral fractures, radiographic screening was performed routinely, not just in the presence of symptoms, and the criteria used to assess incident fractures were clearly outlined.
Two review authors (JH and JY or JH and CA) independently performed the primary screen of abstracts and full‐text reviews of the eligible reports. Any disagreement on the inclusion of an article was resolved through discussion between the two authors.
Data extraction and management
Two review authors (JH, CA) independently extracted data from the included trials. In cases of discrepancies in extracted data, the two authors would refer back to the original articles and reach a consensus. For each included trial we recorded the following:
-
type of trial (method; prevention versus treatment);
-
participant characteristics (age, sex, prevalent vertebral fractures and underlying diseases);
-
mean steroid dose;
-
intervention characteristics for each treatment group;
-
outcome data;
-
fracture assessment criteria.
Assessment of risk of bias in included studies
Two review authors (JH, JY) independently assessed the methodological quality of the trials included in the primary and secondary analyses using the Cochrane tool for assessing risk of bias (Higgins 2011a). We assessed the following domains:
-
sequence generation;
-
allocation concealment;
-
blinding of participants and personnel;
-
blinding of outcome assessment;
-
incomplete outcome data;
-
selective reporting; and
-
other bias (i.e. source of funding).
We judged the above criteria using 'Yes': low risk of bias; 'No': high risk of bias; and 'Unclear': lack of information or uncertainty over the potential for bias. The review authors (JH, JY, CA) resolved any disagreements through discussion.
Measures of treatment effect
We analysed the results of the trials using Review Manager (RevMan) 5.3 statistical software (RevMan 2014). We conducted pooled analyses for dichotomous variables (incident vertebral and nonvertebral fractures, withdrawals due to adverse events and serious adverse events) using the Mantel‐Haenszel risk ratio (RR) with 95% confidence intervals (CI) (Deeks 2011).
We analysed continuous data (BMD outcomes) as the mean difference (MD) in BMD between the two treatment groups and the corresponding standard deviation. That is, the per cent change in treatment group BMD minus the per cent change in placebo group BMD. We conducted analysis separately for bone loss at the femoral and lumbar sites, because of the differential effects of corticosteroids on cortical and trabecular bone mass (Rickers 1984). Each trial was weighted taking into account sample size and variance in the outcome variable.
To enhance the interpretability of our outcomes we also calculated relative per cent changes; absolute risk differences; and for outcomes with statistically significant differences between intervention groups, the number needed to treat for an additional beneficial outcome (NNTB) or the number needed to treat for an additional harmful outcome (NNTH). These calculations are described below under the heading ‘Summary of findings' table.
Unit of analysis issues
The unit of analysis for each outcome was the participant. For studies containing more than two intervention groups, multiple pair‐wise comparisons were performed so that the same group of participants was included only once in the meta‐analysis.
Dealing with missing data
We worked with a biostatistician to compute missing or incomplete data from other available statistics. When studies reported the median change in BMD instead of the mean, we used the median as the best estimate for the mean.
When studies did not report standard deviation (SD), we calculated it using either the standard error of the mean (SEM), an exact P value, 95% CI, range, or interquartile range (IQR):
-
when SEM was reported, we calculated SD as the product of the SEM and the square root of n, where n is the number of subjects in the group;
-
from an exact P value, we calculated SEM as the mean difference between treatment and control groups divided by the z‐stat, where z‐stat was calculated in Microsoft Excel as “=normsinv(1‐p/2)” and then converted to SD using the above formula;
-
from a 95% CI, SEM was calculated as the difference between the upper confidence bound and the lower confidence bound divided by 3.92 and then converted to SD;
-
if using range, we calculated SEM as range divided by the corresponding divisor based on sample size as per Wiebe 2006;
-
if given IQR, we calculated SD as IQR divided by 1.35;
-
where no numerical data were provided, we measured SD from the error bars of a graph;
-
where no error measurement was reported either numerically or graphically, we estimated SD using the mean coefficient of variation of the other trials, weighted by the sample size of each study;
-
where number of participants completing was not reported, the number of participants randomised was used as n.
Where data were imputed or calculated as described above, we reported this in the ‘Characteristics of included studies’ tables.
Assessment of heterogeneity
We assessed heterogeneity of the data by visual inspection of forest plots and using the I2 statistic (Higgins 2003), for which we interpreted a value greater than 50% as evidence of substantial heterogeneity (Schünemann 2011a). Where substantial heterogeneity was found, we explored the data further using subgroup analyses in an attempt to explore the causes for heterogeneity.
'Summary of findings' table
Our major outcomes (incident vertebral and nonvertebral fractures, BMD change after 12 months at the lumbar spine and femoral neck, serious adverse events, withdrawals due to adverse events, and quality of life) are presented in the summary of findings Table for the main comparison produced using GRADEpro software (GRADEpro GDT 2015). This provides information on the certainty of evidence, the magnitude of intervention effect, and the summary of data available for each outcome. The overall certainty of evidence for each outcome was graded (high, moderate, low and very low) using the GRADE approach (Schünemann 2013). For dichotomous outcomes with low event rates, we used an optimal information size (OIS) calculator (Brant 2014) to assess the precision of data.
We included the absolute risk difference and the relative per cent change for each outcome. For statistically significant differences, we also calculated NNTB or NNTH.
For dichotomous outcomes we calculated the absolute risk difference using the risk difference (RD) statistic in RevMan 5.3 (RevMan 2014) expressed as a percentage; we calculated the relative per cent change as risk ratio (RR) minus one and expressed it as a percentage; we calculated the NNTB/NNTH from the control group event rate and the risk ratio using the Visual RX NNT calculator (Cates 2015).
For continuous outcomes, we calculated absolute risk difference as the mean difference between intervention and control group. We calculated the relative difference as the mean difference divided by the mean baseline risk of the control group, calculated in RevMan 5.3 (RevMan 2014) using generic inverse variance. We calculated NNTB/NNTH using the Wells calculator software available at Cochrane Musculoskeletal editorial office. There are no published or agreed upon minimal clinically important differences (MCID) for BMD results that we are aware of. In cases where this occurs, the Cochrane Handbook for Systematic Reviews of Interventions recommends using a standardised mean difference (SMD) of 0.5 as an estimate of the minimal clinically important difference (MCID) for each outcome, a rule of thumb representing a moderate effect (Schünemann 2011b). It is difficult to ascribe a minimal clinically important difference in terms of per cent change in BMD as a predictable correlation between BMD and fracture risk has not been established in the GIOP setting. BMD changes only account for a small increase in fracture risk (Kanis 2007; Saag 2003; Van Staa 2002). The clinical relevance of BMD outcomes is further discussed in 'Summary of main results.'
Data synthesis
We analysed both dichotomous and continuous data using a random‐effects model to provide a conservative estimate of effect.
Subgroup analysis and investigation of heterogeneity
A subgroup analysis planned a priori compared the treatment effect in prevention trials (bisphosphonates starting within three months of initiating steroids) and in treatment trials (bisphosphonates starting beyond three months of steroid therapy).
Where sufficient data existed, we considered post‐hoc subgroup analyses with regard to:
-
gender and menopausal status;
-
mean steroid dose;
-
prevalent fractures (whether incident fractures occurred in participants with prevalent fractures).
Sensitivity analysis
We planned exploratory sensitivity analyses a priori to evaluate the effect of:
-
study quality, based on the exclusion of studies that were not blinded; and
-
route of administration of bisphosphonate (oral and parenteral).
Results
Description of studies
Results of the search
Details of the study selection are presented in Figure 1. Our initial search of the databases, clinical trials registries and handsearching provided 3934 records after the results were merged and duplicate records removed. A primary screen of the abstracts or protocols resulted in the exclusion of 3347 records. We retrieved the full‐texts of the remaining 587 records and assessed them for eligibility. Based on the full‐text review; 534 were excluded, eight were identified as 'awaiting classification' and six were ongoing trials. The remaining 39 trials underwent data extraction. Another 12 were found to be ineligible and were thus excluded, leaving 27 trials to be included in the review (25 studies from the updated search and two studies from the existing Cochrane Review). Altogether, a total of 27 trials were included in the review, which reported on 3075 participants.
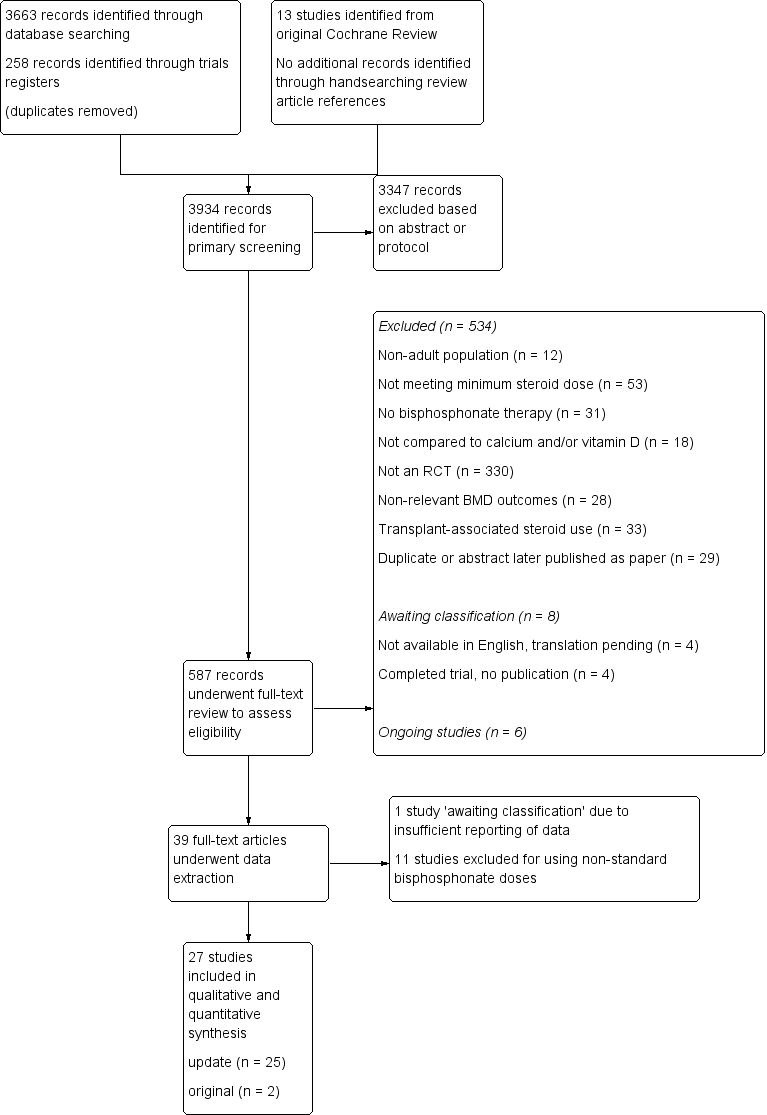
Study flow diagram.
Included studies
Key characteristics of the included trials are contained in the Characteristics of included studies tables.
Interventions
Most trials used alendronate (n = 9) or cyclic etidronate (n = 8). Other bisphosphonates used include risedronate (n = 2), pamidronate (n = 3), clodronate (n = 3), and ibandronate (n = 2).
Underlying diseases
Underlying conditions that required steroid treatment included rheumatological, respiratory, nephrological, gastrointestinal, haematological, dermatological and neurological systemic inflammatory diseases. Most trials (n = 19) included participants with a variety of diseases. Two trials included only participants with rheumatoid arthritis (Lems 2006; Van Offel 2001); two trials included only participants with systemic lupus erythematosus (Li 2010; Yeap 2008); Wolfhagen 1997 reported only on participants with primary biliary cirrhosis; Herrala 1998 included only participants with chronic obstructive pulmonary disease (COPD) and asthma; Abitbol 2007 included only participants with inflammatory bowel disease; and Tee 2012 included only participants with immunobullous skin diseases.
Mean steroid dose
Although a minimum mean steroid dose of 5 mg/day was reported in the protocols of our included trials, we found that there was much variability between trials in the actual mean steroid doses used throughout the study period. This was not surprising given the variation in underlying inflammatory diseases and considering that steroid regimes are tapered to fit individual clinical context.
Three trials reported a mean steroid dose of 5 to 7.5 mg/day (Abitbol 2007; Geusens 1998; Hakala 2012). Ten trials reported a mean steroid dose of approximately 7.5 mg/day (Cortet 1999; Frediani 2003; Herrala 1998; Jenkins 1999; Lems 2006; Pitt 1998; Saag 1998; Sambrook 2003; Skingle 1997; Van Offel 2001). Eleven trials reported a mean steroid dose of 10 to 15 mg/day (Adachi 1997; Adachi 2001; Boutsen 1997; Boutsen 2001; De Nijs 2006; Reid 2000; Roux 1998; Stoch 2009; Tee 2012; Wolfhagen 1997; Yeap 2008). Two trials reported a mean steroid dose of greater than 20 mg/day (Cohen 1999; Saadati 2008). Li 2010 was unclear in describing the mean steroid dose used throughout the study period and reported a range of steroid doses that varied between under 7.5 mg/day and 40 mg/day.
Prevalent vertebral fractures
Twelve trials had participants with vertebral fractures at baseline (Abitbol 2007; Adachi 1997; Adachi 2001; Cohen 1999; De Nijs 2006; Frediani 2003; Geusens 1998; Lems 2006; Reid 2000; Saag 1998; Sambrook 2003; Skingle 1997). Hakala 2012 included prevalent vertebral fractures but excluded participants with symptomatic or two or more radiographic vertebral fractures. Three trials reported no prevalent vertebral fractures in their participants (Li 2010; Pitt 1998; Yeap 2008), whereas Boutsen 2001; Tee 2012 and Wolfhagen 1997 excluded participants with prevalent vertebral fractures. The remaining eight trials did not explicitly state whether or not there were prevalent vertebral fractures (Boutsen 1997; Cortet 1999; Herrala 1998; Jenkins 1999; Roux 1998; Saadati 2008; Stoch 2009; Van Offel 2001).
Multiple treatment groups
Six of the included trials reported on multiple treatment groups. The standard‐dose arms and control groups were included in the major analyses (Boutsen 2001; Cohen 1999; Herrala 1998; Lems 2006; Reid 2000; Saag 1998). If a low‐dose arm was reported, we included the studies in a minor outcome analysis of standard‐dose versus low‐dose bisphosphonates (Boutsen 2001; Cohen 1999; Lems 2006; Reid 2000; Saag 1998). One of the multi‐group trials using clodronate reported on groups with dosages of 1600 mg and 2400 mg daily, which were both higher than the current standard and therefore not eligible for the standard‐dose versus low‐dose meta‐analysis (Herrala 1998).
Another trial used two distinct pair‐wise comparisons with two independent treatment groups and two independent placebo groups (Sambrook 2003). In this study, one pair‐wise comparison involved steroid use of less than six months and the other comparison involved steroid use for longer than six months. Data were entered as two separate trials, as there was no overlap in participants.
Prevention versus treatment of GIOP
Thirteen trials involved the prevention of GIOP and 14 trials involved the treatment of GIOP. For trials that had mixed prevention and treatment individuals, we categorised the trial based on whether the majority of participants were considered 'prevention' or 'treatment' as per our criteria described in Types of participants. Saadati 2008 was unclear in describing the type of study so we categorised it as a treatment trial.
Outcomes
Incident radiographic vertebral fractures
Twenty‐one trials reported this outcome, 12 trials were included and nine trials excluded from meta‐analysis.
Two trials combined fracture data from their 5 mg and 10 mg alendronate treatment arms (Lems 2006; Saag 1998) and although 5 mg daily alendronate was not considered a standard dose, we included these data in the analysis. Of the 12 included studies, seven were prevention trials (Abitbol 2007; Adachi 1997; Boutsen 1997; Boutsen 2001; Cohen 1999; De Nijs 2006; Tee 2012) and five were treatment trials (Lems 2006; Pitt 1998; Reid 2000; Saag 1998; Sambrook 2003).
Since fractures occur at a variable length of time after the onset of osteoporosis, we included trials in which the follow‐up for new fractures occurred between 12 to 24 months, to better ascertain the benefits of bisphosphonates in fracture prevention. We excluded one trial that assessed incident fractures after four years (Frediani 2003) as the timeline differed too greatly from all other trials. Four trials were excluded because they only reported radiographically confirmed symptomatic vertebral fractures and not all participants were screened for vertebral fractures (Roux 1998; Cortet 1999; Geusens 1998; Stoch 2009). We excluded Jenkins 1999 because vertebral radiographs were reported on less than half of completing participants, despite a protocol stating routine radiographic screening at baseline and 52 weeks. Saadati 2008 did not outline their assessment criteria for fractures and was therefore excluded. One trial reported the number of vertebral fractures rather than the number of participants who experienced fractures and could not be included in the analysis (Skingle 1997). Fracture data from Adachi 2001 were not included as this study was a partial cohort from Saag 1998.
Fracture Assessment Criteria
Methods for assessing incident vertebral fractures included quantitative morphometry, semiquantitative grading and a spinal deformity index. Data were analysed regardless of which of the three methods of fracture determination was used.
Saag 1998 and its extension study Adachi 2001 assessed fractures using both semiquantitative and quantitative methods. For these two trials we included the semiquantitative data as more trials reported incident fractures using this method.
Two trials (Cohen 1999; Reid 2000) used the quantitative morphometric criteria of Kiel 1995 and Melton 1993 in which incident fractures were defined as either a reduction in vertebral height of 15% or more (for intact vertebrae at baseline) or 4 mm or more (for fractured vertebrae at baseline). Two other trials (Abitbol 2007; Lems 2006) defined incident fractures by quantitative morphometry as a reduction in vertebral height of 20% or 4 mm or more, or both, based on criteria outlined by Black 1996 and Genant 1996.
Six trials used semiquantitative grading with a minimum reduction in vertebral height of 20% as criteria for incident vertebral fractures (Adachi 1997; Adachi 2001; Pitt 1998; Saag 1998; Sambrook 2003; Tee 2012) as per Genant 1993 and Van Kujik 1995 and one trial used or a reduction in height of 15% or more (De Nijs 2006) according to Kleerekoper 1984.
Two trials used the Minne 1988 spinal deformity index (Boutsen 1997; Boutsen 2001), which determines the extent of vertebral compression by comparison of the actual vertebral body height to the presumable original height.
Incident radiographic nonvertebral fractures
Thirteen trials reported this outcome, nine trials were included and four trials excluded from meta‐analysis.
Fracture sites included but were not limited to the hip, wrist, forearm, and midfoot. No atypical femur fractures were reported in any of the included trials. We reported all nonvertebral fracture data together as the majority of trials did not include complete information on specific fracture sites. Three trials reported nonvertebral fractures but provided the total number of fractures rather than the number of participants suffering from fractures and were therefore not included in the analysis (Adachi 1997; Roux 1998; Stoch 2009). Another trial reported nonvertebral fractures occurring after four years and was not included in the analysis (Frediani 2003). Protocols for assessing nonvertebral fractures were typically not stated in study procedures. We assumed all nonvertebral fractures were self‐reported symptomatic ones.
BMD data
12 months (lumbar spine)
Twenty‐six trials reported this outcome, 23 trials were included and three trials excluded from meta‐analysis.
Two trials (Saadati 2008; Sambrook 2003) reported data that were insufficient for inclusion in the lumbar spine analysis. Tee 2012 reported BMD using T scores and was therefore not included in the analysis.
12 months (femoral neck)
Twenty‐three trials reported this outcome, 18 trials were included and five trials excluded from meta‐analysis.
Reported data from Saadati 2008; Sambrook 2003 and Skingle 1997 were insufficient for inclusion in the femoral neck analysis. Van Offel 2001 reported “no change” in femoral neck BMD without providing any numerical data and was therefore not included in the femoral neck analysis. Tee 2012 reported BMD using T scores and was therefore not included in the femoral neck analysis.
18 to 24 months
Nine trials reported BMD outcomes at 18 to 24 months at both the lumbar spine and femoral neck and were included in separate analyses. One multi‐arm trial used two distinct pair‐wise comparisons with two independent treatment groups and two independent placebo groups (Sambrook 2003). In this study, one pair‐wise comparison involved steroid‐use of less than six months and the other comparison involved steroid‐use greater than six months. The data were entered as two separate trials, therefore each analysis has 10 pair‐wise comparisons.
Low‐dose versus standard‐dose bisphosphonates
Five trials included multi‐group trials with head‐to‐head comparisons of standard‐dose versus low‐dose bisphosphonates. All five trials reported on lumbar spine BMD and were included in this meta‐analysis. Four trials reported on femoral neck BMD and were all included in the analysis on femoral neck BMD.
Serious adverse events
Nineteen trials reported this outcome, 15 trials were included and four were excluded from the meta‐analysis.
Serious adverse events were most commonly defined as any event requiring hospitalisation, that was life‐threatening or fatal. One trial that we included defined serious adverse events as any event that rendered a patient incapable of performing normal activities (Reid 2000). Few included trials provided details on the types of serious adverse events that occurred (see Characteristics of included studies for further details). Five trials only reported deaths and did not specify the occurrence of other forms of serious adverse events (Adachi 1997; De Nijs 2006; Geusens 1998; Herrala 1998; Jenkins 1999) though we still included these trials in the analysis. The protocol for assessing adverse events was not clearly stated in seven of the trials included in this analysis (Adachi 1997; Geusens 1998; Jenkins 1999; Lems 2006; Pitt 1998; Saag 1998; Tee 2012).
Deaths
From the included trials, nine deaths were reported in the experimental groups (Adachi 1997; De Nijs 2006; Geusens 1998; Hakala 2012; Herrala 1998; Pitt 1998; Stoch 2009; Tee 2012) and five deaths were reported in the control groups (Boutsen 1997; De Nijs 2006; Herrala 1998; Jenkins 1999; Pitt 1998). In none of these cases did the study authors consider the deaths to be related to the study or placebo drugs. See Characteristics of included studies for further details.
Data from Adachi 2001 were not included as it was an extension trial of Saag 1998, which provided more complete data. Cortet 1999; Sambrook 2003 and Yeap 2008 each reported deaths but did not specify from which treatment group they occurred and were therefore not included in the analysis.
Withdrawals due to adverse events
Twenty‐one trials reported this outcome, 15 trials were included and six trials were excluded from meta‐analysis.
For this analysis we included withdrawals due to all adverse events regardless of their association to either the control or drug of study. We did not include death as a withdrawal due to an adverse event. See Characteristics of included studies for further details on types of adverse events leading to study withdrawal.
Four trials did not specify which treatment groups the withdrawals came from (Herrala 1998; Lems 2006; Sambrook 2003; Yeap 2008) and were therefore excluded from the analysis. Another trial did not provide numerical data on the withdrawals (Cortet 1999) and could not be included. Data from Adachi 2001 were not included as it was an extension trial of Saag 1998.
Quality of life
This outcome was not assessed by any of the trials.
Excluded studies
From our search of the databases, clinical trials registries and handsearching, we excluded 534 of the 587 articles that underwent full‐text review. The main reason for exclusion was not being an RCT (n = 330). We excluded 33 trials as they involved transplant‐associated steroid use. See Figure 1 for complete details. During data extraction from 39 studies, we excluded 11 for using only non‐standard bisphosphonate doses (Benucci 2009; Fujii 2006; Jinnouchi 2000; Kikuchi 2006; Kitazaki 2008; Nakayamada 2004; Okada 2008; Sato 2003; Takeda 2008; Takei 2010; Toukap 2005), and we categorised Ozoran 2007 as 'awaiting classification' pending data clarification from the study authors due to insufficient reporting of relevant outcome data. We have included the references of the 12 trials that we excluded during data extraction as they did meet our initial criteria for inclusion and may still be of relevance (details in Characteristics of excluded studies). In addition, eight trials were deemed to be 'awaiting classification' (details in Characteristics of studies awaiting classification). Of these, four trials identified from trials registers were completed but with no publications available and four trials were published as articles in Japanese with no English versions available (Imanishi 2006; Nakamura 2002; Okazaki 2015; Suzuki 2015). We are currently awaiting the translation of these four trials and will update the review once information is available. Finally, we identified six ongoing trials that may be of relevance to this review (details in Characteristics of ongoing studies).
The existing Cochrane Review included 13 trials and of these, only two trials were included in this review (Adachi 1997; Wolfhagen 1997). Five trials were conference abstracts that have been subsequently published and the full publications were included (Jenkins 1999; Pitt 1998; Roux 1998; Saag 1998; Skingle 1997). We excluded four trials because they were not RCTs. We excluded one trial because it measured BMD by computerised tomography (CT) instead of DEXA. Another trial from the original review reported outcome measurements at six months only. We decided that this time point was not clinically significant and not analysed in this review update, therefore we excluded this trial.
Risk of bias in included studies
Detailed results of this assessment are found in a table attached to the Characteristics of included studies table and are summarised below in Figure 2 and Figure 3.

Risk of bias graph: review authors' judgements about each risk of bias item presented as percentages across all included studies.
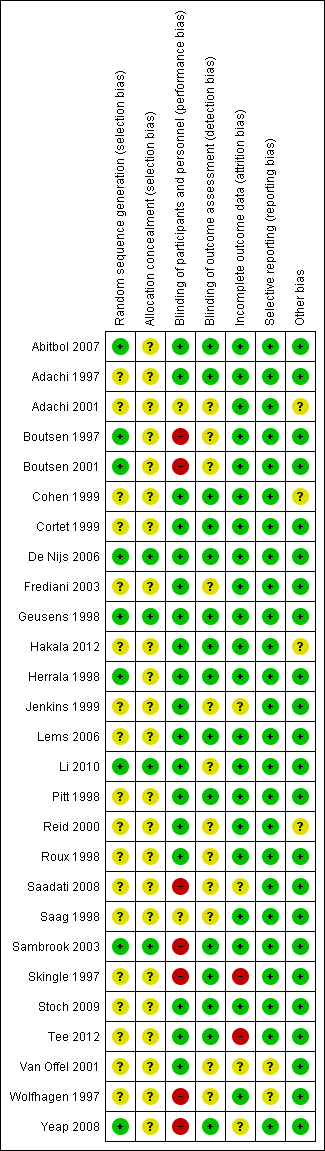
Risk of bias summary: review authors' judgements about each risk of bias item for each included study.
Allocation
Four studies clearly described random sequence generation methods and allocation concealment and were at low risk for selection bias (De Nijs 2006; Geusens 1998; Li 2010; Sambrook 2003).
Eighteen studies did not provide details on random sequence generation methods or allocation concealment and so were at unclear risk for selection bias (Adachi 1997; Adachi 2001; Cohen 1999; Cortet 1999; Frediani 2003; Hakala 2012; Jenkins 1999; Lems 2006; Pitt 1998; Reid 2000; Roux 1998; Saadati 2008; Saag 1998; Skingle 1997; Stoch 2009; Tee 2012; Van Offel 2001; Wolfhagen 1997).
Five studies were at low risk of bias for randomisation as they provided clear descriptions of random sequence generation but were considered to have unclear risk of bias for allocation concealment, as no allocation details were provided (Abitbol 2007; Boutsen 1997; Boutsen 2001; Herrala 1998; Yeap 2008).
Blinding
Twelve studies provided adequate detail on blinding of participants, personnel and outcome assessment, so were at low risk for performance and detection bias (Abitbol 2007; Adachi 1997; Cohen 1999; Cortet 1999; De Nijs 2006; Geusens 1998; Hakala 2012; Herrala 1998; Lems 2006; Pitt 1998; Stoch 2009; Tee 2012)
Two studies did not provide details on blinding of participants, personnel or outcome assessors, so were at unclear risk for performance and detection bias (Adachi 2001; Saag 1998).
Six studies provided adequate detail on blinding of participants/personnel but did not mention blinding of outcome assessment so were at low risk for performance bias and unclear risk for detection bias (Frediani 2003; Jenkins 1999; Li 2010; Reid 2000; Roux 1998; Van Offel 2001).
Three studies had explicit and appropriate outcome assessment blinding, but clearly stated that participants/personnel were not blinded or were not placebo‐controlled, so were at high risk for performance bias and low risk for detection bias (Sambrook 2003; Skingle 1997; Yeap 2008).
Four studies had insufficient participant/personnel blinding and did not provide clear details on outcome assessment blinding, so were at high risk for performance bias and unclear risk for detection bias (Boutsen 1997; Boutsen 2001; Saadati 2008; Wolfhagen 1997).
Incomplete outcome data
Twenty‐one studies had sufficiently complete outcome data, adequately addressed reasons for dropout, with dropout similar between both groups, so were at low risk for attrition bias (Abitbol 2007; Adachi 1997; Adachi 2001; Boutsen 1997; Boutsen 2001; Cohen 1999; Cortet 1999; De Nijs 2006; Frediani 2003; Geusens 1998; Hakala 2012; Herrala 1998; Lems 2006; Li 2010; Pitt 1998; Reid 2000; Roux 1998; Saag 1998; Sambrook 2003; Stoch 2009; Wolfhagen 1997).
Three studies did not clearly address the reasons for participant dropout, so were at unclear risk for attrition bias (Saadati 2008; Van Offel 2001; Yeap 2008). Jenkins 1999 had low dropout and addressed reasons for dropout but only screened vertebral fractures radiographically in 13 of 28 completing participants. No explanation was provided for the low yield of vertebral radiographs so this study was at unclear risk for attrition bias.
Skingle 1997 had 31% of participants that did not complete the first year and only 23 of 38 completing participants were screened for radiographic vertebral fractures. Tee 2012 had 30% of participants that did not complete the study with the main reason being that they were unavailable for follow‐up. Both these studies were at high risk for attrition bias.
Selective reporting
Twenty‐five studies reported all outcomes that were listed in the methods section and were therefore considered to be at low risk for reporting bias (Abitbol 2007; Adachi 1997; Adachi 2001; Boutsen 1997; Boutsen 2001; Cohen 1999; Cortet 1999; De Nijs 2006; Frediani 2003; Geusens 1998; Hakala 2012; Herrala 1998; Jenkins 1999; Lems 2006; Li 2010; Pitt 1998; Reid 2000; Roux 1998; Saadati 2008; Saag 1998; Sambrook 2003; Skingle 1997; Stoch 2009; Tee 2012; Yeap 2008).
Van Offel 2001 had no mention of adverse events. Wolfhagen 1997 took spinal radiographs to validate DEXA measurements only, not as an outcome. Both these studies were at unclear risk for reporting bias.
Other potential sources of bias
Eighteen studies were judged to be at low risk as no other sources of bias were apparent (Abitbol 2007; Boutsen 1997; Boutsen 2001; Cortet 1999; Frediani 2003; Geusens 1998; Herrala 1998; Jenkins 1999; Lems 2006; Li 2010; Pitt 1998; Roux 1998; Saadati 2008; Skingle 1997; Stoch 2009; Tee 2012; Van Offel 2001; Wolfhagen 1997). Five studies were also rated as low risk and had pharmaceutical industry contribution that was limited to supplying the study drug or providing grants, with no industry authorship (Adachi 1997; De Nijs 2006; Saag 1998; Sambrook 2003; Yeap 2008).
Four studies were rated as having an unclear risk of bias due to other sources. Two studies had industry authorship (Cohen 1999; Hakala 2012); and Reid 2000 reported industry involvement in the design, implementation and analysis of the trial. We rated Adachi 2001 as unclear because it was an extension study, which has the potential risk of unblinding.
Effects of interventions
See: Summary of findings for the main comparison Bisphosphonates versus control for adults with GIOP
Benefits
Incident radiographic vertebral fractures
Twelve trials (1343 participants) reported the number of participants with new vertebral fractures. We combined symptomatic and asymptomatic fractures. In this analysis 46/597 (or 77 per 1000) people experienced new vertebral fractures in the control group compared with 31/746 (or 44 per 1000; range 27 to 70) in the bisphosphonate group. The resulting RR was statistically significant at 0.57 (95% CI 0.35 to 0.91) (Analysis 1.1) signifying a relative per cent improvement of 43% (95% CI 9% to 65% better) with bisphosphonates; an absolute increased benefit of 2% fewer people experiencing fractures (95% CI 5% fewer to 1% more); and NNTB of 31 (95% CI 20 to 145) meaning that approximately 31 people would need to be treated with bisphosphonates to prevent new vertebral fractures in one person (summary of findings Table for the main comparison). There was no statistical heterogeneity in the incident vertebral fracture analysis (I2 = 0%). Overall, there was high‐certainty evidence for a reduction in new vertebral fractures with bisphosphonates.
Incident radiographic nonvertebral fractures
In the analysis of nine trials (1245 participants), 30/546 (or 55 per 1000) people experienced new nonvertebral fractures in the control group compared with 29/699 (or 42 per 1000; range 25 to 69) in the bisphosphonate group. The resulting RR was 0.79 (95% CI 0.47 to 1.33) although this was not statistically significant (Analysis 1.2). There was a relative per cent improvement of 21% (95% CI 33% worse to 53% better) with bisphosphonates; an absolute increased benefit of 1% fewer people experiencing fractures (95% CI 4% fewer to 1% more); NNTB not applicable as results were not statistically significant (summary of findings Table for the main comparison). There was no statistical heterogeneity in the nonvertebral fracture analysis (I2 = 0%). Overall, there was low‐certainty evidence that bisphosphonates may make little or no difference in the reduction of new nonvertebral fractures (downgraded for risk of bias and imprecision).
Per cent change in lumbar spine BMD
Bisphosphonate treatment up to 12 months
In the analysis of 23 trials (2042 participants), bisphosphonate use resulted in a statistically significant MD of 3.50% (95% CI 2.90% to 4.10%) (Analysis 2.1) representing an absolute benefit with BMD 3.5% higher with bisphosphonates as compared to calcium or vitamin D alone (95% CI 2.90% to 4.10% higher); a relative per cent improvement of 1.1% (95% CI 0.91% to 1.29% better); NNTB 3 (95% CI 2 to 3) meaning that approximately three people would need to be treated with bisphosphonates over 12 months in order to see a minimally important difference in lumbar spine BMD in one person (summary of findings Table for the main comparison). There was substantial heterogeneity among these trials (I2 = 70%) that we found was adequately explained through subgroup and sensitivity analyses shown below. Overall, there was moderate‐certainty evidence of a clinically important increase in lumbar spine BMD with bisphosphonates (downgraded for indirectness).
Bisphosphonate treatment 18 to 24 months
In the analysis of nine trials (10 treatment groups) reporting on 802 participants, bisphosphonate use resulted in a statistically significant 5.49% (95% CI 3.47% to 7.51%) increase in BMD as compared to treatment with calcium or vitamin D alone (Analysis 2.5). There was substantial heterogeneity in this analysis (I2 = 91%). We removed one trial that differed from the others by using IM bisphosphonates in a female‐only population, which reduced the I2 statistic to 41% (result not shown).
Per cent change in femoral neck BMD
Bisphosphonate treatment up to 12 months
Results from 18 trials (1665 participants) showed that bisphosphonate use resulted in a statistically significant MD of 2.06% (95% CI 1.45 to 2.68) (Analysis 3.1) representing an absolute benefit with BMD 2.06% higher in the bisphosphonate group as compared to treatment with calcium or vitamin D alone (95% CI 1.45% to 2.68% higher); a relative per cent improvement of 1.29% (95% CI 0.91% to 1.69% better); NNTB 5 (95% CI 4 to 7) meaning that approximately five people would need to be treated with bisphosphonates over 12 months in order to see a minimally important difference in femoral neck BMD in one person (summary of findings Table for the main comparison). The heterogeneity among these trials was not substantial (I2 = 34%). Overall, there was moderate‐certainty evidence of a clinically important increase in femoral neck BMD with bisphosphonates (downgraded for indirectness) .
Bisphosphonate treatment 18 to 24 months
Analysis of nine trials (10 treatment groups) reporting on 802 participants showed that bisphosphonate use resulted in a statistically significant 3.28% (95% CI 1.70% to 4.87%) increase in BMD as compared to treatment with calcium or vitamin D alone (Analysis 3.5). There was substantial heterogeneity among the trials in this analysis (I2 = 83%). One trial differed by using intramuscular (IM) bisphosphonates and another trial had a lower mean participant age, however removing single trials did not appreciably alter the heterogeneity.
Quality of life
Quality of life was not assessed by any of the trials.
Per cent change in BMD at 12 months with low‐dose versus standard‐dose bisphosphonates
Lumbar spine
Head‐to‐head analysis of five trials (642 participants) resulted in a MD of 0.95% (95% CI 0.37% to 1.53%) that was statistically significant (Analysis 2.4). There was no statistical heterogeneity in this analysis (I2 = 0%)
Femoral neck
Head‐to‐head analysis of four trials (542 participants) showed a MD of 0.74% (95% CI ‐0.42% to 1.90%) that did not reach statistical significance with substantial heterogeneity among trials (I2 = 54%) (Analysis 3.4).
Harms
Serious adverse events
Fifteen trials (1703 participants) reported on serious adverse events with 131/811 (or 162 per 1000) people experiencing serious adverse events in the control group compared to 136/892 (or 147 per 1000; range 120 to 181) in the bisphosphonate group. The RR for serious adverse events in the bisphosphonate group was 0.91 (95% CI 0.74 to 1.12) (Analysis 4.1); an absolute increased harm of 0% more serious adverse events (95% CI 2.00% fewer to 2.00% more); a relative per cent change 9% improvement (95% CI 12% worse to 26% better); NNTH not applicable as there was no statistically significant difference (summary of findings Table for the main comparison). There was no statistical heterogeneity in the analysis on serious adverse events (I2 = 0%). Overall, there was low‐certainty evidence (downgraded for imprecision and risk of bias) that bisphosphonates may make little or no difference in the number of serious adverse events.
Withdrawals due to adverse events
Fifteen trials (1790 participants) reported withdrawals due to adverse events. Not all adverse events were listed, but in those trials that did have information, the most common adverse events were upper gastrointestinal symptoms and musculoskeletal pain. In this analysis, 63/866 (or 73 per 1000) people withdrew in the control group compared to 76/924 (or 77 per 1000; range 56 to 107) in the bisphosphonate group. The RR for withdrawals due to adverse events in the bisphosphonate group was not statistically significant at 1.06 (95% CI 0.77 to 1.47) (Analysis 4.2); an absolute increased harm of 1% more withdrawals with bisphosphonates (95% CI 1% fewer to 3% more); a relative per cent change 6% worse (95% CI 47% worse to 23% better); NNTH not applicable as there was no statistically significant difference between groups (summary of findings Table for the main comparison). There was no substantial heterogeneity in the withdrawals due to adverse events analysis (I2 = 2%). Overall, there was low‐certainty evidence (downgraded for imprecision and risk of bias) that bisphosphonates may make little or no difference in the number of withdrawals due to adverse events.
Subgroup analyses
Prevention and treatment studies
A pre‐specified subgroup analysis was used to analyse separately prevention and treatment effects in trials reporting on BMD at the lumbar spine and femoral neck at 12 months.
Lumbar spine
In the prevention analysis (12 trials, 930 participants) bisphosphonate use resulted in an increase in BMD of 3.92% (95% CI 2.90% to 4.94%) as compared to treatment with calcium or vitamin D alone (Analysis 2.1). In the treatment analysis (11 trials, 1112 participants), bisphosphonate use resulted in an increase in BMD of 3.19% (95% CI 2.64% to 3.73%) as compared to treatment with calcium or vitamin D alone (Analysis 2.1). Both were statistically significant. There was substantial heterogeneity among the studies in the prevention analysis (I2 = 80%) but not the treatment analysis (I2 = 16%). A sub‐subgroup analysis was done for the prevention analysis to separate trials using parenteral and oral bisphosphonates (Analysis 2.6). This appears to explain the significant heterogeneity in the prevention analysis. There were no parenteral bisphosphonates used in treatment trials.
Femoral neck
In the prevention analysis (10 trials, 751 participants), bisphosphonate use resulted in a statistically significant increase in BMD of 2.79% (95% CI 1.99% to 3.59%) as compared to treatment with calcium or vitamin D alone (Analysis 3.1). In the treatment analysis (eight trials, 914 participants), the increase in BMD was 1.53% (95% CI 0.73% to 2.33%) (Analysis 3.1). Both were statistically significant. There was no substantial heterogeneity in either the prevention or treatment analyses (I2 = 0% and 44%, respectively).
Gender and menopausal status
Fracture data were not broken down by gender and menopausal status in the individual trials included in our analysis and therefore post‐hoc subgroup analyses were not possible for fracture outcomes. Sufficient data on BMD at the lumbar spine and femoral neck at 12 months were available to analyse subgroups of gender and menopausal status (men, premenopausal women, postmenopausal women). Please see Analysis 2.7 and Analysis 3.6 for full details on results.
Mean steroid dose
In the vertebral fracture, nonvertebral fracture and 12 months BMD outcomes, Cohen 1999 was the only trial to use high‐dose steroids (greater or equal to 20 mg/day).
Prevalent fractures
No trials reported outcome data separately for those participants with and without a prevalent fracture.
Sensitivity analyses
Risk of bias
To analyse the effect of study quality, based on the exclusion of non‐blinded trials (high risk for performance or detection bias) we performed a sensitivity analysis. Sensitivity analyses excluding high‐risk trials for the outcomes of incident vertebral fractures; incident nonvertebral fractures; BMD at the lumbar spine and femoral neck after 12 months and 18 to 24 months; serious adverse events; withdrawals due to adverse events; BMD using low‐ versus standard‐dose bisphosphonates did not appreciably change the effect sizes and did not resolve heterogeneity among trials (results not shown).
Route of administration
We performed a sensitivity analysis based on route of administration. We analysed trials using oral bisphosphonates separately from those using parenteral bisphosphonates. The trials reported BMD data at the lumbar spine and femoral neck at 12 months.
Lumbar spine
At the lumbar spine, pooled analysis of 18 trials (1767 participants) using oral treatments showed a statistically significant result with MD 3.25% (95% CI 2.88% to 3.63%) (Analysis 2.2).
Analysis of five trials (275 participants) using parenteral treatments had a statistically significant MD 5.12% (95% CI 2.35% to 7.89%) at the lumbar spine (Analysis 2.3). There was no statistical heterogeneity in the oral analysis (I2 = 0%) but heterogeneity was substantial in the lumbar spine parenteral treatment analysis (I2 = 90%).
Femoral neck
At the femoral neck, analysis of 15 trials (1574 participants) using oral administration had a statistically significant MD 1.92% (95% CI 1.31% to 2.53%) (Analysis 3.2).
Analysis of three trials (91 participants) using parenteral therapy was also statistically significant with MD 4.56% (95% CI 2.07% to 7.05%) (Analysis 3.3). There was no substantial heterogeneity in either the oral or parenteral treatment analyses at the femoral neck (I2 = 34% and 0%, respectively).
Discussion
Summary of main results
We carried out this review to evaluate the benefits and harms of bisphosphonates in GIOP. We examine benefits in terms of fracture outcomes and BMD change; and include subgroup analyses of primary prevention versus treatment. The review provides new data on oral and parenteral bisphosphonates and a direct comparison of low and standard bisphosphonate doses. Harm data include serious adverse events and withdrawals due to adverse events.
Fracture Data
The most clinically relevant outcome is the effect of bisphosphonates on fracture prevention. Results from our analyses show that bisphosphonates reduce the total number of incident vertebral fractures by approximately 40% with a NNTB of 31. There was no statistically significant reduction in fractures at nonvertebral sites, including the hip.
Harm Data
There were no statistically significant differences in either the incidence of serious adverse events or withdrawals due to adverse events between active drug and control groups. The most frequently reported adverse events in our review were musculoskeletal (myalgias and arthralgias) and upper gastrointestinal; though typically mild in nature and seen in both the bisphosphonate and control groups. Gastrointestinal side effects, or even fear of experiencing them, are cited as a primary reason for decreased compliance or discontinuation of treatment (Pazianas 2011). Other common associated side effects cited in the literature include transient asymptomatic hypercalcaemia and a transient acute phase response (two to three days of flu‐like symptoms most often associated with the initiation of intravenous treatment). These were seen sporadically in the trials included in our review.
Although high‐certainty epidemiological evidence is limited, osteonecrosis of the jaw is a rare but serious adverse event that is associated with bisphosphonate use; specifically with long‐standing use and frequent intravenous dosing (Pazianas 2011).
Bisphosphonates are associated with an increased risk of atypical femur fractures (subtrochanteric or diaphyseal). Estimated incidences vary from 12.5 to 31 of 10,000 people/year with approximately 10 years of alendronate exposure (Abrahamsen 2010; Dell 2012). Current data are conflicting, however most studies agree that the absolute risk of atypical femur fracture with bisphosphonates is low. A recent meta‐analysis pooled nine observational trials and one RCT (n = 658,497) and found a statistically significant increased risk of atypical femur fractures with bisphosphonates; adjusted OR 1.99 (95% CI 1.28 to 3.10) (Lee 2015). Although the clinical implication is uncertain, both long‐term steroid use and systemic inflammatory disease processes are considered to be risk factors associated with atypical femur fractures (Lee 2015).
Neither osteonecrosis of the jaw nor atypical femur fractures were reported in any of the trials included in our review.
Experts still recommend caution in using bisphosphonates in women of childbearing age until further systematic research has been performed (Djokanovic 2008; Losada 2010).
BMD Data
Our major BMD outcomes show statistically significant and clinically meaningful increases in bone density at the lumbar spine and femoral neck after 12 months, with MD of 3.50% and 2.06%, respectively. The NNTB at the lumbar spine after 12 months is 3, and the NNTB at the femoral neck after 12 months is 5. It is generally believed that steroid‐induced bone loss is not as prominent in cortical bone (Rickers 1984) and that changes in BMD are not as dramatic at the femoral neck, as it takes longer for cortical bone to turn over. Our results support these beliefs and data from the placebo arms of the trials show a smaller magnitude of bone loss at the femoral neck than the lumbar spine.
Our NNTBs for the change in BMD at the lumbar spine and femoral neck are based on an SMD of 0.5 as an estimate of the minimal clinically important difference for BMD change (Schünemann 2011b). It is difficult to express our findings in terms of a minimally clinically relevant change in BMD as that value has not been established for GIOP. Fractures in GIOP often occur at a higher BMD than seen in primary osteoporosis and, unlike primary osteoporosis, a predictable correlation between BMD and fracture risk has not been established in the GIOP setting. Furthermore, improvement in BMD only accounts for a small part of the reduction in vertebral fracture risk observed with antiresorptive therapy (Cummings 2002; Kanis 2007; Saag 2003; Van Staa 2002).
A previous meta‐analysis evaluating BMD improvements and vertebral fracture risk reduction in postmenopausal women and elderly men suggests that each 1% improvement in spine BMD during anti‐resorptive therapy is associated with a 0.03 decrease in relative risk of vertebral fracture (Cummings 2002). Although the meta‐analysis is neither specific to GIOP nor to bisphosphonates; it does provide a rough clinical context to consider our findings of a 3.5% difference between treatment and control group lumbar spine BMD after 12 months of bisphosphonate therapy.
The natural history of patients starting steroid therapy based on control arms in our prevention trials is to see a 1% to 6% decrease in lumbar spine BMD and 1% to 4% decrease in femoral neck BMD in the first year of treatment.
We were interested in analysing the prevention and treatment trials separately as the two clinical scenarios are distinct. In general, the prevention trials showed greater bone loss in the control arm with maintenance or small bone accrual in the treatment arm. In contrast, the treatment trials showed a greater degree of accrual in the treatment arm with less dramatic bone loss in the control arm. This supports the belief that bone loss is more prominent in the early stages of corticosteroid therapy, with a slower rate of loss as therapy continues. As such, prophylactic therapy demonstrates an ability to reduce bone loss, whereas bisphosphonate treatment provides an opportunity to build bone mass in chronic steroid‐using people.
We included post‐hoc subgroup analyses based on gender and menopausal status (men, premenopausal women, postmenopausal women) however we are cautious in interpreting these results because subgroup comparisons are observational in nature (Deeks 2011). We found that there remains a similar magnitude of effect in the subgroups as compared to the whole group analyses except for a wider spread of variability, perhaps due to fewer trials in each analysis. Results for the female groups at the femoral neck were not statistically significant. There was no significant heterogeneity in the male analyses but significant heterogeneity in the female plots. Frediani 2003 was a visible outlier in the female plots and differed from the other trials by its use of parenteral bisphosphonates, which may explain such a difference. Our a priori sensitivity analyses that separated oral and enteral bisphosphonates revealed that heterogeneity was likely in part due to this factor. Removal of Frediani 2003 reduced the I2 statistic in all female analyses (I2= 0% for premenopausal lumbar spine BMD analysis; I2= 43% for postmenopausal lumbar spine BMD analysis; I2= 0% for premenopausal and postmenopausal femoral neck BMD analyses; results not shown). These post‐hoc analyses included mixed data from prevention and treatment trials. Sub‐subgroup analyses, broken down by gender and prevention or treatment, could not be performed as data were not presented in the trials at that level of detail.
Given the poor absorption of oral bisphosphonates (Gertz 1995; Russell 2007) there is perceived differential efficacy based on route of administration. Our analysis showed that the effect size of BMD at lumbar spine differed between parenteral bisphosphonate trials and oral bisphosphonate trials (5.12% and 3.25%, respectively). This difference in effect size between the parenteral analysis and oral analysis was also seen at the femoral neck (4.56% and 1.92%, respectively). In the lumbar spine BMD analysis all parenteral bisphosphonates were prevention studies which likely contributed to the significant heterogeneity in the lumbar spine BMD prevention subgroup analysis. A sub‐subgroup analysis of parenteral and oral bisphosphonates subsequently eliminated the heterogeneity in the lumbar spine BMD prevention subgroup.
There are few head‐to‐head trials of oral versus parenteral bisphosphonates in GIOP. A 12‐month RCT including 265 men, divided into prevention and treatment subgroups, compared a single 5 mg infusion of zoledronic acid to 5 mg daily oral risedronate. The authors found a statistically significant increase in lumbar spine BMD of 2.7% (95% CI 0.99% to 4.43%) with zoledronic acid over risedronate in their prevention subgroup. The treatment difference at the femoral neck was not statistically significant in the prevention subgroup at 1.38% (95% CI ‐0.18% to 2.95%) (Sambrook 2012). Another RCT (n = 771) found statistically significant improvements in BMD at 12 months with zoledronic acid over risedronate at both the lumbar spine and femoral neck in the prevention subgroups; 1.96% (95% CI 1.04 to 2.88) and 1.33% (95% CI 0.41% to 2.25%) (Reid 2009). Overall, parenteral regimes were vastly preferred over oral regimes in these trials. Route of administration is a factor to be considered in the treatment of GIOP.
We analysed head‐to‐head comparisons of the low‐ and standard‐dose bisphosphonate treatment groups in five studies (Boutsen 2001; Cohen 1999; Lems 2006; Reid 2000; Saag 1998). The standard‐dose bisphosphonate groups showed a small increase in benefit at the lumbar spine (0.95%, 95% CI 0.37% to 1.53%). The data suggest that even low‐dose bisphosphonates can be beneficial in the treatment of GIOP.
It was interesting to see that an ad‐hoc pooled analysis of low‐dose bisphosphonates (Boutsen 2001; Cohen 1999; Lems 2006; Reid 2000; Saag 1998) compared to treatment with calcium or vitamin D alone resulted in a mean difference of 3.15% (95% CI 1.87% to 4.44%) at the lumbar spine. This effect size is not out of the range of our pooled estimate for all studies using standard‐dose bisphosphonates supporting the suggestion that low‐dose bisphosphonates may be beneficial (results not shown).
There is a perception that newer bisphosphonates are more effective than etidronate in treating osteoporosis. In both the vertebral fracture analyses and both the BMD analyses of oral bisphosphonates there was no heterogeneity among the studies, which included three different types of bisphosphonates. We did not perform a post‐hoc analysis on newer bisphosphonates.
One critique of bisphosphonate studies is the lack of long‐term follow‐up. For this updated review we decided to include the analysis of BMD at the lumbar spine and femoral neck after 18 to 24 months. Results from these analyses show increases in bone density at the lumbar spine and femoral neck with mean differences of 5.49% and 3.28%, respectively. This suggests ongoing efficacy up to two years.
Overall completeness and applicability of evidence
This updated review examined the evidence from 27 RCTs for the use of bisphosphonates in the prevention and treatment of GIOP. We included 25 new studies for this update, and, due to more rigorous inclusion criteria, only two of the 13 studies from the existing review, as there were numerous higher quality studies published since the original review. A variety of outcomes measured both the benefits and the harms of bisphosphonates. Benefits included decreased bone loss or bone accrual at both the lumbar spine and femoral neck and a reduced risk of vertebral fractures. Although fracture outcome data may have more direct clinical relevance than BMD outcome measurements, most GIOP studies reported BMD as the primary outcome. Vertebral fracture data were sufficient to address the objectives of our review, however data on nonvertebral fractures often lacked detail and we were unable to examine the incidence of hip and wrist fractures separately. None of the trials reported on quality of life so we were unable to include this as an outcome measure in our review.
This updated review provides confirmatory evidence that bisphosphonates, alone or in combination with calcium or vitamin D, or both, are more beneficial than calcium or vitamin D, or both, alone or with placebo, for both the prevention and treatment of GIOP at the hip and spine. The trials used in this review used similar inclusion criteria, however the participant groups differed between trials in terms of the prior steroid usage, baseline BMD measurements and prevalent fractures. This updated review provides new data on the benefits of bisphosphonates in reducing the risk of vertebral fractures and the prevention versus treatment of GIOP. We provide new data on the different effect sizes seen in oral and parenteral bisphosphonate clinical trials, and the potential benefit of low‐dose bisphosphonates.
Regarding bisphosphonate harms, we could not find any statistically significant differences in the occurrence of serious adverse events or withdrawals due to adverse events between the bisphosphonate and control groups. In nine of the trials analysed, the protocols for the collection of harm data were unclear and may have resulted in biased results. Some of the included studies based their power calculations solely on benefit outcomes and may not have been sufficiently powered to adequately assess harm outcomes. Although findings on serious adverse events and withdrawals due to adverse events are important to consider in evaluating bisphosphonate therapy, we are cautious in interpreting these data as markers for harm and tolerability due to the potential for bias (Higgins 2011a).
Quality of the evidence
The summary of findings Table for the main comparison shows the overall certainty and importance of the body of evidence using the GRADE Working Group Approach (Schünemann 2013). We rated the certainty of the evidence for vertebral fractures as high, which indicates that further research is very unlikely to change our confidence in the estimate of effect. We downgraded the nonvertebral fracture outcome to low‐certainty evidence for imprecision due to a total sample size below the calculated optimal information size, and risk of bias for being a patient‐reported subjective outcome. We rated the certainty of remaining outcomes as moderate, which indicates that further research is likely to have an important impact on our confidence in the estimate of effect and may change the estimate. BMD outcomes were downgraded for indirectness as surrogate markers for osteoporosis. Serious adverse events and withdrawals due to adverse events were downgraded for imprecision due to small total sample size and 95% CI including the possibility of no effect and appreciable harm. We assessed all outcomes as important in terms of their impact on decisions regarding optimal management.
Potential biases in the review process
Our methods and reporting are based on the Cochrane Handbook for Systematic Reviews of Interventions recommendations (Higgins 2011). We devised a thorough search strategy with no language restrictions and believe that we identified all relevant studies. Two review authors in various combinations independently assessed the trials for inclusion in the review, assessed risk of bias and extracted data for analysis. The biggest limitations of the review process were the heterogeneity between the trials, likely related to different patient characteristics (differences in underlying inflammatory conditions, steroid doses, and prevalent fractures) and that some trials reported outcomes but did not provide data in a form that could be extracted for meta‐analysis.
Agreements and disagreements with other studies or reviews
Our findings are similar to those reported in the 1999 Cochrane Review evaluating the efficacy of bisphosphonates in steroid‐induced osteoporosis (Homik 1999). As there were very few high‐quality papers included in the original review, this updated review includes data from only two of the 13 studies that were included in the original version. Therefore, the effect estimates have changed. While the original review was not able to establish bisphosphonate benefit beyond one year or against spinal fractures, the meta‐analyses in this updated review have provided conclusive data on the above measures of benefit.
A subsequent systematic review by the Health Technology Assessment programme of the NHS by Kanis 2007 assessed the clinical effectiveness of numerous active and inactive treatments for GIOP. Outcome measures included incident vertebral fractures, incident nonvertebral fractures, associated effects, compliance and continuance. Kanis 2007 included 23 bisphosphonate studies, of which only eight overlap with the 27 studies in our updated review. Many of the studies in Kanis 2007 were not eligible for inclusion in our review for using active comparators or including participants with transplant‐associated steroid use. Kanis 2007 analysed different bisphosphonate types individually and found that, in the non‐transplant population, only risedronate 5 mg/day showed a statistically significant reduction in vertebral fractures as compared to placebo or no treatment. No intervention was shown to be beneficial in preventing nonvertebral fractures. In our analysis of vertebral fractures nine of the 10 studies used alendronate and showed a statistically significant reduction in vertebral fractures.
There are some other differences between our updated review and that of Kanis 2007. Our review includes 14 bisphosphonate trials that were not included in Kanis 2007 because fracture was not the primary outcome. Our fracture analyses include only studies with standardised radiographic screening of vertebral fractures in order to ensure complete capture of fracture incidence, whereas many of the studies in Kanis 2007 report only symptomatic fractures. It is known that up to 65% of vertebral fractures may be asymptomatic (Cooper 1992; Kanis 2007). Combining all types of bisphosphonate in our pooled analyses allows for a stronger effect size estimate. As their report shows, most studies only achieved statistically significant findings in pooled analyses.
Current American College of Rheumatology clinical practice guidelines for post‐menopausal women and men 50 years old or more recommend bisphosphonate therapy for GIOP based on FRAX risk assessment (Grossman 2010). Bisphosphonate therapy is recommended in low‐risk patients (FRAX < 10% for 10‐year major osteoporotic fracture) on corticosteroid treatment for greater or equal to 7.5 mg/day for three or more months' duration; moderate‐risk patients (FRAX 10% to 20%) on doses less than 7.5 mg/day for three or more months' duration; and high‐risk patients (FRAX > 20%) on any dose and duration of corticosteroid (Grossman 2010). In comparison, the International Osteoporosis Foundation and European Calcified Tissue Society framework for GIOP management of post‐menopausal women and men 50 years old or more recommend treatment to be considered in patients on corticosteroid treatment greater or equal to 7.5 mg/day for three or more months' duration with a previous fracture or that are greater than 70 years of age (Lekamwasam 2012). For those with no previous fracture, younger than 70 years, or on corticosteroid doses less than 7.5 mg/day, FRAX assessment with or without BMD assessment is recommended to further guide decision‐making (Lekamwasam 2012). Our study supports the use of bisphosphonates in people who are either starting corticosteroids or on established corticosteroid therapy.

Study flow diagram.

Risk of bias graph: review authors' judgements about each risk of bias item presented as percentages across all included studies.

Risk of bias summary: review authors' judgements about each risk of bias item for each included study.

Comparison 1 Bisphosphonates vs control: benefits ‐ fractures, Outcome 1 Incident radiographic vertebral fractures 12‐24 months.

Comparison 1 Bisphosphonates vs control: benefits ‐ fractures, Outcome 2 Incident radiographic nonvertebral fractures 12‐24 months.

Comparison 2 Bisphosphonates vs control: benefits ‐ bone mineral density (BMD) at lumbar spine (LS), Outcome 1 LS BMD change 12 months: all trials.

Comparison 2 Bisphosphonates vs control: benefits ‐ bone mineral density (BMD) at lumbar spine (LS), Outcome 2 LS BMD change 12 months: oral treatment.
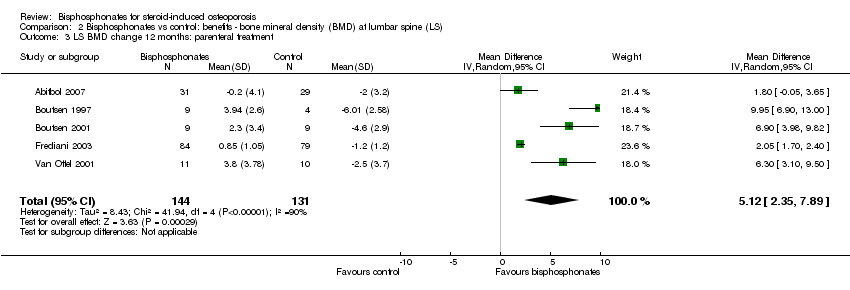
Comparison 2 Bisphosphonates vs control: benefits ‐ bone mineral density (BMD) at lumbar spine (LS), Outcome 3 LS BMD change 12 months: parenteral treatment.

Comparison 2 Bisphosphonates vs control: benefits ‐ bone mineral density (BMD) at lumbar spine (LS), Outcome 4 LS BMD change 12 months: low‐ vs standard‐dose.
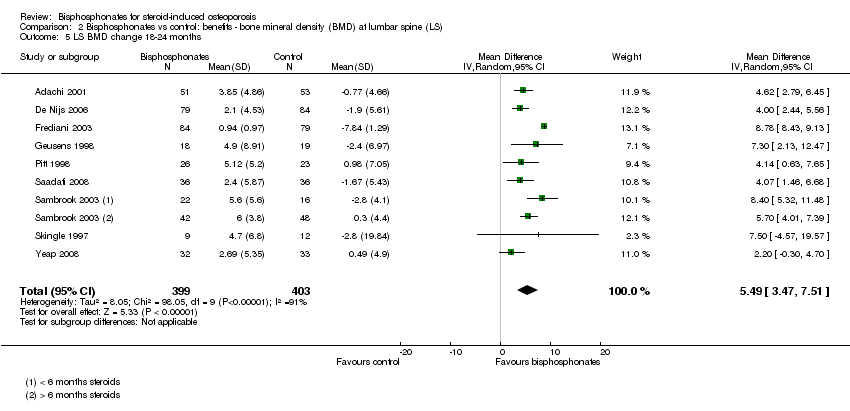
Comparison 2 Bisphosphonates vs control: benefits ‐ bone mineral density (BMD) at lumbar spine (LS), Outcome 5 LS BMD change 18‐24 months.
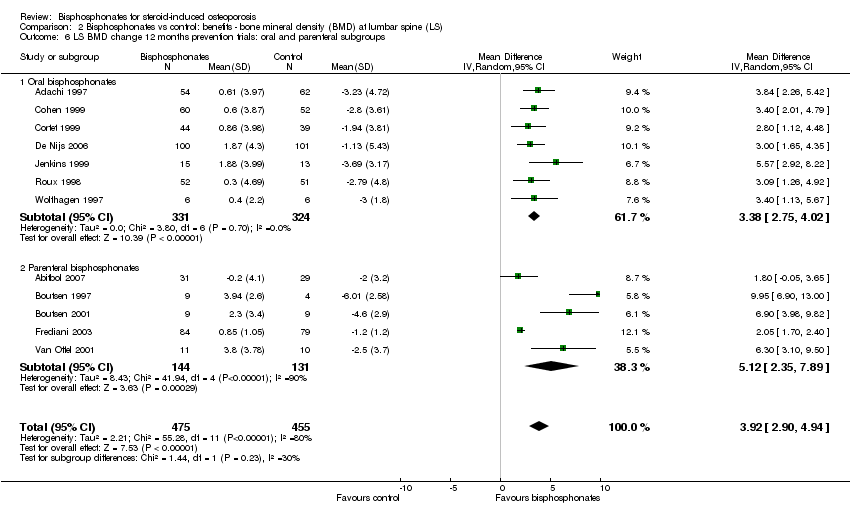
Comparison 2 Bisphosphonates vs control: benefits ‐ bone mineral density (BMD) at lumbar spine (LS), Outcome 6 LS BMD change 12 months prevention trials: oral and parenteral subgroups.

Comparison 2 Bisphosphonates vs control: benefits ‐ bone mineral density (BMD) at lumbar spine (LS), Outcome 7 LS BMD change 12 months: gender/menopausal status subgroups.
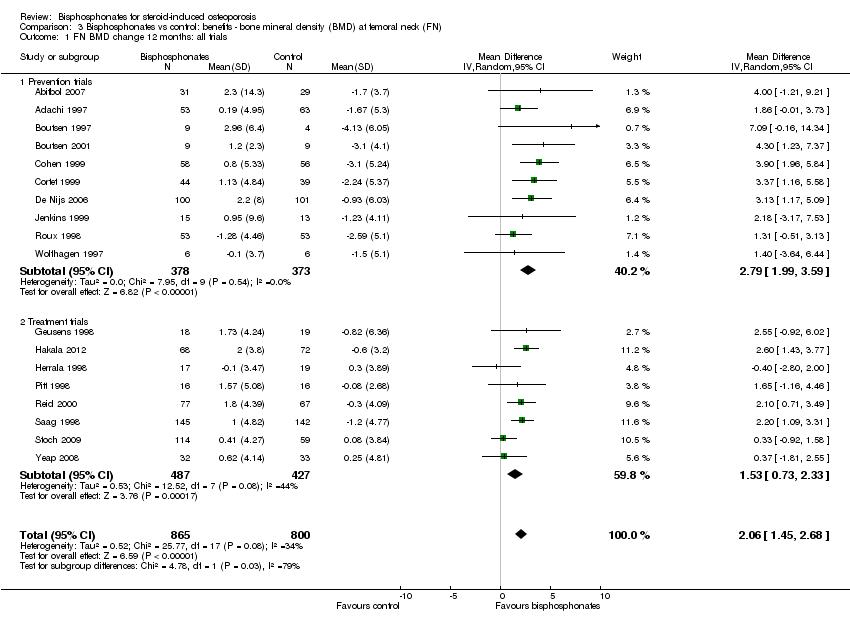
Comparison 3 Bisphosphonates vs control: benefits ‐ bone mineral density (BMD) at femoral neck (FN), Outcome 1 FN BMD change 12 months: all trials.
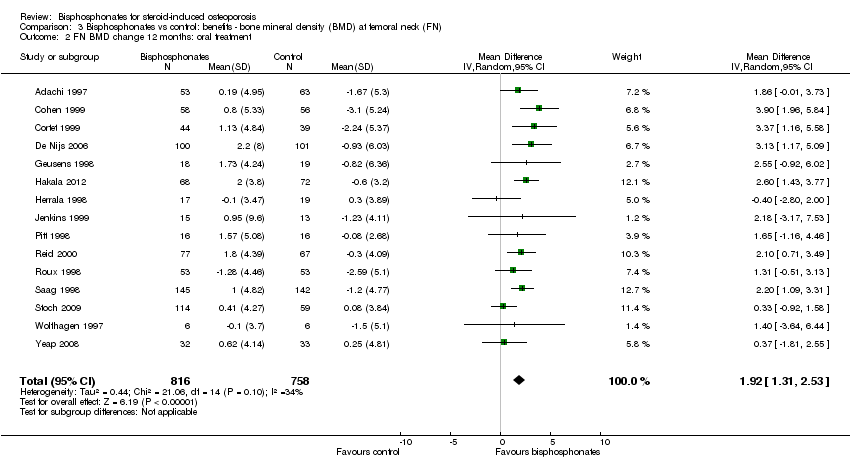
Comparison 3 Bisphosphonates vs control: benefits ‐ bone mineral density (BMD) at femoral neck (FN), Outcome 2 FN BMD change 12 months: oral treatment.

Comparison 3 Bisphosphonates vs control: benefits ‐ bone mineral density (BMD) at femoral neck (FN), Outcome 3 FN BMD change 12 months: parenteral treatment.
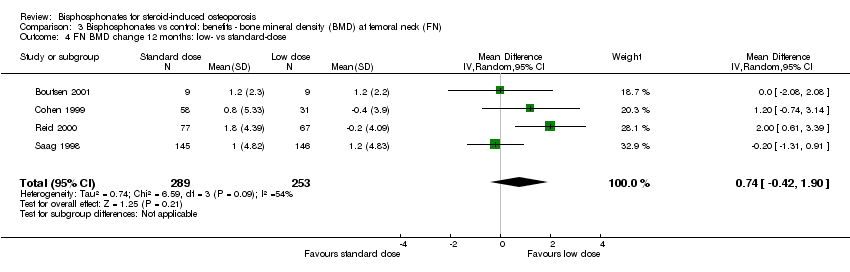
Comparison 3 Bisphosphonates vs control: benefits ‐ bone mineral density (BMD) at femoral neck (FN), Outcome 4 FN BMD change 12 months: low‐ vs standard‐dose.

Comparison 3 Bisphosphonates vs control: benefits ‐ bone mineral density (BMD) at femoral neck (FN), Outcome 5 FN BMD change 18‐24 months.

Comparison 3 Bisphosphonates vs control: benefits ‐ bone mineral density (BMD) at femoral neck (FN), Outcome 6 FN BMD change 12 months: gender/menopausal status subgroups.

Comparison 4 Bisphosphonates vs control: harms, Outcome 1 Serious adverse events 12‐24 months.
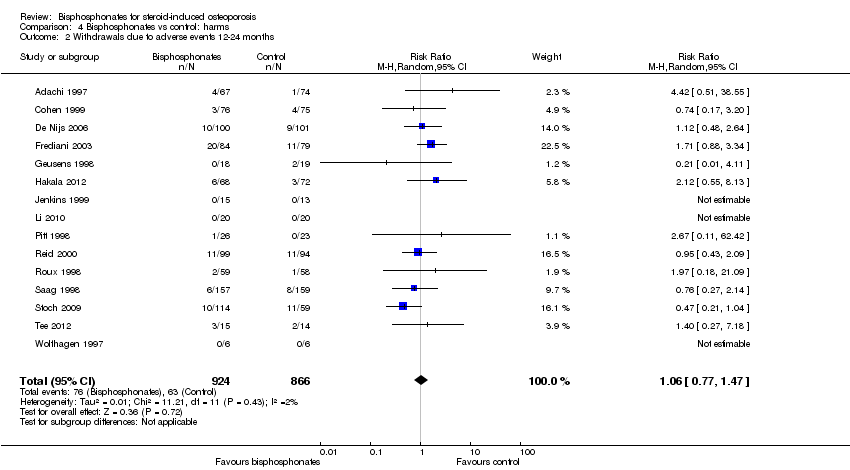
Comparison 4 Bisphosphonates vs control: harms, Outcome 2 Withdrawals due to adverse events 12‐24 months.
| Bisphosphonates (alone or with calcium and/or vitamin D) compared with control (calcium and/or vitamin D and/or placebo) for adults with GIOP | ||||||
| Patient or population: adults with GIOP Settings: ambulatory Intervention: bisphosphonates (alone or with calcium and/or vitamin D) Comparison: control (calcium and/or vitamin D and/or placebo) | ||||||
| Outcomes | Illustrative comparative risks* (95% CI) | Relative effect | No of Participants | Quality of the evidence | Comments | |
| Assumed risk | Corresponding risk | |||||
| Control (calcium and/or vitamin D and/or placebo) | Bisphosphonates (alone or with calcium and/or vitamin D) | |||||
| Incident vertebral fractures Radiographic follow‐up: 12‐24 months | 77 per 1000 | 44 per 1000 | RR 0.57 (0.35 to 0.91) RD ‐0.02 (‐0.05 to 0.01) | 1343 | ⊕⊕⊕⊕ | Absolute increased benefit 2% fewer people with fractures using bisphosphonates (95% CI 5.00% fewer to 1.00% more) Relative per cent change 43% improvement with bisphosphonates (95% CI 9.00% to 65.00% better) NNTB = 31 (95% CI 20 to 145) |
| Incident nonvertebral fractures Radiographic follow‐up: 12‐24 months | 55 per 1000 | 42 per 1000 | RR 0.79 (0.47 to 1.33) RD ‐0.01 (‐0.04 to 0.01) | 1245 | ⊕⊕⊝⊝ due to risk of bias and imprecision | Absolute increased benefit 1% fewer people with fractures using bisphosphonates (95% CI 4.00% fewer to 1.00% more) Relative per cent change 21% improvement with bisphosphonates (95% CI 33.00% worse to 53.00% better) NNTB = n/a4 |
| Lumbar spine BMD DEXA follow‐up: 12 months | Mean per cent change in BMD across control groups was ‐3.19% (‐8.08% to 1.70%) from baseline5 | Mean per cent change in BMD from baseline in bisphosphonate groups was 3.50% higher than control groups (2.90% to 4.10% higher) | ‐ | 2042 | ⊕⊕⊕⊝ due to indirectness | Absolute increased benefit 3.50% with bisphosphonates (95% CI 2.90 to 4.10) Relative per cent change 1.10% (95% CI 0.91 to 1.29) with bisphosphonates NNTB = 3 (95% CI 2 to 3) |
| Femoral neck BMD DEXA follow‐up: 12 months | Mean per cent change in BMD across control groups was ‐1.59% (‐10.49% to 7.31%) from baseline 5 | Mean per cent change in BMD from baseline in bisphosphonate groups was 2.06% higher than control groups (1.45% to 2.68% higher) | ‐ | 1665 | ⊕⊕⊕⊝ due to indirectness | Absolute increased benefit 2.06% with bisphosphonates (95% CI 1.45 to 2.68) Relative per cent change 1.29% with bisphosphonates (95% CI 0.91 to 1.69) NNTB = 5 (95% CI 4 to 7) |
| Serious adverse events follow‐up: 12‐24 months | 162 per 1000 | 147 per 1000 | RR 0.91 (0.74 to 1.12) RD 0.00 (‐0.02, 0.02) | 1703 | ⊕⊕⊕⊝ due to risk of bias and imprecision | Absolute increased harm 0% more adverse events with bisphosphonates (95% CI 2.00% fewer to 2.00% more) Relative per cent change 9% improvement with bisphosphonates (95% CI 12.00% worse to 26.00% better) NNTH = n/a4 |
| Withdrawals due to adverse events follow‐up: 12‐24 months | 73 per 1000 | 77 per 1000 | RR 1.06 (0.77 to 1.47) RD 0.01 (‐0.01 to 0.03) | 1790 | ⊕⊕⊕⊝ due to risk of bias and imprecision | Absolute increased harm 1% more withdrawals with bisphosphonates (95% CI 1.00% fewer to 3.00% more) Relative per cent change 6% worsening with bisphosphonates (95% CI 47.00% worse to 23.00% better) NNTH = n/a4 |
| Quality of life | 0 per 1000 | 0 per 1000 | Not estimable | (0 studies) | This outcome was not assessed by any of the trials | |
| *The basis for the assumed risk (e.g. the median control group risk across studies) is provided in footnotes. The corresponding risk (and its 95% confidence interval) is based on the assumed risk in the comparison group and the relative effect of the intervention (and its 95% CI). | ||||||
| GRADE Working Group grades of evidence | ||||||
| 1Vertebral fractures meet calculated OIS threshold of 1174 (calculation not shown ‐ Brant 2014) 2Downgraded for risk of bias: nonvertebral fractures were a patient‐reported, subjective outcome 3Downgraded for imprecision: total sample size is below calculated optimal information size (OIS) (calculations not shown ‐ Brant 2014) and the 95% confidence interval around the pooled estimate of effect includes both the possibility of no effect and appreciable benefit or harm 4Number needed to treat for an additional beneficial outcome (NNTB) or number needed to treat for an additional harmful outcome (NNTH) is not applicable when result is not statistically significant 5We calculated mean baseline risk for the control group in RevMan using generic inverse variance (calculations not shown) 6Most heterogeneity explained through sensitivity analyses 7Downgraded for indirectness: bone density is a surrogate marker for fracture risk 8Clinically relevant change in BMD: the natural history of participants starting steroid therapy based on control arms in our prevention trials is to see a 1%‐6% decrease in lumbar spine BMD and 1%‐4% decrease in femoral neck BMD in the first year of treatment. We have used an SMD of 0.5 as an estimate of the minimal clinically important difference for BMD change to calculate the NNTB (Schünemann 2011b) 9Downgraded for risk of bias: the protocols for the collection of harm data in a large number of trials were unclear | ||||||
| Outcome or subgroup title | No. of studies | No. of participants | Statistical method | Effect size |
| 1 Incident radiographic vertebral fractures 12‐24 months Show forest plot | 12 | 1343 | Risk Ratio (M‐H, Random, 95% CI) | 0.57 [0.35, 0.91] |
| 2 Incident radiographic nonvertebral fractures 12‐24 months Show forest plot | 9 | 1245 | Risk Ratio (M‐H, Random, 95% CI) | 0.79 [0.47, 1.33] |
| Outcome or subgroup title | No. of studies | No. of participants | Statistical method | Effect size |
| 1 LS BMD change 12 months: all trials Show forest plot | 23 | 2042 | Mean Difference (IV, Random, 95% CI) | 3.50 [2.90, 4.10] |
| 1.1 Prevention trials | 12 | 930 | Mean Difference (IV, Random, 95% CI) | 3.92 [2.90, 4.94] |
| 1.2 Treatment trials | 11 | 1112 | Mean Difference (IV, Random, 95% CI) | 3.19 [2.64, 3.73] |
| 2 LS BMD change 12 months: oral treatment Show forest plot | 18 | 1767 | Mean Difference (IV, Random, 95% CI) | 3.25 [2.88, 3.63] |
| 3 LS BMD change 12 months: parenteral treatment Show forest plot | 5 | 275 | Mean Difference (IV, Random, 95% CI) | 5.12 [2.35, 7.89] |
| 4 LS BMD change 12 months: low‐ vs standard‐dose Show forest plot | 5 | 642 | Mean Difference (IV, Random, 95% CI) | 0.95 [0.37, 1.53] |
| 5 LS BMD change 18‐24 months Show forest plot | 9 | 802 | Mean Difference (IV, Random, 95% CI) | 5.49 [3.47, 7.51] |
| 6 LS BMD change 12 months prevention trials: oral and parenteral subgroups Show forest plot | 12 | 930 | Mean Difference (IV, Random, 95% CI) | 3.92 [2.90, 4.94] |
| 6.1 Oral bisphosphonates | 7 | 655 | Mean Difference (IV, Random, 95% CI) | 3.38 [2.75, 4.02] |
| 6.2 Parenteral bisphosphonates | 5 | 275 | Mean Difference (IV, Random, 95% CI) | 5.12 [2.35, 7.89] |
| 7 LS BMD change 12 months: gender/menopausal status subgroups Show forest plot | 5 | 840 | Mean Difference (IV, Random, 95% CI) | 3.86 [2.03, 5.68] |
| 7.1 Men | 4 | 221 | Mean Difference (IV, Random, 95% CI) | 3.58 [2.68, 4.48] |
| 7.2 Premenopausal women | 5 | 154 | Mean Difference (IV, Random, 95% CI) | 3.51 [1.50, 5.53] |
| 7.3 Postmenopausal women | 5 | 465 | Mean Difference (IV, Random, 95% CI) | 4.41 [0.65, 8.18] |
| Outcome or subgroup title | No. of studies | No. of participants | Statistical method | Effect size |
| 1 FN BMD change 12 months: all trials Show forest plot | 18 | 1665 | Mean Difference (IV, Random, 95% CI) | 2.06 [1.45, 2.68] |
| 1.1 Prevention trials | 10 | 751 | Mean Difference (IV, Random, 95% CI) | 2.79 [1.99, 3.59] |
| 1.2 Treatment trials | 8 | 914 | Mean Difference (IV, Random, 95% CI) | 1.53 [0.73, 2.33] |
| 2 FN BMD change 12 months: oral treatment Show forest plot | 15 | 1574 | Mean Difference (IV, Random, 95% CI) | 1.92 [1.31, 2.53] |
| 3 FN BMD change 12 months: parenteral treatment Show forest plot | 3 | 91 | Mean Difference (IV, Random, 95% CI) | 4.56 [2.07, 7.05] |
| 4 FN BMD change 12 months: low‐ vs standard‐dose Show forest plot | 4 | 542 | Mean Difference (IV, Random, 95% CI) | 0.74 [‐0.42, 1.90] |
| 5 FN BMD change 18‐24 months Show forest plot | 9 | 802 | Mean Difference (IV, Random, 95% CI) | 3.28 [1.70, 4.87] |
| 6 FN BMD change 12 months: gender/menopausal status subgroups Show forest plot | 4 | 537 | Mean Difference (IV, Random, 95% CI) | 3.29 [1.65, 4.94] |
| 6.1 Men | 3 | 134 | Mean Difference (IV, Random, 95% CI) | 2.91 [1.15, 4.68] |
| 6.2 Premenopausal women | 4 | 88 | Mean Difference (IV, Random, 95% CI) | 2.70 [‐0.96, 6.35] |
| 6.3 Postmenopausal women | 4 | 315 | Mean Difference (IV, Random, 95% CI) | 3.62 [‐0.37, 7.61] |
| Outcome or subgroup title | No. of studies | No. of participants | Statistical method | Effect size |
| 1 Serious adverse events 12‐24 months Show forest plot | 15 | 1703 | Risk Ratio (M‐H, Random, 95% CI) | 0.91 [0.74, 1.12] |
| 2 Withdrawals due to adverse events 12‐24 months Show forest plot | 15 | 1790 | Risk Ratio (M‐H, Random, 95% CI) | 1.06 [0.77, 1.47] |