Vacunas para la prevención de la gripe en adultos sanos
Información
- DOI:
- https://doi.org/10.1002/14651858.CD001269.pub5Copiar DOI

- Base de datos:
-
- Cochrane Database of Systematic Reviews
- Versión publicada:
-
- 13 marzo 2014see what's new
- Tipo:
-
- Intervention
- Etapa:
-
- Review
- Grupo Editorial Cochrane:
-
Grupo Cochrane de Infecciones respiratorias agudas
- Copyright:
-
- Copyright © 2015 The Cochrane Collaboration. Published by John Wiley & Sons, Ltd.
Cifras del artículo
Altmetric:
Citado por:
Autores
Contributions of authors
Carlo Di Pietrantonj (CDP) and Alessandro Rivetti (AR) designed the 2013 update.
AR carried out the searches and preliminary screening of references.
AR and CDP applied the inclusion criteria.
AR and CDP extracted data.
CDP checked the data extraction, performed the meta‐analysis and carried out statistical testing.
CDP and AR wrote the final report.
All review authors contributed to the review update.
Sources of support
Internal sources
-
ASL 19 and 20, Piemonte, Italy.
External sources
-
Ministry of Defence, UK.
-
NHS Department of Health Cochrane Incentive Scheme, UK.
Declarations of interest
Dr Tom Jefferson receives royalties from his books published by Blackwells and Il Pensiero Scientifico Editore, Rome. Dr Jefferson is occasionally interviewed by market research companies for anonymous interviews about Phase 1 or 2 pharmaceutical products. In 2011‐2013 Dr Jefferson acted as an expert witness in a litigation case related to oseltamivir phosphate; Tamiflu [Roche] and in a labour case on influenza vaccines in health care workers in Canada. In 1997‐99 Dr Jefferson acted as consultant for Roche, in 2001‐2 for GSK and in 2003 for Sanofi‐Synthelabo for pleconaril (an anti‐rhinoviral which did not get approval from FDA). Dr Jefferson is a consultant for IMS Health. Dr Jefferson is a co‐recipient of a UK National Institute for Health Research grant (HTA ‐ 10/80/01 Update and amalgamation of two Cochrane Reviews: neuraminidase inhibitors for preventing and treating influenza in healthy adults and children ‐ http: // www.hta.ac.uk/2352 ).
Vittorio Demicheli, Lubna A Al‐Ansary, Eliana Ferroni, Alessandro Rivetti, Carlo Di Pietrantonj have no conflicts to declare.
Acknowledgements
The authors gratefully acknowledge the help received from Drs Theresa Wrangham, Ann Fonfa, Brian Hutchison, Alan Hampson, James Irlam, Andy Oxman, Barbara Treacy, Gabriella Morandi, Kathie Clark, Hans van der Wouden, Nelcy Rodriguez, Leonard Leibovici, Mark Jones, Jeanne Lenzer, Janet Wale, Clare Jeffrey, Robert Ware, Roger Damoiseaux and Maryann Napoli. The first publication of this review was funded by the UK Ministry of Defence; the 2004 update was supported by the two Italian Local Health Authorities in which two of the review authors were employed; the 2007 update was funded by the same Local Health Authorities and the UK's Department of Health Cochrane Incentive Scheme. The 2010 update was not funded. Professor Jon Deeks designed and carried out statistical analyses in earlier versions of the review. Finally, the review authors wish to acknowledge Daniela Rivetti and Ghada A Bawazeer as previous authors. The 2013 update was supported by the two Italian Local Health Authorities in which three of the review authors were employed.
Version history
| Published | Title | Stage | Authors | Version |
| 2018 Feb 01 | Vaccines for preventing influenza in healthy adults | Review | Vittorio Demicheli, Tom Jefferson, Eliana Ferroni, Alessandro Rivetti, Carlo Di Pietrantonj | |
| 2014 Mar 13 | Vaccines for preventing influenza in healthy adults | Review | Vittorio Demicheli, Tom Jefferson, Lubna A Al‐Ansary, Eliana Ferroni, Alessandro Rivetti, Carlo Di Pietrantonj | |
| 2010 Jul 07 | Vaccines for preventing influenza in healthy adults | Review | Tom Jefferson, Carlo Di Pietrantonj, Alessandro Rivetti, Ghada A Bawazeer, Lubna A Al‐Ansary, Eliana Ferroni | |
| 2007 Apr 18 | Vaccines for preventing influenza in healthy adults | Review | Vittorio Demicheli, Carlo Di Pietrantonj, Tom Jefferson, Alessandro Rivetti, Daniela Rivetti | |
| 2004 Jul 19 | Vaccines for preventing influenza in healthy adults | Review | Vittorio Demicheli, Daniela Rivetti, Jon Deeks, Tom Jefferson | |
| 2001 Oct 23 | Vaccines for preventing influenza in healthy adults | Review | Vittorio Demicheli, D Rivetti, Jon Deeks, Tom Jefferson | |
Differences between protocol and review
Evidence about the safety and efficacy/effectiveness of influenza vaccine administration during pregnancy is now included.
Keywords
MeSH
Medical Subject Headings (MeSH) Keywords
- Absenteeism;
- Drug Industry;
- Health Status;
- Hospitalization [statistics & numerical data];
- Influenza A virus;
- Influenza B virus;
- Influenza Vaccines [adverse effects, *therapeutic use];
- Influenza, Human [*prevention & control, virology];
- Nausea [chemically induced];
- Pregnancy Complications, Infectious [prevention & control, virology];
- Publication Bias;
- Research Support as Topic;
- Vomiting [chemically induced];
Medical Subject Headings Check Words
Adult; Female; Humans; Male; Pregnancy;
PICO

Study flow diagram

'Risk of bias' graph: review authors' judgements about each risk of bias item presented as percentages across all included studies.

'Risk of bias' summary: review authors' judgements about each risk of bias item for each included study.

Comparison 1 Inactivated parenteral vaccine versus placebo or 'do nothing', Outcome 1 Influenza‐like illness.

Comparison 1 Inactivated parenteral vaccine versus placebo or 'do nothing', Outcome 2 Influenza.

Comparison 1 Inactivated parenteral vaccine versus placebo or 'do nothing', Outcome 3 Physician visits.

Comparison 1 Inactivated parenteral vaccine versus placebo or 'do nothing', Outcome 4 Days ill.

Comparison 1 Inactivated parenteral vaccine versus placebo or 'do nothing', Outcome 5 Times any drugs were prescribed.

Comparison 1 Inactivated parenteral vaccine versus placebo or 'do nothing', Outcome 6 Times antibiotic was prescribed.

Comparison 1 Inactivated parenteral vaccine versus placebo or 'do nothing', Outcome 7 Working days lost.

Comparison 1 Inactivated parenteral vaccine versus placebo or 'do nothing', Outcome 8 Hospitalisations.

Comparison 1 Inactivated parenteral vaccine versus placebo or 'do nothing', Outcome 9 Clinical cases (clinically defined without clear definition).

Comparison 1 Inactivated parenteral vaccine versus placebo or 'do nothing', Outcome 10 Local harms.

Comparison 1 Inactivated parenteral vaccine versus placebo or 'do nothing', Outcome 11 Systemic harms.

Comparison 2 Live aerosol vaccine versus placebo or 'do nothing', Outcome 1 Influenza‐like illness.

Comparison 2 Live aerosol vaccine versus placebo or 'do nothing', Outcome 2 Influenza.

Comparison 2 Live aerosol vaccine versus placebo or 'do nothing', Outcome 3 Influenza cases (clinically defined without clear definition).

Comparison 2 Live aerosol vaccine versus placebo or 'do nothing', Outcome 4 Local harms.

Comparison 2 Live aerosol vaccine versus placebo or 'do nothing', Outcome 5 Systemic harms.

Comparison 3 Inactivated aerosol vaccine versus placebo or 'do nothing', Outcome 1 Influenza.

Comparison 3 Inactivated aerosol vaccine versus placebo or 'do nothing', Outcome 2 Local harms.

Comparison 3 Inactivated aerosol vaccine versus placebo or 'do nothing', Outcome 3 Systemic harms.

Comparison 4 Inactivated parenteral vaccine versus placebo ‐ cohort studies, Outcome 1 Seasonal inactivated vaccine effectiveness in mothers ‐ pregnant women.

Comparison 4 Inactivated parenteral vaccine versus placebo ‐ cohort studies, Outcome 2 Seasonal inactivated vaccine effectiveness in newborns ‐ pregnant women.

Comparison 4 Inactivated parenteral vaccine versus placebo ‐ cohort studies, Outcome 3 Seasonal inactivated vaccine effectiveness in newborns ‐ pregnant women.
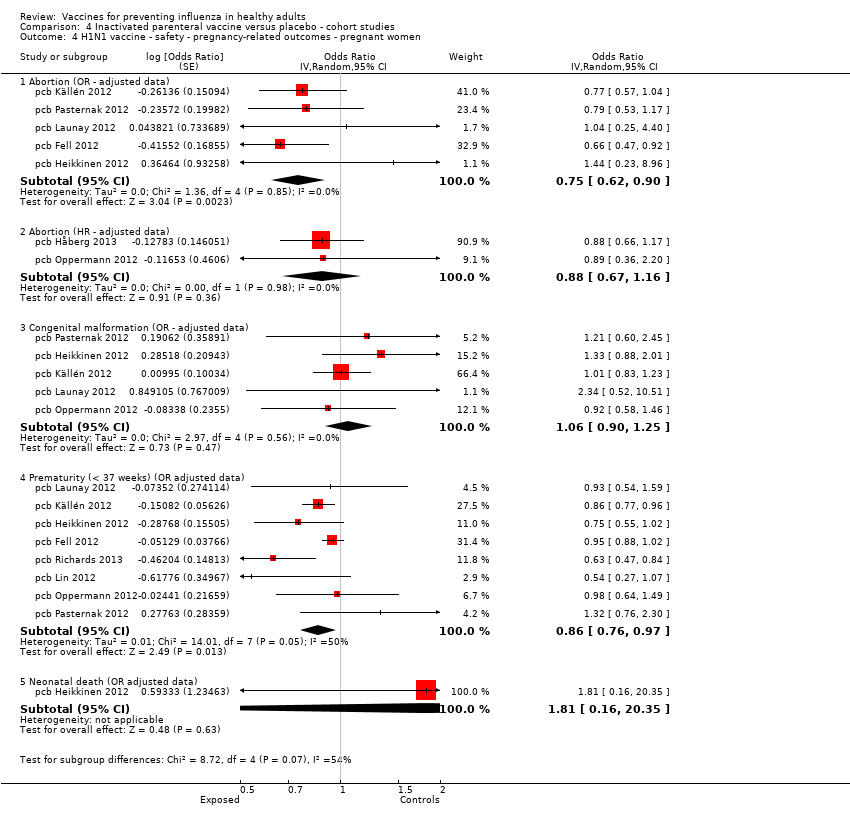
Comparison 4 Inactivated parenteral vaccine versus placebo ‐ cohort studies, Outcome 4 H1N1 vaccine ‐ safety ‐ pregnancy‐related outcomes ‐ pregnant women.

Comparison 4 Inactivated parenteral vaccine versus placebo ‐ cohort studies, Outcome 5 Seasonal vaccine ‐ safety ‐ pregnancy‐related outcomes ‐ pregnant women.

Comparison 5 Inactivated parenteral vaccine versus placebo ‐ case‐control, Outcome 1 Effectiveness in newborns ‐ pregnant women (adjusted data).

Comparison 5 Inactivated parenteral vaccine versus placebo ‐ case‐control, Outcome 2 Seasonal vaccine safety ‐ pregnancy‐related outcomes (adjusted data).

Comparison 6 Serious adverse events ‐ Guillain‐Barré syndrome ‐ cohort studies, Outcome 1 Seasonal influenza vaccination and Guillain‐Barré syndrome.

Comparison 7 Serious adverse events ‐ Guillain‐Barré syndrome ‐ case‐control, Outcome 1 2009 to 2010 A/H1N1 ‐ general population (unadjusted data).

Comparison 7 Serious adverse events ‐ Guillain‐Barré syndrome ‐ case‐control, Outcome 2 2009 to 2010 A/H1N1 ‐ general population (adjusted data).

Comparison 7 Serious adverse events ‐ Guillain‐Barré syndrome ‐ case‐control, Outcome 3 Seasonal influenza vaccination general population (adjusted data).

Comparison 8 Serious adverse events ‐ demyelinating diseases (multiple sclerosis, optic neuritis) ‐ cohort studies, Outcome 1 Influenza vaccination (seasonal) ‐ demyelinating diseases (unadjusted data).

Comparison 8 Serious adverse events ‐ demyelinating diseases (multiple sclerosis, optic neuritis) ‐ cohort studies, Outcome 2 Influenza vaccination (H1N1) ‐ demyelinating diseases (unadjusted).

Comparison 9 Serious adverse events ‐ demyelinating diseases (multiple sclerosis, optic neuritis) ‐ case‐control studies, Outcome 1 Influenza vaccination (seasonal) ‐ general population ‐ demyelinating diseases (unadjusted data).

Comparison 9 Serious adverse events ‐ demyelinating diseases (multiple sclerosis, optic neuritis) ‐ case‐control studies, Outcome 2 Influenza vaccination (seasonal) ‐ general population ‐ multiple sclerosis (adjusted data).

Comparison 9 Serious adverse events ‐ demyelinating diseases (multiple sclerosis, optic neuritis) ‐ case‐control studies, Outcome 3 Influenza vaccination (seasonal) ‐ general population ‐ optic neuritis (adjusted data).

Comparison 10 Serious adverse events ‐ immune thrombocytopaenic purpura ‐ cohort studies, Outcome 1 Seasonal influenza vaccine ‐ HR (adjusted data).

Comparison 10 Serious adverse events ‐ immune thrombocytopaenic purpura ‐ cohort studies, Outcome 2 Seasonal influenza vaccine (unadjusted data).

Comparison 11 Serious adverse events ‐ immune thrombocytopaenic purpura ‐ case‐control studies, Outcome 1 Seasonal influenza vaccine ‐ general population (adjusted data).

Comparison 11 Serious adverse events ‐ immune thrombocytopaenic purpura ‐ case‐control studies, Outcome 2 Seasonal influenza vaccine ‐ general population (unadjusted data).

Comparison 12 1968 to 1969 pandemic: inactivated polyvalent parenteral vaccine versus placebo, Outcome 1 Influenza‐like illness.

Comparison 12 1968 to 1969 pandemic: inactivated polyvalent parenteral vaccine versus placebo, Outcome 2 Influenza.

Comparison 12 1968 to 1969 pandemic: inactivated polyvalent parenteral vaccine versus placebo, Outcome 3 Hospitalisations.

Comparison 12 1968 to 1969 pandemic: inactivated polyvalent parenteral vaccine versus placebo, Outcome 4 Pneumonia.

Comparison 13 1968 to 1969 pandemic: inactivated monovalent parenteral vaccine versus placebo, Outcome 1 Influenza‐like illness.

Comparison 13 1968 to 1969 pandemic: inactivated monovalent parenteral vaccine versus placebo, Outcome 2 Influenza.

Comparison 13 1968 to 1969 pandemic: inactivated monovalent parenteral vaccine versus placebo, Outcome 3 Hospitalisations.

Comparison 13 1968 to 1969 pandemic: inactivated monovalent parenteral vaccine versus placebo, Outcome 4 Pneumonia.

Comparison 13 1968 to 1969 pandemic: inactivated monovalent parenteral vaccine versus placebo, Outcome 5 Working days lost.

Comparison 13 1968 to 1969 pandemic: inactivated monovalent parenteral vaccine versus placebo, Outcome 6 Days ill.

Comparison 14 1968 to 1969 pandemic: inactivated polyvalent aerosol vaccine versus placebo, Outcome 1 Influenza‐like illness.

Comparison 15 1968 to 1969 pandemic: inactivated monovalent aerosol vaccine versus placebo, Outcome 1 Influenza‐like illness.

Comparison 16 1968 to 1969 pandemic: live aerosol vaccine versus placebo, Outcome 1 Influenza cases (clinically defined without clear definition).

Comparison 16 1968 to 1969 pandemic: live aerosol vaccine versus placebo, Outcome 2 Complications (bronchitis, otitis, pneumonia).
| Study design | High risk | Low risk | Unclear risk | Total |
| Case‐control | 3 | 2 | 15 | 20 |
| Cohort | 14 | 0 | 13 | 27 |
| RCT/CCT | 6 | 9 | 54 | 69 |
| Total | 23 | 11 | 82 | 116 |
| Study design | Government, institutional or public | Industry | Mixed | Total |
| Case‐control | 13 | 1 | 1 | 15 |
| Cohort | 22 | 3 | 2 | 27 |
| RCT/CCT | 31 | 12 | 5 | 48 |
| Total | 66 | 16 | 8 | 90 |
| Outcome or subgroup title | No. of studies | No. of participants | Statistical method | Effect size |
| 1 Influenza‐like illness Show forest plot | 16 | 25795 | Risk Ratio (M‐H, Fixed, 95% CI) | 0.83 [0.78, 0.87] |
| 1.1 WHO recommended ‐ matching vaccine | 7 | 4760 | Risk Ratio (M‐H, Fixed, 95% CI) | 0.83 [0.77, 0.89] |
| 1.2 WHO recommended ‐ vaccine matching absent or unknown | 7 | 20942 | Risk Ratio (M‐H, Fixed, 95% CI) | 0.82 [0.75, 0.90] |
| 1.3 Monovalent not WHO recommended ‐ vaccine matching | 1 | 59 | Risk Ratio (M‐H, Fixed, 95% CI) | 1.02 [0.28, 3.70] |
| 1.4 Monovalent not WHO recommended ‐ vaccine matching ‐ high dose | 1 | 34 | Risk Ratio (M‐H, Fixed, 95% CI) | 0.46 [0.09, 2.30] |
| 2 Influenza Show forest plot | 22 | 51724 | Risk Ratio (M‐H, Fixed, 95% CI) | 0.38 [0.33, 0.44] |
| 2.1 WHO recommended ‐ matching vaccine | 12 | 26947 | Risk Ratio (M‐H, Fixed, 95% CI) | 0.37 [0.31, 0.45] |
| 2.2 WHO recommended ‐ vaccine matching absent or unknown | 7 | 15068 | Risk Ratio (M‐H, Fixed, 95% CI) | 0.44 [0.35, 0.56] |
| 2.3 Monovalent not WHO recommended ‐ vaccine matching | 2 | 9675 | Risk Ratio (M‐H, Fixed, 95% CI) | 0.23 [0.10, 0.54] |
| 2.4 Monovalent not WHO recommended ‐ vaccine matching ‐ high dose | 1 | 34 | Risk Ratio (M‐H, Fixed, 95% CI) | 0.11 [0.00, 2.49] |
| 3 Physician visits Show forest plot | 2 | 2308 | Risk Ratio (M‐H, Random, 95% CI) | 0.87 [0.40, 1.89] |
| 3.1 WHO recommended ‐ matching vaccine | 1 | 1178 | Risk Ratio (M‐H, Random, 95% CI) | 0.58 [0.37, 0.91] |
| 3.2 WHO recommended ‐ vaccine matching absent or unknown | 1 | 1130 | Risk Ratio (M‐H, Random, 95% CI) | 1.28 [0.90, 1.83] |
| 4 Days ill Show forest plot | 3 | 3133 | Mean Difference (IV, Random, 95% CI) | ‐0.21 [‐0.98, 0.56] |
| 4.1 WHO recommended ‐ matching vaccine | 2 | 2003 | Mean Difference (IV, Random, 95% CI) | ‐0.58 [‐0.85, ‐0.32] |
| 4.2 WHO recommended ‐ matching absent or unknown | 1 | 1130 | Mean Difference (IV, Random, 95% CI) | 0.66 [0.16, 1.16] |
| 5 Times any drugs were prescribed Show forest plot | 2 | 2308 | Mean Difference (IV, Random, 95% CI) | ‐0.01 [‐0.03, 0.01] |
| 5.1 WHO recommended ‐ matching vaccine | 1 | 1178 | Mean Difference (IV, Random, 95% CI) | ‐0.02 [‐0.04, ‐0.00] |
| 5.2 WHO recommended ‐ matching absent or unknown | 1 | 1130 | Mean Difference (IV, Random, 95% CI) | 0.0 [‐0.00, 0.00] |
| 6 Times antibiotic was prescribed Show forest plot | 2 | 2308 | Mean Difference (IV, Random, 95% CI) | ‐0.02 [‐0.03, ‐0.01] |
| 6.1 WHO recommended ‐ matching vaccine | 1 | 1178 | Mean Difference (IV, Random, 95% CI) | ‐0.02 [‐0.03, ‐0.01] |
| 6.2 WHO recommended ‐ matching absent or unknown | 1 | 1130 | Mean Difference (IV, Random, 95% CI) | ‐0.01 [‐0.03, 0.01] |
| 7 Working days lost Show forest plot | 4 | 3726 | Mean Difference (IV, Random, 95% CI) | ‐0.04 [‐0.14, 0.06] |
| 7.1 WHO recommended ‐ matching vaccine | 3 | 2596 | Mean Difference (IV, Random, 95% CI) | ‐0.09 [‐0.19, 0.02] |
| 7.2 WHO recommended ‐ matching absent or unknown | 1 | 1130 | Mean Difference (IV, Random, 95% CI) | 0.09 [0.00, 0.18] |
| 8 Hospitalisations Show forest plot | 3 | 11924 | Risk Ratio (M‐H, Random, 95% CI) | 0.96 [0.85, 1.08] |
| 8.1 WHO recommended ‐ matching vaccine | 1 | 1178 | Risk Ratio (M‐H, Random, 95% CI) | 0.0 [0.0, 0.0] |
| 8.2 WHO recommended ‐ vaccine matching absent or unknown | 1 | 1130 | Risk Ratio (M‐H, Random, 95% CI) | 2.89 [0.12, 70.68] |
| 8.3 Monovalent not WHO recommended ‐ vaccine matching | 1 | 9616 | Risk Ratio (M‐H, Random, 95% CI) | 0.96 [0.85, 1.08] |
| 9 Clinical cases (clinically defined without clear definition) Show forest plot | 3 | 4259 | Risk Ratio (M‐H, Random, 95% CI) | 0.87 [0.72, 1.05] |
| 9.1 WHO recommended ‐ matching vaccine | 2 | 2056 | Risk Ratio (M‐H, Random, 95% CI) | 0.89 [0.64, 1.25] |
| 9.2 WHO recommended ‐ vaccine matching absent or unknown | 1 | 2203 | Risk Ratio (M‐H, Random, 95% CI) | 0.83 [0.69, 0.99] |
| 10 Local harms Show forest plot | 20 | Risk Ratio (M‐H, Random, 95% CI) | Subtotals only | |
| 10.1 Local ‐ tenderness/soreness | 20 | 35655 | Risk Ratio (M‐H, Random, 95% CI) | 3.13 [2.44, 4.02] |
| 10.2 Local ‐ erythema | 9 | 29499 | Risk Ratio (M‐H, Random, 95% CI) | 2.59 [1.77, 3.78] |
| 10.3 Local ‐ induration | 3 | 7786 | Risk Ratio (M‐H, Random, 95% CI) | 4.28 [1.25, 14.67] |
| 10.4 Local ‐ arm stiffness | 1 | 50 | Risk Ratio (M‐H, Random, 95% CI) | 1.62 [0.54, 4.83] |
| 10.5 Local ‐ combined endpoint (any or highest symptom) | 11 | 12307 | Risk Ratio (M‐H, Random, 95% CI) | 2.44 [1.82, 3.28] |
| 11 Systemic harms Show forest plot | 16 | Risk Ratio (M‐H, Random, 95% CI) | Subtotals only | |
| 11.1 Systemic ‐ myalgia | 10 | 30360 | Risk Ratio (M‐H, Random, 95% CI) | 1.77 [1.40, 2.24] |
| 11.2 Systemic ‐ fever | 12 | 19202 | Risk Ratio (M‐H, Random, 95% CI) | 1.54 [1.22, 1.95] |
| 11.3 Systemic ‐ headache | 13 | 31351 | Risk Ratio (M‐H, Random, 95% CI) | 1.17 [1.01, 1.36] |
| 11.4 Systemic ‐ fatigue or indisposition | 11 | 31140 | Risk Ratio (M‐H, Random, 95% CI) | 1.23 [1.07, 1.42] |
| 11.5 Systemic ‐ nausea/vomiting | 3 | 1667 | Risk Ratio (M‐H, Random, 95% CI) | 2.68 [0.55, 13.08] |
| 11.6 Systemic ‐ malaise | 3 | 26111 | Risk Ratio (M‐H, Random, 95% CI) | 1.51 [1.18, 1.92] |
| 11.7 Systemic ‐ combined endpoint (any or highest symptom) | 6 | 2128 | Risk Ratio (M‐H, Random, 95% CI) | 1.16 [0.87, 1.53] |
| Outcome or subgroup title | No. of studies | No. of participants | Statistical method | Effect size |
| 1 Influenza‐like illness Show forest plot | 6 | 12688 | Risk Ratio (M‐H, Random, 95% CI) | 0.90 [0.84, 0.96] |
| 1.1 WHO recommended ‐ matching vaccine | 2 | 4254 | Risk Ratio (M‐H, Random, 95% CI) | 0.92 [0.76, 1.12] |
| 1.2 WHO recommended ‐ vaccine matching absent or unknown | 3 | 8150 | Risk Ratio (M‐H, Random, 95% CI) | 0.89 [0.82, 0.97] |
| 1.3 Non WHO recommended ‐ vaccine matching absent or unknown | 1 | 284 | Risk Ratio (M‐H, Random, 95% CI) | 0.92 [0.73, 1.16] |
| 2 Influenza Show forest plot | 9 | 11579 | Risk Ratio (M‐H, Random, 95% CI) | 0.47 [0.35, 0.62] |
| 2.1 WHO recommended ‐ matching vaccine | 4 | 6584 | Risk Ratio (M‐H, Random, 95% CI) | 0.55 [0.37, 0.82] |
| 2.2 WHO recommended ‐ vaccine matching absent or unknown | 3 | 4568 | Risk Ratio (M‐H, Random, 95% CI) | 0.43 [0.27, 0.68] |
| 2.3 Non WHO recommended ‐ vaccine matching absent or unknown | 2 | 427 | Risk Ratio (M‐H, Random, 95% CI) | 0.21 [0.08, 0.56] |
| 3 Influenza cases (clinically defined without clear definition) Show forest plot | 3 | 23900 | Risk Ratio (M‐H, Random, 95% CI) | 0.89 [0.71, 1.11] |
| 3.1 WHO recommended ‐ matching vaccine | 1 | 1931 | Risk Ratio (M‐H, Random, 95% CI) | 0.63 [0.49, 0.80] |
| 3.2 WHO recommended ‐ vaccine matching absent or unknown | 1 | 2082 | Risk Ratio (M‐H, Random, 95% CI) | 1.05 [0.88, 1.25] |
| 3.3 Non WHO recommended ‐ vaccine matching absent or unknown | 1 | 19887 | Risk Ratio (M‐H, Random, 95% CI) | 0.98 [0.92, 1.05] |
| 4 Local harms Show forest plot | 13 | Risk Ratio (M‐H, Random, 95% CI) | Subtotals only | |
| 4.1 Local ‐ upper respiratory infection symptoms | 6 | 496 | Risk Ratio (M‐H, Random, 95% CI) | 1.66 [1.22, 2.27] |
| 4.2 Local ‐ cough | 6 | 2401 | Risk Ratio (M‐H, Random, 95% CI) | 1.51 [1.08, 2.10] |
| 4.3 Local ‐ coryza | 2 | 4782 | Risk Ratio (M‐H, Random, 95% CI) | 1.56 [1.26, 1.94] |
| 4.4 Local ‐ sore throat | 7 | 6940 | Risk Ratio (M‐H, Random, 95% CI) | 1.66 [1.49, 1.86] |
| 4.5 Local ‐ hoarseness | 1 | 306 | Risk Ratio (M‐H, Random, 95% CI) | 1.21 [0.51, 2.83] |
| 4.6 Local ‐ combined endpoint (any or highest symptom) | 3 | 4921 | Risk Ratio (M‐H, Random, 95% CI) | 1.56 [1.31, 1.87] |
| 5 Systemic harms Show forest plot | 7 | Risk Ratio (M‐H, Random, 95% CI) | Subtotals only | |
| 5.1 Systemic ‐ myalgia | 4 | 1318 | Risk Ratio (M‐H, Random, 95% CI) | 2.47 [1.26, 4.85] |
| 5.2 Systemic ‐ fever | 4 | 1318 | Risk Ratio (M‐H, Random, 95% CI) | 1.01 [0.54, 1.92] |
| 5.3 Systemic ‐ fatigue or indisposition | 3 | 1018 | Risk Ratio (M‐H, Random, 95% CI) | 1.39 [0.93, 2.07] |
| 5.4 Systemic ‐ headache | 2 | 975 | Risk Ratio (M‐H, Random, 95% CI) | 1.54 [1.09, 2.18] |
| 5.5 Systemic ‐ combined endpoint (any or highest symptom) | 5 | 1018 | Risk Ratio (M‐H, Random, 95% CI) | 1.40 [0.82, 2.38] |
| Outcome or subgroup title | No. of studies | No. of participants | Statistical method | Effect size |
| 1 Influenza Show forest plot | 1 | 1348 | Odds Ratio (M‐H, Random, 95% CI) | 0.38 [0.14, 1.02] |
| 1.1 WHO recommended ‐ vaccine matching absent or unknown | 1 | 1348 | Odds Ratio (M‐H, Random, 95% CI) | 0.38 [0.14, 1.02] |
| 1.2 WHO recommended ‐ matching vaccine | 0 | 0 | Odds Ratio (M‐H, Random, 95% CI) | 0.0 [0.0, 0.0] |
| 2 Local harms Show forest plot | 3 | 1578 | Risk Ratio (M‐H, Random, 95% CI) | 0.95 [0.71, 1.27] |
| 2.1 Local ‐ sore throat | 3 | 1500 | Risk Ratio (M‐H, Random, 95% CI) | 0.85 [0.54, 1.33] |
| 2.2 Local ‐ combined endpoint (any or highest symptom) | 1 | 78 | Risk Ratio (M‐H, Random, 95% CI) | 1.03 [0.71, 1.48] |
| 3 Systemic harms Show forest plot | 3 | 1880 | Risk Ratio (M‐H, Random, 95% CI) | 1.07 [0.71, 1.62] |
| 3.1 Systemic ‐ myalgia | 2 | 151 | Risk Ratio (M‐H, Random, 95% CI) | 0.90 [0.36, 2.25] |
| 3.2 Systemic ‐ fatigue or indisposition | 2 | 151 | Risk Ratio (M‐H, Random, 95% CI) | 1.40 [0.52, 3.75] |
| 3.3 Systemic ‐ headache | 2 | 151 | Risk Ratio (M‐H, Random, 95% CI) | 1.52 [0.85, 2.72] |
| 3.4 Systemic ‐ fever | 1 | 1349 | Risk Ratio (M‐H, Random, 95% CI) | 0.49 [0.03, 7.80] |
| 3.5 Systemic ‐ combined endpoint (any or highest symptom) | 1 | 78 | Risk Ratio (M‐H, Random, 95% CI) | 0.36 [0.12, 1.04] |
| Outcome or subgroup title | No. of studies | No. of participants | Statistical method | Effect size |
| 1 Seasonal inactivated vaccine effectiveness in mothers ‐ pregnant women Show forest plot | 3 | Risk Ratio (M‐H, Random, 95% CI) | Subtotals only | |
| 1.1 H1N1 ‐ vaccine ‐ effectiveness ILI (unadjusted data) | 1 | 7328 | Risk Ratio (M‐H, Random, 95% CI) | 0.11 [0.06, 0.21] |
| 1.2 Seasonal ‐ vaccine ‐ effectiveness ILI ‐ (unadjusted data) | 2 | 50129 | Risk Ratio (M‐H, Random, 95% CI) | 0.54 [0.22, 1.32] |
| 2 Seasonal inactivated vaccine effectiveness in newborns ‐ pregnant women Show forest plot | 2 | Hazard Ratio (Random, 95% CI) | Subtotals only | |
| 2.1 Seasonal vaccine effectiveness ILI (HR adjusted data) | 2 | Hazard Ratio (Random, 95% CI) | 0.96 [0.90, 1.03] | |
| 3 Seasonal inactivated vaccine effectiveness in newborns ‐ pregnant women Show forest plot | 1 | Risk Ratio (Random, 95% CI) | Subtotals only | |
| 3.1 Seasonal vaccine effectiveness ILI (RR adjusted data) | 1 | Risk Ratio (Random, 95% CI) | 0.92 [0.73, 1.16] | |
| 3.2 Seasonal vaccine efficacy influenza ‐ laboratory‐confirmed | 1 | Risk Ratio (Random, 95% CI) | 0.59 [0.37, 0.94] | |
| 4 H1N1 vaccine ‐ safety ‐ pregnancy‐related outcomes ‐ pregnant women Show forest plot | 9 | Odds Ratio (Random, 95% CI) | Subtotals only | |
| 4.1 Abortion (OR ‐ adjusted data) | 5 | Odds Ratio (Random, 95% CI) | 0.75 [0.62, 0.90] | |
| 4.2 Abortion (HR ‐ adjusted data) | 2 | Odds Ratio (Random, 95% CI) | 0.88 [0.67, 1.16] | |
| 4.3 Congenital malformation (OR ‐ adjusted data) | 5 | Odds Ratio (Random, 95% CI) | 1.06 [0.90, 1.25] | |
| 4.4 Prematurity (< 37 weeks) (OR adjusted data) | 8 | Odds Ratio (Random, 95% CI) | 0.86 [0.76, 0.97] | |
| 4.5 Neonatal death (OR adjusted data) | 1 | Odds Ratio (Random, 95% CI) | 1.81 [0.16, 20.35] | |
| 5 Seasonal vaccine ‐ safety ‐ pregnancy‐related outcomes ‐ pregnant women Show forest plot | 4 | Odds Ratio (Random, 95% CI) | Subtotals only | |
| 5.1 Abortion (OR ‐ unadjusted data) | 1 | Odds Ratio (Random, 95% CI) | 0.60 [0.41, 0.86] | |
| 5.2 Congenital malformation (OR unadjusted data) | 2 | Odds Ratio (Random, 95% CI) | 0.55 [0.08, 3.73] | |
| 5.3 Prematurity (OR unadjusted data) | 4 | Odds Ratio (Random, 95% CI) | 0.96 [0.79, 1.17] | |
| 5.4 Neonatal death (OR unadjusted data) | 1 | Odds Ratio (Random, 95% CI) | 0.55 [0.35, 0.88] | |
| Outcome or subgroup title | No. of studies | No. of participants | Statistical method | Effect size |
| 1 Effectiveness in newborns ‐ pregnant women (adjusted data) Show forest plot | 2 | Odds Ratio (Random, 95% CI) | 0.24 [0.04, 1.40] | |
| 1.1 Seasonal vaccine ‐ effectiveness ‐ ILI ‐ pregnant women | 2 | Odds Ratio (Random, 95% CI) | 0.24 [0.04, 1.40] | |
| 2 Seasonal vaccine safety ‐ pregnancy‐related outcomes (adjusted data) Show forest plot | 1 | Odds Ratio (Random, 95% CI) | 0.80 [0.36, 1.78] | |
| 2.1 Abortion | 1 | Odds Ratio (Random, 95% CI) | 0.80 [0.36, 1.78] | |
| Outcome or subgroup title | No. of studies | No. of participants | Statistical method | Effect size |
| 1 Seasonal influenza vaccination and Guillain‐Barré syndrome Show forest plot | 3 | Risk Ratio (Random, 95% CI) | 1.28 [0.85, 1.93] | |
| 1.1 General population (adjusted data) | 2 | Risk Ratio (Random, 95% CI) | 1.29 [0.83, 2.02] | |
| 1.2 Pregnant women (unadjusted data) | 1 | Risk Ratio (Random, 95% CI) | 0.65 [0.03, 15.95] | |
| Outcome or subgroup title | No. of studies | No. of participants | Statistical method | Effect size |
| 1 2009 to 2010 A/H1N1 ‐ general population (unadjusted data) Show forest plot | 6 | Odds Ratio (M‐H, Random, 95% CI) | Subtotals only | |
| 1.1 < 7 weeks | 6 | 1528 | Odds Ratio (M‐H, Random, 95% CI) | 2.22 [1.14, 4.31] |
| 1.2 At any time | 6 | 1656 | Odds Ratio (M‐H, Random, 95% CI) | 1.69 [0.87, 3.29] |
| 2 2009 to 2010 A/H1N1 ‐ general population (adjusted data) Show forest plot | 4 | Odds Ratio (Random, 95% CI) | 0.83 [0.39, 1.75] | |
| 2.1 < 7 weeks | 4 | Odds Ratio (Random, 95% CI) | 0.92 [0.35, 2.40] | |
| 2.2 > 6 weeks | 3 | Odds Ratio (Random, 95% CI) | 0.71 [0.22, 2.32] | |
| 3 Seasonal influenza vaccination general population (adjusted data) Show forest plot | 1 | Odds Ratio (Random, 95% CI) | 1.38 [0.18, 10.43] | |
| Outcome or subgroup title | No. of studies | No. of participants | Statistical method | Effect size |
| 1 Influenza vaccination (seasonal) ‐ demyelinating diseases (unadjusted data) Show forest plot | 1 | 223898 | Odds Ratio (M‐H, Random, 95% CI) | 0.16 [0.02, 1.25] |
| 1.1 General population | 0 | 0 | Odds Ratio (M‐H, Random, 95% CI) | 0.0 [0.0, 0.0] |
| 1.2 Pregnant women | 1 | 223898 | Odds Ratio (M‐H, Random, 95% CI) | 0.16 [0.02, 1.25] |
| 2 Influenza vaccination (H1N1) ‐ demyelinating diseases (unadjusted) Show forest plot | 1 | 144252 | Risk Ratio (M‐H, Random, 95% CI) | 2.06 [0.51, 8.22] |
| Outcome or subgroup title | No. of studies | No. of participants | Statistical method | Effect size |
| 1 Influenza vaccination (seasonal) ‐ general population ‐ demyelinating diseases (unadjusted data) Show forest plot | 4 | 8009 | Odds Ratio (M‐H, Random, 95% CI) | 0.96 [0.79, 1.17] |
| 2 Influenza vaccination (seasonal) ‐ general population ‐ multiple sclerosis (adjusted data) Show forest plot | 2 | (Random, 95% CI) | 0.76 [0.54, 1.08] | |
| 3 Influenza vaccination (seasonal) ‐ general population ‐ optic neuritis (adjusted data) Show forest plot | 2 | Odds Ratio (Random, 95% CI) | 1.03 [0.82, 1.30] | |
| Outcome or subgroup title | No. of studies | No. of participants | Statistical method | Effect size |
| 1 Seasonal influenza vaccine ‐ HR (adjusted data) Show forest plot | 1 | Hazard Ratio (Random, 95% CI) | Subtotals only | |
| 1.1 General population | 0 | Hazard Ratio (Random, 95% CI) | 0.0 [0.0, 0.0] | |
| 1.2 Pregnant women | 1 | Hazard Ratio (Random, 95% CI) | 0.90 [0.68, 1.19] | |
| 2 Seasonal influenza vaccine (unadjusted data) Show forest plot | 1 | Odds Ratio (M‐H, Random, 95% CI) | Subtotals only | |
| 2.1 General population | 0 | 0 | Odds Ratio (M‐H, Random, 95% CI) | 0.0 [0.0, 0.0] |
| 2.2 Pregnant women | 1 | 223898 | Odds Ratio (M‐H, Random, 95% CI) | 0.92 [0.70, 1.20] |
| Outcome or subgroup title | No. of studies | No. of participants | Statistical method | Effect size |
| 1 Seasonal influenza vaccine ‐ general population (adjusted data) Show forest plot | 2 | Odds Ratio (Random, 95% CI) | Subtotals only | |
| 1.1 < 2 months | 2 | Odds Ratio (Random, 95% CI) | 1.87 [0.43, 8.06] | |
| 1.2 < 6 months | 1 | Odds Ratio (Random, 95% CI) | 0.90 [0.55, 1.47] | |
| 1.3 < 12 months | 1 | Odds Ratio (Random, 95% CI) | 0.70 [0.47, 1.04] | |
| 2 Seasonal influenza vaccine ‐ general population (unadjusted data) Show forest plot | 2 | Odds Ratio (M‐H, Random, 95% CI) | Subtotals only | |
| 2.1 < 2 months | 2 | 1926 | Odds Ratio (M‐H, Random, 95% CI) | 1.72 [0.48, 6.15] |
| 2.2 < 6 months | 1 | 1065 | Odds Ratio (M‐H, Random, 95% CI) | 0.92 [0.59, 1.43] |
| 2.3 < 12 months | 1 | 1066 | Odds Ratio (M‐H, Random, 95% CI) | 0.72 [0.50, 1.05] |
| Outcome or subgroup title | No. of studies | No. of participants | Statistical method | Effect size |
| 1 Influenza‐like illness Show forest plot | 3 | 3065 | Risk Ratio (M‐H, Random, 95% CI) | 0.71 [0.57, 0.88] |
| 1.1 Standard recommended parenteral ‐ non‐matching ‐ 1 dose | 3 | 2715 | Risk Ratio (M‐H, Random, 95% CI) | 0.74 [0.57, 0.95] |
| 1.2 Standard recommended parenteral ‐ non‐matching ‐ 2 doses | 1 | 350 | Risk Ratio (M‐H, Random, 95% CI) | 0.66 [0.44, 0.98] |
| 2 Influenza Show forest plot | 1 | 2072 | Risk Ratio (M‐H, Random, 95% CI) | 0.47 [0.26, 0.87] |
| 2.1 Standard recommended parenteral ‐ non‐matching | 1 | 2072 | Risk Ratio (M‐H, Random, 95% CI) | 0.47 [0.26, 0.87] |
| 3 Hospitalisations Show forest plot | 1 | 2072 | Risk Ratio (M‐H, Random, 95% CI) | 0.83 [0.41, 1.68] |
| 3.1 Standard recommended parenteral ‐ non‐matching | 1 | 2072 | Risk Ratio (M‐H, Random, 95% CI) | 0.83 [0.41, 1.68] |
| 4 Pneumonia Show forest plot | 1 | 2072 | Risk Ratio (M‐H, Random, 95% CI) | 1.01 [0.14, 7.17] |
| 4.1 Standard recommended parenteral ‐ non‐matching | 1 | 2072 | Risk Ratio (M‐H, Random, 95% CI) | 1.01 [0.14, 7.17] |
| Outcome or subgroup title | No. of studies | No. of participants | Statistical method | Effect size |
| 1 Influenza‐like illness Show forest plot | 4 | 4580 | Risk Ratio (M‐H, Random, 95% CI) | 0.35 [0.25, 0.48] |
| 1.1 WHO recommended parenteral ‐ matching vaccine ‐ 1 dose | 4 | 4226 | Risk Ratio (M‐H, Random, 95% CI) | 0.35 [0.23, 0.53] |
| 1.2 WHO recommended parenteral ‐ matching vaccine ‐ 2 doses | 1 | 354 | Risk Ratio (M‐H, Random, 95% CI) | 0.35 [0.22, 0.57] |
| 2 Influenza Show forest plot | 1 | 1923 | Risk Ratio (M‐H, Random, 95% CI) | 0.07 [0.02, 0.31] |
| 2.1 WHO recommended parenteral ‐ matching vaccine | 1 | 1923 | Risk Ratio (M‐H, Random, 95% CI) | 0.07 [0.02, 0.31] |
| 3 Hospitalisations Show forest plot | 1 | 1923 | Risk Ratio (M‐H, Random, 95% CI) | 0.35 [0.13, 0.94] |
| 3.1 WHO recommended parenteral ‐ matching vaccine | 1 | 1923 | Risk Ratio (M‐H, Random, 95% CI) | 0.35 [0.13, 0.94] |
| 4 Pneumonia Show forest plot | 1 | 1923 | Risk Ratio (M‐H, Random, 95% CI) | 0.59 [0.05, 6.51] |
| 4.1 WHO recommended parenteral ‐ matching vaccine | 1 | 1923 | Risk Ratio (M‐H, Random, 95% CI) | 0.59 [0.05, 6.51] |
| 5 Working days lost Show forest plot | 1 | 1667 | Mean Difference (IV, Random, 95% CI) | ‐0.45 [‐0.60, ‐0.30] |
| 5.1 WHO recommended parenteral ‐ matching vaccine | 1 | 1667 | Mean Difference (IV, Random, 95% CI) | ‐0.45 [‐0.60, ‐0.30] |
| 6 Days ill Show forest plot | 1 | 1667 | Mean Difference (IV, Random, 95% CI) | ‐0.45 [‐0.60, ‐0.30] |
| 6.1 WHO recommended ‐ matching vaccine | 1 | 1667 | Mean Difference (IV, Random, 95% CI) | ‐0.45 [‐0.60, ‐0.30] |
| Outcome or subgroup title | No. of studies | No. of participants | Statistical method | Effect size |
| 1 Influenza‐like illness Show forest plot | 2 | 1000 | Risk Ratio (M‐H, Random, 95% CI) | 0.66 [0.46, 0.95] |
| 1.1 Inactivated polyvalent aerosol vaccine versus placebo ‐ non‐matching ‐ 1 dose | 2 | 644 | Risk Ratio (M‐H, Random, 95% CI) | 0.64 [0.32, 1.27] |
| 1.2 Inactivated polyvalent aerosol vaccine versus placebo ‐ non‐matching ‐ 2 doses | 1 | 356 | Risk Ratio (M‐H, Random, 95% CI) | 0.65 [0.44, 0.97] |
| Outcome or subgroup title | No. of studies | No. of participants | Statistical method | Effect size |
| 1 Influenza‐like illness Show forest plot | 2 | 1009 | Risk Ratio (M‐H, Random, 95% CI) | 0.54 [0.32, 0.91] |
| 1.1 Inactivated monovalent aerosol vaccine versus placebo ‐ matching ‐ 1 dose | 2 | 650 | Risk Ratio (M‐H, Random, 95% CI) | 0.49 [0.17, 1.41] |
| 1.2 Inactivated monovalent aerosol vaccine versus placebo ‐ matching ‐ 2 doses | 1 | 359 | Risk Ratio (M‐H, Random, 95% CI) | 0.57 [0.38, 0.86] |
| Outcome or subgroup title | No. of studies | No. of participants | Statistical method | Effect size |
| 1 Influenza cases (clinically defined without clear definition) Show forest plot | 1 | 19887 | Risk Ratio (M‐H, Random, 95% CI) | 0.98 [0.92, 1.05] |
| 1.1 Non‐matching | 1 | 19887 | Risk Ratio (M‐H, Random, 95% CI) | 0.98 [0.92, 1.05] |
| 2 Complications (bronchitis, otitis, pneumonia) Show forest plot | 1 | 19887 | Risk Ratio (M‐H, Random, 95% CI) | 0.25 [0.03, 2.24] |
| 2.1 Non‐matching | 1 | 19887 | Risk Ratio (M‐H, Random, 95% CI) | 0.25 [0.03, 2.24] |