Scolaris Content Display Scolaris Content Display

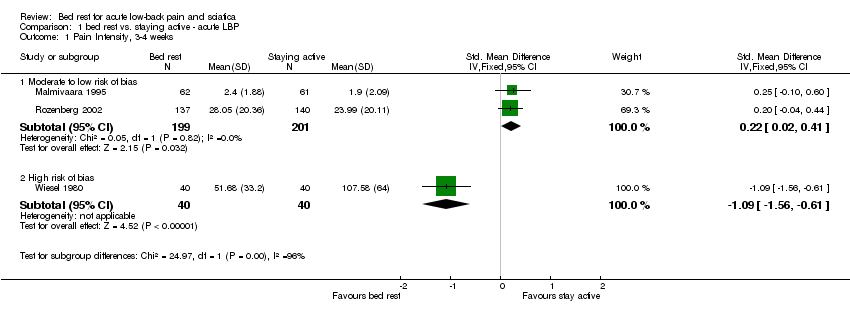
Comparison 1 bed rest vs. staying active ‐ acute LBP, Outcome 1 Pain Intensity, 3‐4 weeks.
Figuras y tablas -
Analysis 1.1

Comparison 1 bed rest vs. staying active ‐ acute LBP, Outcome 1 Pain Intensity, 3‐4 weeks.

Comparison 1 bed rest vs. staying active ‐ acute LBP, Outcome 2 Pain Intensity, 12 weeks.
Figuras y tablas -
Analysis 1.2

Comparison 1 bed rest vs. staying active ‐ acute LBP, Outcome 2 Pain Intensity, 12 weeks.

Comparison 1 bed rest vs. staying active ‐ acute LBP, Outcome 3 Functional status, 3‐4 weeks.
Figuras y tablas -
Analysis 1.3

Comparison 1 bed rest vs. staying active ‐ acute LBP, Outcome 3 Functional status, 3‐4 weeks.

Comparison 1 bed rest vs. staying active ‐ acute LBP, Outcome 4 Functional status, 12 weeks.
Figuras y tablas -
Analysis 1.4

Comparison 1 bed rest vs. staying active ‐ acute LBP, Outcome 4 Functional status, 12 weeks.

Comparison 1 bed rest vs. staying active ‐ acute LBP, Outcome 5 Length of sick leave, 3‐4 weeks.
Figuras y tablas -
Analysis 1.5

Comparison 1 bed rest vs. staying active ‐ acute LBP, Outcome 5 Length of sick leave, 3‐4 weeks.

Comparison 1 bed rest vs. staying active ‐ acute LBP, Outcome 6 Length of sick leave, 12 weeks.
Figuras y tablas -
Analysis 1.6

Comparison 1 bed rest vs. staying active ‐ acute LBP, Outcome 6 Length of sick leave, 12 weeks.

Comparison 2 bed rest vs. staying active ‐ sciatica, Outcome 1 Pain Intensity, 3‐4 weeks.
Figuras y tablas -
Analysis 2.1

Comparison 2 bed rest vs. staying active ‐ sciatica, Outcome 1 Pain Intensity, 3‐4 weeks.

Comparison 2 bed rest vs. staying active ‐ sciatica, Outcome 2 Pain Intensity, 12 weeks.
Figuras y tablas -
Analysis 2.2

Comparison 2 bed rest vs. staying active ‐ sciatica, Outcome 2 Pain Intensity, 12 weeks.

Comparison 2 bed rest vs. staying active ‐ sciatica, Outcome 3 Functional status, 3‐4 weeks.
Figuras y tablas -
Analysis 2.3

Comparison 2 bed rest vs. staying active ‐ sciatica, Outcome 3 Functional status, 3‐4 weeks.

Comparison 2 bed rest vs. staying active ‐ sciatica, Outcome 4 Functional status, 12 weeks.
Figuras y tablas -
Analysis 2.4

Comparison 2 bed rest vs. staying active ‐ sciatica, Outcome 4 Functional status, 12 weeks.

Comparison 3 bed rest vs. staying active ‐ mixed LBP, Outcome 1 Functional status, 1 week.
Figuras y tablas -
Analysis 3.1

Comparison 3 bed rest vs. staying active ‐ mixed LBP, Outcome 1 Functional status, 1 week.

Comparison 3 bed rest vs. staying active ‐ mixed LBP, Outcome 2 Functional status, 4 weeks.
Figuras y tablas -
Analysis 3.2

Comparison 3 bed rest vs. staying active ‐ mixed LBP, Outcome 2 Functional status, 4 weeks.

Comparison 3 bed rest vs. staying active ‐ mixed LBP, Outcome 3 Length of sick leave, 4 weeks.
Figuras y tablas -
Analysis 3.3

Comparison 3 bed rest vs. staying active ‐ mixed LBP, Outcome 3 Length of sick leave, 4 weeks.

Comparison 4 bed rest vs. other treatments ‐ acute LBP, Outcome 1 Pain Intensity, 3 weeks.
Figuras y tablas -
Analysis 4.1

Comparison 4 bed rest vs. other treatments ‐ acute LBP, Outcome 1 Pain Intensity, 3 weeks.

Comparison 4 bed rest vs. other treatments ‐ acute LBP, Outcome 2 Pain Intensity, 12 weeks.
Figuras y tablas -
Analysis 4.2

Comparison 4 bed rest vs. other treatments ‐ acute LBP, Outcome 2 Pain Intensity, 12 weeks.

Comparison 4 bed rest vs. other treatments ‐ acute LBP, Outcome 3 Functional status, 3 weeks.
Figuras y tablas -
Analysis 4.3

Comparison 4 bed rest vs. other treatments ‐ acute LBP, Outcome 3 Functional status, 3 weeks.

Comparison 4 bed rest vs. other treatments ‐ acute LBP, Outcome 4 Functional status, 12 weeks.
Figuras y tablas -
Analysis 4.4

Comparison 4 bed rest vs. other treatments ‐ acute LBP, Outcome 4 Functional status, 12 weeks.

Comparison 4 bed rest vs. other treatments ‐ acute LBP, Outcome 5 Length of sick leave, 3 weeks.
Figuras y tablas -
Analysis 4.5

Comparison 4 bed rest vs. other treatments ‐ acute LBP, Outcome 5 Length of sick leave, 3 weeks.

Comparison 4 bed rest vs. other treatments ‐ acute LBP, Outcome 6 Length of sick leave, 12 weeks.
Figuras y tablas -
Analysis 4.6

Comparison 4 bed rest vs. other treatments ‐ acute LBP, Outcome 6 Length of sick leave, 12 weeks.

Comparison 5 bed rest vs. other treatments ‐ sciatica, Outcome 1 Pain Intensity, 4 weeks.
Figuras y tablas -
Analysis 5.1

Comparison 5 bed rest vs. other treatments ‐ sciatica, Outcome 1 Pain Intensity, 4 weeks.

Comparison 5 bed rest vs. other treatments ‐ sciatica, Outcome 2 Pain Intensity, 12 weeks.
Figuras y tablas -
Analysis 5.2

Comparison 5 bed rest vs. other treatments ‐ sciatica, Outcome 2 Pain Intensity, 12 weeks.

Comparison 5 bed rest vs. other treatments ‐ sciatica, Outcome 3 Functional status, 4 weeks.
Figuras y tablas -
Analysis 5.3

Comparison 5 bed rest vs. other treatments ‐ sciatica, Outcome 3 Functional status, 4 weeks.

Comparison 5 bed rest vs. other treatments ‐ sciatica, Outcome 4 Functional status, 12 weeks.
Figuras y tablas -
Analysis 5.4

Comparison 5 bed rest vs. other treatments ‐ sciatica, Outcome 4 Functional status, 12 weeks.

Comparison 6 short vs. long bed rest ‐ acute LBP, Outcome 1 Pain lntensity.
Figuras y tablas -
Analysis 6.1

Comparison 6 short vs. long bed rest ‐ acute LBP, Outcome 1 Pain lntensity.

Comparison 7 short vs. long bed rest ‐ mixed LBP, Outcome 1 Proportion of patients recovered.
Figuras y tablas -
Analysis 7.1

Comparison 7 short vs. long bed rest ‐ mixed LBP, Outcome 1 Proportion of patients recovered.

Table 1. Operationalization of internal validity criteria

1. Concealment of allocation
MET: Use of centralised (e.g. group assignment by a central office unaware of subject characteristics); on‐site computer system combined with group assignments in a locked unreadable computer file that could be accessed only after entering characteristics of an enrolled subject; sequentially numbered, sealed, opaque envelopes; i.e. the randomizations was independent of provider and investigator.
UNCLEAR: Concealment approach was not reported and could not be verified by contacting the investigators
NOT MET: Included alternation, case record numbers, dates of birth, day of the week, and any allocation procedure that was entirely transparent before assignment, such as an open list of random numbers of assignments

2. Co‐interventions
MET: Interventions other than bed rest avoided, or used similarly across comparison groups
UNCLEAR: Use of interventions other than bed rest not reported and could not be verified by contacting the investigators
NOT MET: Dissimilar use of interventions other than bed rest

3. Intention‐to‐treat analysis or losses to follow‐up
MET: Intention to treat analysis performed or possible AND losses to follow‐up less than 20% and equally distributed between comparison groups
UNCLEAR: Exclusion reported, losses to follow‐up less than 20% and equally distributed between comparison groups
NOT MET: Exclusion not reported and could not be verified by contacting the investigators, losses to follow‐up greater than 20%

4. Outcome assessment
MET: Assessor unaware of the assigned treatment when collecting outcome measures
UNCLEAR: Blinding of assessor not reported and could not be verified by contacting the investigators
NOT MET: Assessor aware of the assigned treatment when collecting outcome measures

Figuras y tablas -
Table 1. Operationalization of internal validity criteria
Comparison 1. bed rest vs. staying active ‐ acute LBP

Outcome or subgroup title

No. of studies

No. of participants

Statistical method

Effect size

1 Pain Intensity, 3‐4 weeks Show forest plot

3

Std. Mean Difference (IV, Fixed, 95% CI)

Subtotals only

1.1 Moderate to low risk of bias

2

400

Std. Mean Difference (IV, Fixed, 95% CI)

0.22 [0.02, 0.41]

1.2 High risk of bias

1

80

Std. Mean Difference (IV, Fixed, 95% CI)

‐1.09 [‐1.56, ‐0.61]

2 Pain Intensity, 12 weeks Show forest plot

2

Std. Mean Difference (IV, Fixed, 95% CI)

Subtotals only

2.1 Moderate to low risk of bias

2

393

Std. Mean Difference (IV, Fixed, 95% CI)

0.25 [0.05, 0.45]

2.2 High risk of bias

0

0

Std. Mean Difference (IV, Fixed, 95% CI)

0.0 [0.0, 0.0]

3 Functional status, 3‐4 weeks Show forest plot

2

400

Std. Mean Difference (IV, Fixed, 95% CI)

0.29 [0.09, 0.49]

3.1 Moderate to low risk of bias

2

400

Std. Mean Difference (IV, Fixed, 95% CI)

0.29 [0.09, 0.49]

4 Functional status, 12 weeks Show forest plot

2

393

Std. Mean Difference (IV, Fixed, 95% CI)

0.24 [0.04, 0.44]

4.1 Moderate to low risk of bias

2

393

Std. Mean Difference (IV, Fixed, 95% CI)

0.24 [0.04, 0.44]

5 Length of sick leave, 3‐4 weeks Show forest plot

2

Mean Difference (IV, Fixed, 95% CI)

Totals not selected

5.1 Moderate to low risk of bias

1

Mean Difference (IV, Fixed, 95% CI)

0.0 [0.0, 0.0]

5.2 High risk of bias

1

Mean Difference (IV, Fixed, 95% CI)

0.0 [0.0, 0.0]

6 Length of sick leave, 12 weeks Show forest plot

1

Mean Difference (IV, Fixed, 95% CI)

Subtotals only

6.1 Low risk of bias

1

123

Mean Difference (IV, Fixed, 95% CI)

4.50 [1.37, 7.63]

Figuras y tablas -
Comparison 1. bed rest vs. staying active ‐ acute LBP
Comparison 2. bed rest vs. staying active ‐ sciatica

Outcome or subgroup title

No. of studies

No. of participants

Statistical method

Effect size

1 Pain Intensity, 3‐4 weeks Show forest plot

2

Std. Mean Difference (IV, Fixed, 95% CI)

Subtotals only

1.1 Low risk of bias

2

346

Std. Mean Difference (IV, Fixed, 95% CI)

‐0.03 [‐0.24, 0.18]

2 Pain Intensity, 12 weeks Show forest plot

2

Std. Mean Difference (IV, Fixed, 95% CI)

Subtotals only

2.1 Low risk of bias

2

330

Std. Mean Difference (IV, Fixed, 95% CI)

0.10 [‐0.12, 0.31]

3 Functional status, 3‐4 weeks Show forest plot

2

346

Std. Mean Difference (IV, Fixed, 95% CI)

0.19 [‐0.02, 0.41]

3.1 Low risk of bias

2

346

Std. Mean Difference (IV, Fixed, 95% CI)

0.19 [‐0.02, 0.41]

4 Functional status, 12 weeks Show forest plot

2

330

Std. Mean Difference (IV, Fixed, 95% CI)

0.12 [‐0.10, 0.33]

4.1 Low risk of bias

2

330

Std. Mean Difference (IV, Fixed, 95% CI)

0.12 [‐0.10, 0.33]

Figuras y tablas -
Comparison 2. bed rest vs. staying active ‐ sciatica
Comparison 3. bed rest vs. staying active ‐ mixed LBP

Outcome or subgroup title

No. of studies

No. of participants

Statistical method

Effect size

1 Functional status, 1 week Show forest plot

1

33

Mean Difference (IV, Fixed, 95% CI)

9.60 [‐4.42, 23.62]

1.1 Moderate to low risk of bias

1

33

Mean Difference (IV, Fixed, 95% CI)

9.60 [‐4.42, 23.62]

1.2 High risk of bias

0

0

Mean Difference (IV, Fixed, 95% CI)

0.0 [0.0, 0.0]

2 Functional status, 4 weeks Show forest plot

1

34

Mean Difference (IV, Fixed, 95% CI)

3.70 [‐9.45, 16.85]

2.1 Moderate to low risk of bias

1

34

Mean Difference (IV, Fixed, 95% CI)

3.70 [‐9.45, 16.85]

2.2 High risk of bias

0

0

Mean Difference (IV, Fixed, 95% CI)

0.0 [0.0, 0.0]

3 Length of sick leave, 4 weeks Show forest plot

1

Mean Difference (IV, Fixed, 95% CI)

Subtotals only

3.1 Moderate to low risk of bias

1

22

Mean Difference (IV, Fixed, 95% CI)

‐1.0 [‐8.73, 6.73]

Figuras y tablas -
Comparison 3. bed rest vs. staying active ‐ mixed LBP
Comparison 4. bed rest vs. other treatments ‐ acute LBP

Outcome or subgroup title

No. of studies

No. of participants

Statistical method

Effect size

1 Pain Intensity, 3 weeks Show forest plot

1

Mean Difference (IV, Fixed, 95% CI)

Subtotals only

1.1 Moderate to low risk of bias

1

104

Mean Difference (IV, Fixed, 95% CI)

0.5 [‐0.37, 1.37]

2 Pain Intensity, 12 weeks Show forest plot

1

Mean Difference (IV, Fixed, 95% CI)

Subtotals only

2.1 Moderate to low risk of bias

1

99

Mean Difference (IV, Fixed, 95% CI)

0.30 [‐0.55, 1.15]

3 Functional status, 3 weeks Show forest plot

1

Mean Difference (IV, Fixed, 95% CI)

Totals not selected

3.1 Moderate to low risk of bias

1

Mean Difference (IV, Fixed, 95% CI)

0.0 [0.0, 0.0]

4 Functional status, 12 weeks Show forest plot

1

Mean Difference (IV, Fixed, 95% CI)

Subtotals only

4.1 Moderate to low risk of bias

1

104

Mean Difference (IV, Fixed, 95% CI)

1.0 [‐3.79, 5.79]

5 Length of sick leave, 3 weeks Show forest plot

1

Mean Difference (IV, Fixed, 95% CI)

Totals not selected

5.1 Moderate to low risk of bias

1

Mean Difference (IV, Fixed, 95% CI)

0.0 [0.0, 0.0]

6 Length of sick leave, 12 weeks Show forest plot

1

Mean Difference (IV, Fixed, 95% CI)

Subtotals only

6.1 Moderate to low risk of bias

1

110

Mean Difference (IV, Fixed, 95% CI)

2.00 [‐1.85, 5.85]

Figuras y tablas -
Comparison 4. bed rest vs. other treatments ‐ acute LBP
Comparison 5. bed rest vs. other treatments ‐ sciatica

Outcome or subgroup title

No. of studies

No. of participants

Statistical method

Effect size

1 Pain Intensity, 4 weeks Show forest plot

1

Mean Difference (IV, Fixed, 95% CI)

Subtotals only

1.1 Moderate to low risk of bias

1

162

Mean Difference (IV, Fixed, 95% CI)

2.90 [‐5.71, 11.51]

2 Pain Intensity, 12 weeks Show forest plot

1

Mean Difference (IV, Fixed, 95% CI)

Subtotals only

2.1 Moderate to low risk of bias

1

159

Mean Difference (IV, Fixed, 95% CI)

3.50 [‐5.73, 12.73]

3 Functional status, 4 weeks Show forest plot

1

Mean Difference (IV, Fixed, 95% CI)

Totals not selected

3.1 Moderate to low risk of bias

1

Mean Difference (IV, Fixed, 95% CI)

0.0 [0.0, 0.0]

4 Functional status, 12 weeks Show forest plot

1

Mean Difference (IV, Fixed, 95% CI)

Subtotals only

4.1 Moderate to low risk of bias

1

159

Mean Difference (IV, Fixed, 95% CI)

5.40 [‐2.10, 12.90]

Figuras y tablas -
Comparison 5. bed rest vs. other treatments ‐ sciatica
Comparison 6. short vs. long bed rest ‐ acute LBP

Outcome or subgroup title

No. of studies

No. of participants

Statistical method

Effect size

1 Pain lntensity Show forest plot

1

47

Mean Difference (IV, Fixed, 95% CI)

0.20 [‐0.15, 0.55]

Figuras y tablas -
Comparison 6. short vs. long bed rest ‐ acute LBP
Comparison 7. short vs. long bed rest ‐ mixed LBP

Outcome or subgroup title

No. of studies

No. of participants

Statistical method

Effect size

1 Proportion of patients recovered Show forest plot

1

189

Peto Odds Ratio (Peto, Fixed, 95% CI)

1.08 [0.60, 1.95]

Figuras y tablas -
Comparison 7. short vs. long bed rest ‐ mixed LBP