Scolaris Content Display Scolaris Content Display

Of every 100 asthma patients treated with immunotherapy, 30 patients will be prevented from having an attack (worse symptoms), 40 would not have had an attack anyway and 30 will still have an attack. In other words, about 4 patients have to be treated to prevent one attack of asthma.
Figuras y tablas -
Figure 1

Of every 100 asthma patients treated with immunotherapy, 30 patients will be prevented from having an attack (worse symptoms), 40 would not have had an attack anyway and 30 will still have an attack. In other words, about 4 patients have to be treated to prevent one attack of asthma.

Comparison 1 Allergen immunotherapy versus placebo, Outcome 1 Asthma symptom scores.
Figuras y tablas -
Analysis 1.1

Comparison 1 Allergen immunotherapy versus placebo, Outcome 1 Asthma symptom scores.

Comparison 1 Allergen immunotherapy versus placebo, Outcome 2 Symptomatic deterioration.
Figuras y tablas -
Analysis 1.2

Comparison 1 Allergen immunotherapy versus placebo, Outcome 2 Symptomatic deterioration.

Comparison 1 Allergen immunotherapy versus placebo, Outcome 3 Asthma medication scores.
Figuras y tablas -
Analysis 1.3

Comparison 1 Allergen immunotherapy versus placebo, Outcome 3 Asthma medication scores.

Comparison 1 Allergen immunotherapy versus placebo, Outcome 4 Increased asthma medication.
Figuras y tablas -
Analysis 1.4

Comparison 1 Allergen immunotherapy versus placebo, Outcome 4 Increased asthma medication.

Comparison 1 Allergen immunotherapy versus placebo, Outcome 5 Lung function parameters.
Figuras y tablas -
Analysis 1.5

Comparison 1 Allergen immunotherapy versus placebo, Outcome 5 Lung function parameters.

Comparison 1 Allergen immunotherapy versus placebo, Outcome 6 Deterioration in lung function.
Figuras y tablas -
Analysis 1.6

Comparison 1 Allergen immunotherapy versus placebo, Outcome 6 Deterioration in lung function.

Comparison 1 Allergen immunotherapy versus placebo, Outcome 7 Nonspecific BHR indices.
Figuras y tablas -
Analysis 1.7

Comparison 1 Allergen immunotherapy versus placebo, Outcome 7 Nonspecific BHR indices.

Comparison 1 Allergen immunotherapy versus placebo, Outcome 8 Increased nonspecific BHR.
Figuras y tablas -
Analysis 1.8

Comparison 1 Allergen immunotherapy versus placebo, Outcome 8 Increased nonspecific BHR.

Comparison 1 Allergen immunotherapy versus placebo, Outcome 9 Allergen specific BHR indices.
Figuras y tablas -
Analysis 1.9

Comparison 1 Allergen immunotherapy versus placebo, Outcome 9 Allergen specific BHR indices.

Comparison 1 Allergen immunotherapy versus placebo, Outcome 10 Increased allergen specific BHR.
Figuras y tablas -
Analysis 1.10

Comparison 1 Allergen immunotherapy versus placebo, Outcome 10 Increased allergen specific BHR.

Comparison 2 Allergen immunotherapy versus antigenically inactive control, Outcome 1 Asthma symptom scores.
Figuras y tablas -
Analysis 2.1

Comparison 2 Allergen immunotherapy versus antigenically inactive control, Outcome 1 Asthma symptom scores.

Comparison 2 Allergen immunotherapy versus antigenically inactive control, Outcome 2 Symptomatic deterioration.
Figuras y tablas -
Analysis 2.2

Comparison 2 Allergen immunotherapy versus antigenically inactive control, Outcome 2 Symptomatic deterioration.

Comparison 2 Allergen immunotherapy versus antigenically inactive control, Outcome 3 Increased asthma medication.
Figuras y tablas -
Analysis 2.3

Comparison 2 Allergen immunotherapy versus antigenically inactive control, Outcome 3 Increased asthma medication.

Comparison 3 House dust versus placebo, Outcome 1 Symptomatic deterioration.
Figuras y tablas -
Analysis 3.1

Comparison 3 House dust versus placebo, Outcome 1 Symptomatic deterioration.

Comparison 3 House dust versus placebo, Outcome 2 Increased asthma medication.
Figuras y tablas -
Analysis 3.2

Comparison 3 House dust versus placebo, Outcome 2 Increased asthma medication.

Comparison 3 House dust versus placebo, Outcome 3 Deterioration in lung function.
Figuras y tablas -
Analysis 3.3

Comparison 3 House dust versus placebo, Outcome 3 Deterioration in lung function.

Comparison 3 House dust versus placebo, Outcome 4 Increased allergen specific BHR.
Figuras y tablas -
Analysis 3.4

Comparison 3 House dust versus placebo, Outcome 4 Increased allergen specific BHR.

Comparison 4 Allergen immunotherapy versus untreated control, Outcome 1 Asthma symptom scores.
Figuras y tablas -
Analysis 4.1

Comparison 4 Allergen immunotherapy versus untreated control, Outcome 1 Asthma symptom scores.

Comparison 4 Allergen immunotherapy versus untreated control, Outcome 2 Asthma medication scores.
Figuras y tablas -
Analysis 4.2

Comparison 4 Allergen immunotherapy versus untreated control, Outcome 2 Asthma medication scores.

Comparison 4 Allergen immunotherapy versus untreated control, Outcome 3 Lung function parameters.
Figuras y tablas -
Analysis 4.3

Comparison 4 Allergen immunotherapy versus untreated control, Outcome 3 Lung function parameters.

Comparison 4 Allergen immunotherapy versus untreated control, Outcome 4 Nonspecific BHR indices.
Figuras y tablas -
Analysis 4.4

Comparison 4 Allergen immunotherapy versus untreated control, Outcome 4 Nonspecific BHR indices.

Comparison 4 Allergen immunotherapy versus untreated control, Outcome 5 Allergen specific BHR indices.
Figuras y tablas -
Analysis 4.5

Comparison 4 Allergen immunotherapy versus untreated control, Outcome 5 Allergen specific BHR indices.

Comparison 4 Allergen immunotherapy versus untreated control, Outcome 6 Increased allergen specific BHR.
Figuras y tablas -
Analysis 4.6

Comparison 4 Allergen immunotherapy versus untreated control, Outcome 6 Increased allergen specific BHR.

Comparison 5 Allergen immunotherapy versus Inhaled steroid, Outcome 1 Asthma symptom scores.
Figuras y tablas -
Analysis 5.1

Comparison 5 Allergen immunotherapy versus Inhaled steroid, Outcome 1 Asthma symptom scores.

Comparison 5 Allergen immunotherapy versus Inhaled steroid, Outcome 2 Deterioration in FEV1.
Figuras y tablas -
Analysis 5.2

Comparison 5 Allergen immunotherapy versus Inhaled steroid, Outcome 2 Deterioration in FEV1.

Comparison 1. Allergen immunotherapy versus placebo

Outcome or subgroup title

No. of studies

No. of participants

Statistical method

Effect size

1 Asthma symptom scores Show forest plot

27

1064

Std. Mean Difference (IV, Random, 95% CI)

‐0.72 [‐0.99, ‐0.44]

1.1 Mite immunotherapy

9

304

Std. Mean Difference (IV, Random, 95% CI)

‐0.78 [‐1.27, ‐0.29]

1.2 Pollen immunotherapy

14

547

Std. Mean Difference (IV, Random, 95% CI)

‐0.66 [‐0.99, ‐0.33]

1.3 Other immunotherapy

5

213

Std. Mean Difference (IV, Random, 95% CI)

‐0.83 [‐1.92, 0.26]

2 Symptomatic deterioration Show forest plot

22

1112

Risk Ratio (M‐H, Random, 95% CI)

0.51 [0.41, 0.65]

2.1 Mite immunotherapy

12

460

Risk Ratio (M‐H, Random, 95% CI)

0.62 [0.44, 0.87]

2.2 Pollen immunotherapy

3

220

Risk Ratio (M‐H, Random, 95% CI)

0.25 [0.07, 0.90]

2.3 Animal dander immunotherapy

4

107

Risk Ratio (M‐H, Random, 95% CI)

0.47 [0.24, 0.92]

2.4 Other immunotherapy

3

325

Risk Ratio (M‐H, Random, 95% CI)

0.46 [0.33, 0.65]

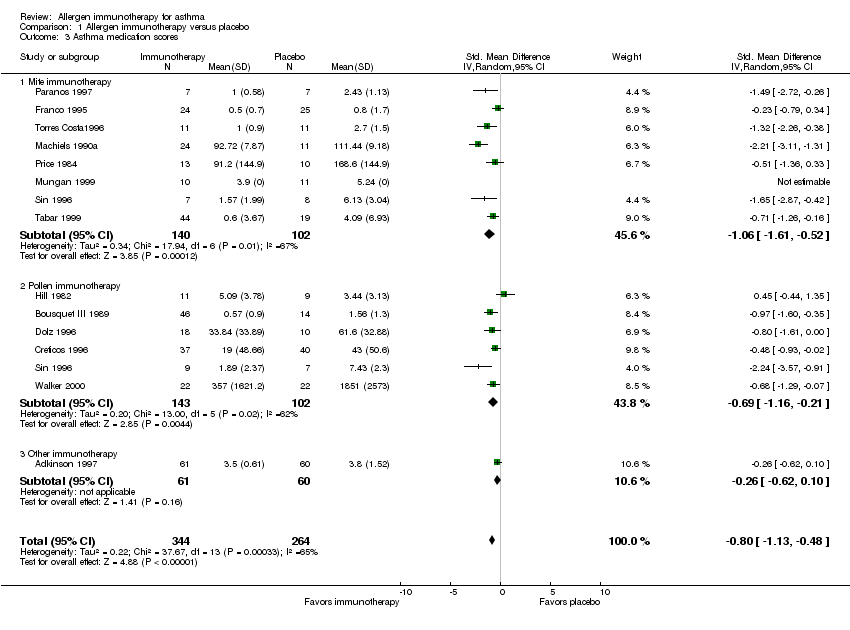
3 Asthma medication scores Show forest plot

14

608

Std. Mean Difference (IV, Random, 95% CI)

‐0.80 [‐1.13, ‐0.48]

3.1 Mite immunotherapy

8

242

Std. Mean Difference (IV, Random, 95% CI)

‐1.06 [‐1.61, ‐0.52]

3.2 Pollen immunotherapy

6

245

Std. Mean Difference (IV, Random, 95% CI)

‐0.69 [‐1.16, ‐0.21]

3.3 Other immunotherapy

1

121

Std. Mean Difference (IV, Random, 95% CI)

‐0.26 [‐0.62, 0.10]

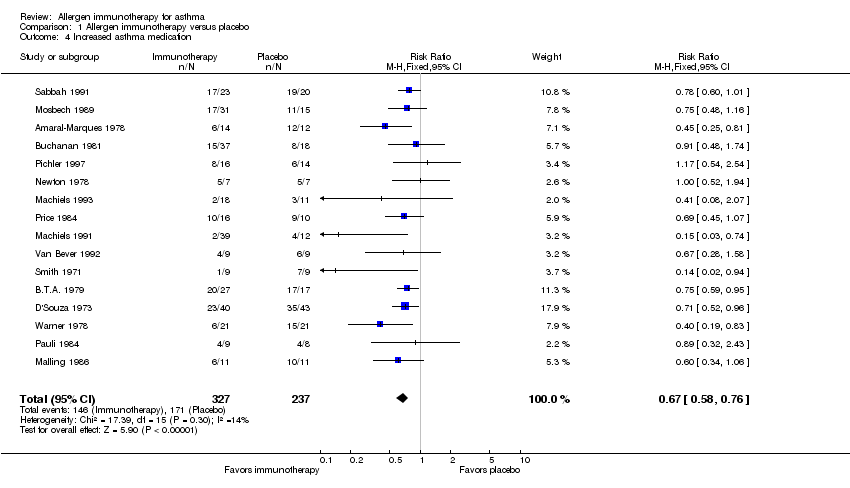
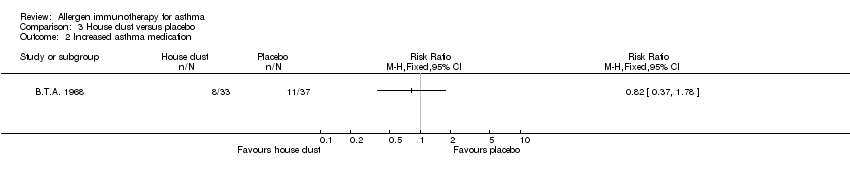
4 Increased asthma medication Show forest plot

16

564

Risk Ratio (M‐H, Fixed, 95% CI)

0.67 [0.58, 0.76]

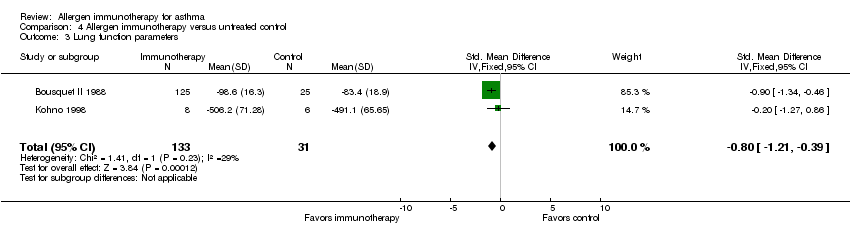
5 Lung function parameters Show forest plot

16

Std. Mean Difference (IV, Random, 95% CI)

Subtotals only

5.1 Peak Expiratory Flow

8

406

Std. Mean Difference (IV, Random, 95% CI)

0.04 [‐0.45, 0.53]

5.2 FEV1

6

174

Std. Mean Difference (IV, Random, 95% CI)

‐0.13 [‐0.83, 0.57]

5.3 Thoracic Gas Volume

2

81

Std. Mean Difference (IV, Random, 95% CI)

0.0 [0.0, 0.0]

6 Deterioration in lung function Show forest plot

7

253

Risk Ratio (M‐H, Random, 95% CI)

0.89 [0.73, 1.10]

7 Nonspecific BHR indices Show forest plot

15

471

Std. Mean Difference (IV, Random, 95% CI)

‐0.43 [‐0.71, ‐0.14]

7.1 LogPD20 Methacholine

9

348

Std. Mean Difference (IV, Random, 95% CI)

‐0.33 [‐0.66, ‐0.00]

7.2 LogPC20 Histamine

4

76

Std. Mean Difference (IV, Random, 95% CI)

‐0.55 [‐1.37, 0.28]

7.3 LogPC35 Acetylcholine

1

21

Std. Mean Difference (IV, Random, 95% CI)

‐1.29 [‐2.28, ‐0.31]

7.4 DeltaFEV1% Cold air

1

26

Std. Mean Difference (IV, Random, 95% CI)

‐0.52 [‐1.31, 0.26]

8 Increased nonspecific BHR Show forest plot

5

121

Risk Ratio (M‐H, Fixed, 95% CI)

0.48 [0.33, 0.72]

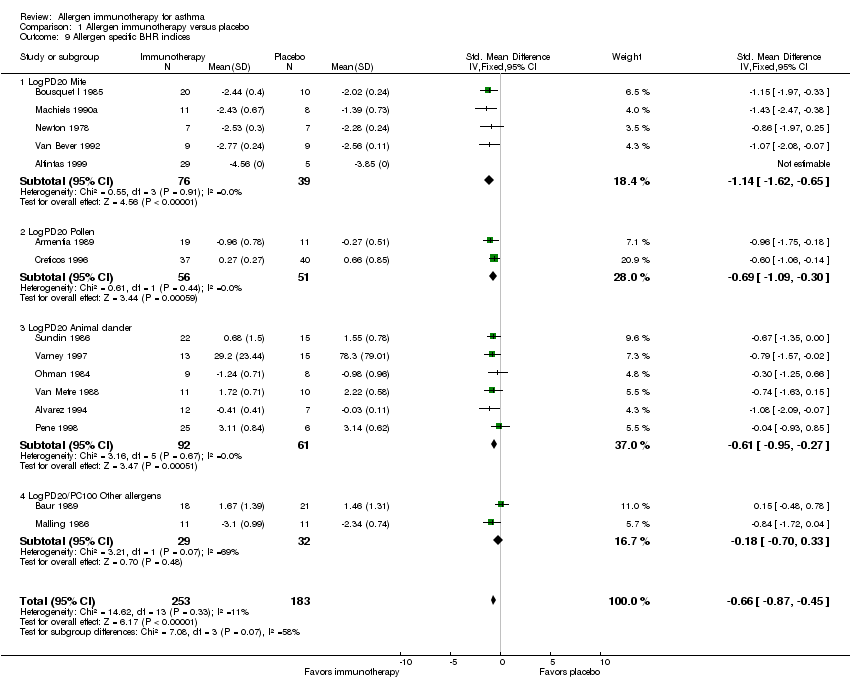
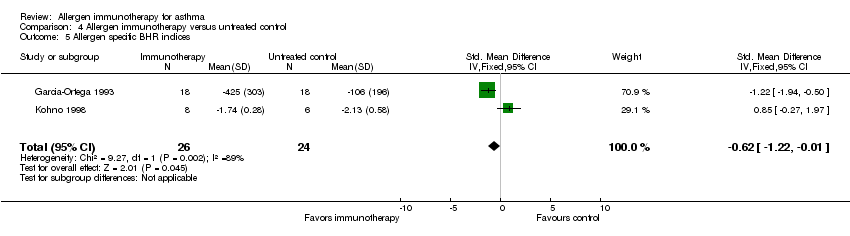
9 Allergen specific BHR indices Show forest plot

15

436

Std. Mean Difference (IV, Fixed, 95% CI)

‐0.66 [‐0.87, ‐0.45]

9.1 LogPD20 Mite

5

115

Std. Mean Difference (IV, Fixed, 95% CI)

‐1.14 [‐1.62, ‐0.65]

9.2 LogPD20 Pollen

2

107

Std. Mean Difference (IV, Fixed, 95% CI)

‐0.69 [‐1.09, ‐0.30]

9.3 LogPD20 Animal dander

6

153

Std. Mean Difference (IV, Fixed, 95% CI)

‐0.61 [‐0.95, ‐0.27]

9.4 LogPD20/PC100 Other allergens

2

61

Std. Mean Difference (IV, Fixed, 95% CI)

‐0.18 [‐0.70, 0.33]

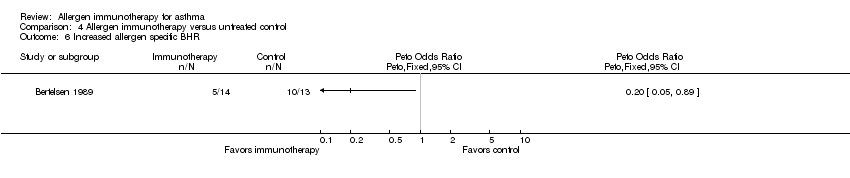
10 Increased allergen specific BHR Show forest plot

16

430

Risk Ratio (M‐H, Fixed, 95% CI)

0.51 [0.41, 0.63]

Figuras y tablas -
Comparison 1. Allergen immunotherapy versus placebo
Comparison 2. Allergen immunotherapy versus antigenically inactive control

Outcome or subgroup title

No. of studies

No. of participants

Statistical method

Effect size

1 Asthma symptom scores Show forest plot

1

Mean Difference (IV, Fixed, 95% CI)

Totals not selected

2 Symptomatic deterioration Show forest plot

1

Risk Ratio (M‐H, Fixed, 95% CI)

Totals not selected

3 Increased asthma medication Show forest plot

1

Risk Ratio (M‐H, Fixed, 95% CI)

Totals not selected

Figuras y tablas -
Comparison 2. Allergen immunotherapy versus antigenically inactive control
Comparison 3. House dust versus placebo

Outcome or subgroup title

No. of studies

No. of participants

Statistical method

Effect size

1 Symptomatic deterioration Show forest plot

3

162

Risk Ratio (M‐H, Fixed, 95% CI)

0.53 [0.21, 1.35]

2 Increased asthma medication Show forest plot

1

Risk Ratio (M‐H, Fixed, 95% CI)

Totals not selected

3 Deterioration in lung function Show forest plot

1

Risk Ratio (M‐H, Fixed, 95% CI)

Totals not selected

4 Increased allergen specific BHR Show forest plot

1

Risk Ratio (M‐H, Fixed, 95% CI)

Totals not selected

Figuras y tablas -
Comparison 3. House dust versus placebo
Comparison 4. Allergen immunotherapy versus untreated control

Outcome or subgroup title

No. of studies

No. of participants

Statistical method

Effect size

1 Asthma symptom scores Show forest plot

3

200

Std. Mean Difference (IV, Random, 95% CI)

‐1.84 [‐3.21, ‐0.47]

2 Asthma medication scores Show forest plot

1

Std. Mean Difference (IV, Fixed, 95% CI)

Totals not selected

3 Lung function parameters Show forest plot

2

164

Std. Mean Difference (IV, Fixed, 95% CI)

‐0.80 [‐1.21, ‐0.39]

4 Nonspecific BHR indices Show forest plot

1

Std. Mean Difference (IV, Fixed, 95% CI)

Totals not selected

5 Allergen specific BHR indices Show forest plot

2

50

Std. Mean Difference (IV, Fixed, 95% CI)

‐0.62 [‐1.22, ‐0.01]

6 Increased allergen specific BHR Show forest plot

1

Peto Odds Ratio (Peto, Fixed, 95% CI)

Totals not selected

Figuras y tablas -
Comparison 4. Allergen immunotherapy versus untreated control
Comparison 5. Allergen immunotherapy versus Inhaled steroid

Outcome or subgroup title

No. of studies

No. of participants

Statistical method

Effect size

1 Asthma symptom scores Show forest plot

1

Mean Difference (IV, Fixed, 95% CI)

Totals not selected

2 Deterioration in FEV1 Show forest plot

1

Mean Difference (IV, Fixed, 95% CI)

Totals not selected

Figuras y tablas -
Comparison 5. Allergen immunotherapy versus Inhaled steroid