Scolaris Content Display Scolaris Content Display

Methodological quality graph: review authors' judgements about each methodological quality item presented as percentages across all included studies.
Figuras y tablas -
Figure 1

Methodological quality graph: review authors' judgements about each methodological quality item presented as percentages across all included studies.

Methodological quality summary: review authors' judgements about each methodological quality item for each included study.
Figuras y tablas -
Figure 2

Methodological quality summary: review authors' judgements about each methodological quality item for each included study.

Study flow diagram
Figuras y tablas -
Figure 3

Study flow diagram

Comparison 1 High frequency US vs no US, Outcome 1 Proportion of ulcers completely healed at 3 weeks.
Figuras y tablas -
Analysis 1.1

Comparison 1 High frequency US vs no US, Outcome 1 Proportion of ulcers completely healed at 3 weeks.

Comparison 1 High frequency US vs no US, Outcome 2 Proportion of ulcers completely healed at 7 or 8 weeks.
Figuras y tablas -
Analysis 1.2

Comparison 1 High frequency US vs no US, Outcome 2 Proportion of ulcers completely healed at 7 or 8 weeks.

Comparison 1 High frequency US vs no US, Outcome 3 Proportion of ulcers completely healed at 12 weeks.
Figuras y tablas -
Analysis 1.3

Comparison 1 High frequency US vs no US, Outcome 3 Proportion of ulcers completely healed at 12 weeks.

Comparison 1 High frequency US vs no US, Outcome 4 Proportion of ulcers completely healed at 12 months (nurse‐reported data).
Figuras y tablas -
Analysis 1.4

Comparison 1 High frequency US vs no US, Outcome 4 Proportion of ulcers completely healed at 12 months (nurse‐reported data).

Comparison 1 High frequency US vs no US, Outcome 5 HRQoL: 12‐week SF‐12 Physical Component Score.
Figuras y tablas -
Analysis 1.5

Comparison 1 High frequency US vs no US, Outcome 5 HRQoL: 12‐week SF‐12 Physical Component Score.

Comparison 1 High frequency US vs no US, Outcome 6 HRQoL: 12‐week SF‐12 Mental Component Score.
Figuras y tablas -
Analysis 1.6

Comparison 1 High frequency US vs no US, Outcome 6 HRQoL: 12‐week SF‐12 Mental Component Score.

Comparison 1 High frequency US vs no US, Outcome 7 HRQoL: 12‐month SF‐12 Physical Component Score.
Figuras y tablas -
Analysis 1.7

Comparison 1 High frequency US vs no US, Outcome 7 HRQoL: 12‐month SF‐12 Physical Component Score.

Comparison 1 High frequency US vs no US, Outcome 8 HRQoL: 12‐month SF‐12 Mental Component Score.
Figuras y tablas -
Analysis 1.8

Comparison 1 High frequency US vs no US, Outcome 8 HRQoL: 12‐month SF‐12 Mental Component Score.

Comparison 1 High frequency US vs no US, Outcome 9 Non‐serious and serious adverse events.
Figuras y tablas -
Analysis 1.9

Comparison 1 High frequency US vs no US, Outcome 9 Non‐serious and serious adverse events.

Comparison 2 Low frequency US vs no US, Outcome 1 Proportion of ulcers completely healed at 8‐12 weeks.
Figuras y tablas -
Analysis 2.1

Comparison 2 Low frequency US vs no US, Outcome 1 Proportion of ulcers completely healed at 8‐12 weeks.

Summary of findings for the main comparison. High frequency ultrasound compared with no ultrasound for people with venous leg ulcers

High frequency ultrasound compared with no ultrasound for people with venous leg ulcers

Patient or population: people with venous leg ulcers
Setting: any
Intervention: high frequency ultrasound
Comparison: no ultrasound

Outcomes

Anticipated absolute effects* (95% CI)

Relative effect
(95% CI)

№ of participants
(studies)

Quality of the evidence
(GRADE)

Comments

Risk with no ultrasound

Risk with high frequency ultrasound

Proportion of ulcers completely healed at 3 weeks

Study population

RR 2.05
(0.24 to 17.23)

65
(1 RCT)

⊕⊝⊝⊝
VERY LOW 1,2,3,4

Highly uncertain whether high frequency ultrasound affects healing at 3 weeks.

45 per 1000

93 per 1000
(11 to 783)

Moderate

45 per 1000

92 per 1000
(11 to 775)

Proportion of ulcers completely healed at 7 or 8 weeks: losses to follow‐up regarded as unhealed

Study population

RR 1.21
(0.86 to 1.71)

678
(6 RCTs)

⊕⊕⊝⊝
LOW 5,6

Highly uncertain whether high frequency ultrasound affects healing at 7 to 8 weeks.

166 per 1000

198 per 1000
(143 to 284)

Moderate

218 per 1000

259 per 1000
(187 to 372)

Proportion of ulcers completely healed at 12 weeks: losses to follow‐up regarded as unhealed

Study population

RR 1.26
(0.92 to 1.73)

489
(3 RCTs)

⊕⊕⊕⊝
MODERATE 7

Uncertain whether high frequency ultrasound affects healing at 12 weeks.

202 per 1000

255 per 1000
(186 to 350)

Moderate

304 per 1000

383 per 1000
(279 to 525)

High10

500 per 1000

630 per 1000
(460 to 865)

Healing at 12 months (nurse‐reported data)

Study population

RR 0.93
(0.73 to 1.18)

337
(1 RCT)

⊕⊕⊝⊝
LOW 8,9

Uncertain whether high frequency ultrasound affects healing at 1 year.

462 per 1000

429 per 1000
(337 to 545)

Moderate

461 per 1000

429 per 1000
(337 to 545)

High11

800 per 1000

744 per 1000
(584 to 944)

Change in ulcer size at 4 or 7 weeks

Mean percentage change in ulcer area was reported in both studies. Data were insufficient to conduct a meta‐analysis. One study (4‐week follow‐up) found a difference in change in ulcer size between groups. The other study reported no clear difference.

165

(2 RCTs)

⊕⊝⊝⊝
VERY LOW

Highly uncertain whether high frequency ultrasound affects change in ulcer size at 4 or 7 weeks.

Non‐serious adverse events
Follow‐up: 12 months

Study population

RR 1.29
(1.02 to 1.64)

337
(1 RCT)

⊕⊕⊕⊝
MODERATE 2

The data refer to the number of people experiencing adverse events, rather than the number of adverse events.

172 per 1000

221 per 1000
(175 to 281)

Moderate

172 per 1000

222 per 1000
(175 to 282)

Serious adverse events
Follow‐up: 12 months

Study population

RR 1.21
(0.78 to 1.89)

337
(1 RCT)

⊕⊕⊕⊝
MODERATE 2

The data refer to the number of people experiencing adverse events, rather than the number of adverse events.

396 per 1000

480 per 1000
(309 to 749)

Moderate

396 per 1000

479 per 1000
(309 to 748)

HRQoL: 12‐week SF‐12 mean Physical/Mental Component Scores
scale from 0 to 100
Follow‐up: 12 weeks

Physical Component Score (PCS) mean (SD): 34.96 (11.39)

Mental Component Score (MCS) mean (SD): 46.83 (11.38)

PCS in the ultrasound group was 1.09 lower (3.75 lower to 1.57 higher)

MCS in the ultrasound group was 0.88 lower (3.62 lower to 1.86 higher)

See comment

285
(1 RCT)

⊕⊕⊕⊝
MODERATE 2

No clear differences in physical or mental HRQoL at 12 weeks

HRQoL: 12‐month SF‐12 Physical Component Score
Scale from: 0 to 100
Follow‐up: 12 months

PCS mean (SD): 35.57 (1.88)

MCS mean (SD): 45.41 (12.15)

PCS in ultrasound group was 0.96 lower (3.17 lower to 1.25 higher)

MCS in ultrasound group was 2.1 higher (0.97 lower to 5.17 higher)

See comment

229
(1 RCT)

⊕⊕⊕⊝
MODERATE 2

No clear differences in physical or mental HRQoL at 12 months

Cost

Follow‐up: 12 months

Addition of ultrasound treatment to standard care cost GBP 197.88 more per participant per year (95% bias‐corrected CI GBP ‐35.19 to GBP 420.32)

337
(1 RCT)

⊕⊕⊕⊝
MODERATE 2

No clear differences in cost at 12 months

*The risk in the intervention group (and its 95% confidence interval) is based on the assumed risk in the comparison group and the relative effect of the intervention (and its 95% CI).
CI: confidence interval; HRQoL: health‐related quality of life; RR: risk ratio; OIS: Optimal information size

GRADE Working Group grades of evidence
High quality: We are very confident that the true effect lies close to that of the estimate of the effect
Moderate quality: We are moderately confident in the effect estimate: The true effect is likely to be close to the estimate of the effect, but there is a possibility that it is substantially different
Low quality: Our confidence in the effect estimate is limited: The true effect may be substantially different from the estimate of the effect
Very low quality: We have very little confidence in the effect estimate: The true effect is likely to be substantially different from the estimate of effect

1 Downgraded due to risk of bias (two levels) ‐ at high or unclear risk of performance bias; the use of US was not the only difference in treatment between groups

2 Downgraded due to imprecision (one level) ‐ 95% CIs were very wide

3 Downgraded due to imprecision (one level) ‐ very short follow‐up time

4 Only 5 participants reached the endpoint (complete ulcer healing) and 4 of them were in the intervention group

5 Downgraded due to risk of bias (one level) ‐ most studies at high or unclear risk of bias

6 Downgraded due to imprecision (one level) ‐ 95% CIs were wide with only 122 participants reaching the endpoint

7 Downgraded due to imprecision (one level) ‐ only 111 participants across the three trials reached the endpoints and the OIS is hard to reach (Guyatt 2011)

8 Downgraded due to risk of bias (one level) since the outcome of healed wounds was based on nurse‐reported data

9 Downgraded due to imprecision estimate (one level) ‐ low event rate; OIS is hard to reach

10 High risk of healing at 12 weeks of 50% taken from a large, well conducted RCT where patients all received best practice care (Iglesias 2004). Moderate risk taken from median control group healing rate in these trials

11 With best practice (i.e. high compression bandaging), a baseline risk of healing at 12 months would be approximately 80% (Iglesias 2004)

Figuras y tablas -
Summary of findings for the main comparison. High frequency ultrasound compared with no ultrasound for people with venous leg ulcers
Summary of findings 2. Low frequency ultrasound compared with no ultrasound for people with venous leg ulcers

Low frequency ultrasound compared with no ultrasound for people with venous leg ulcers

Patient or population: venous leg ulcers
Setting: any
Intervention: low frequency ultrasound
Comparison: no ultrasound

Outcomes

Anticipated absolute effects* (95% CI)

Relative effect
(95% CI)

№ of participants
(studies)

Quality of the evidence
(GRADE)

Comments

Risk with no ultrasound

Risk with Low frequency US

Proportion of ulcers completely healed at 8 to 12 weeks

Study population

RR 3.91
(0.47 to 32.85)

61
(2 RCTs)

⊕⊝⊝⊝
VERY LOW 1, 2

There were no events in the control groups so we added 0.5 to the cell as a fixed value (as per Cochrane Handbook). Highly uncertain whether low frequency ultrasound affects healing at 8 to 12 weeks.

17 per 1000

65 per 1000
(8 to 548)

High3

300 per 1000

1000 per 1000
(141 to 1000)

Adverse events

No study reported adverse events

Pain was reported; however, this does not appear to have been measured systematically.

HRQoL

No study reported HRQoL

Cost

No study reported cost

*The risk in the intervention group (and its 95% confidence interval) is based on the assumed risk in the comparison group and the relative effect of the intervention (and its 95% CI).
CI: confidence interval; HRQoL: health‐related quality of life; RR: risk ratio; OIS: Optimal information size

GRADE Working Group grades of evidence
High quality: We are very confident that the true effect lies close to that of the estimate of the effect
Moderate quality: We are moderately confident in the effect estimate: The true effect is likely to be close to the estimate of the effect, but there is a possibility that it is substantially different
Low quality: Our confidence in the effect estimate is limited: The true effect may be substantially different from the estimate of the effect
Very low quality: We have very little confidence in the effect estimate: The true effect is likely to be substantially different from the estimate of effect

1 Downgraded due to risk of bias (one level) because both studies were at unclear or high risk

2 Downgraded due to imprecision (two levels): the OIS is hard to reach; very wide 95% CIs ‐ ranging in the ultrasound group from a 53% reduction of risk for ulcer healing to a 3285% increased risk (Guyatt 2011)

3 With best practice (i.e. high compression bandaging), a baseline risk of healing at 10 weeks (midpoint of 8 and 12 weeks) would be approximately 30% (Iglesias 2004)

Figuras y tablas -
Summary of findings 2. Low frequency ultrasound compared with no ultrasound for people with venous leg ulcers
Table 1. Data extraction table

Study

Intervention and Co‐interventions

Comparison intervention

Participants

Results

Callam 1987


5 physiotherapy departments


Scotland


NB 2 related abstracts say there were 110 participants


US group (n = 52):

DIRECT and HIGH FREQUENCY


*Lancet paper reports this frequency as 1 mHz. Verified with M Callam in Dec 09 that this should have read 1 MHz.

Standard treatment group (n = 56):

cleansing with 1% saline; application of Arachis oil to skin without massage; application of paste bandage (Calaband); application of support bandage (Lestreflex); advice on exercise.


Weekly treatment.

Included:  patients attending clinics for treatment of chronic leg ulcers

Excluded: non consent, allergy to standard treatment, PVD (lack of ankle pulses)

Ulcers completely healed by 12 wks:

US: 25/52 (48%)

C: 17/56 (30%)


Read from graph:

Ulcers completely healed at 8 wks:

US: 23/52 (45%)

C:  14/56 (25%)


Ulcers completely healed by 12 wks (complete case):

US: 25/41 (61%)

C:  17/41 (41%)


US treated healed sig more quickly by log rank ;=0.03. this effect persisted even when withdrawals due to pain and deterioration counted as failures.


Mean % ulcer unhealed at 12 weeks (no variance):

US: 9%

C: 27%

P<0.05


Withdrawals:

US: 11/52 (21%)

Allergy 4

Pain 4

DNA/refused 2

Death 2


C: 15/56 (27%)

Allergy 6

Pain 3

Refused/DNA 3

Deterioration 2

Arterial disease 1

Dolibog 2008


Poland


US group: 33 participants treated with US, compression (Sigvaris), and drug therapy.


INDIRECT and HIGH FREQUENCY

Standard care group (n = 37): compression and drug therapy.

Dressings changed daily for 7 weeks.

70 participants with venous leg ulcers who all had venous surgery, and diagnosed as having venous disease with Duplex scanning.


Excluded: diabetes, rheumatoid arthritis

Surgery included crossectomy, partial stripping of GSV or LSV, local phlebectomy, ligation of perforators.

Ulcers healed completely:

Group 1: 10/33

Group 2: 12/37


Mean area after therapy (SD)

Group 1: 13.15 (11.55)

Group 2: 13.12 (14.57)


Eriksson 1991


Hospital and primary care


Sweden

US group: 1.0 W/cm2 at 1 MHz. Enraf Nonius US machine with aquasonic gel. Ultrasound head was 2.8 cm diameter for superficial ulcers and 1.2 cm diameter for deep ulcers.  US applied to ulcer surface area and surrounding tissue for 10 minutes twice a week for 8 weeks.


DIRECT and HIGH FREQUENCY

Sham US group:

cleaned with saline; paste bandage, support bandage plus exercise advice (no further details provided).

Included; people with venous leg ulcers

Excluded: allergy to standard treatment, arterial disease, rheumatoid arthritis, diabetic ulcers, traumatic venous ulcer

Ulcers completely healed at 8 wks:

US: 6/19 (6/12 completers)

C: 4/19 (4/13 completers)


Cumulative % healed compared using life table methods.


% ulcers completely healed at different times (wks) US:C

2 wks: 8:0

4 wks: 17:8

6 wks: 25:15

8 wks: 41:30


% ulcer area healed at 8 wks (SD):

US: 42 (9)

C: 48 (13)


Withdrawals:

US: 7/19

C: 6/19


For allergy:

US: 3

C: 2


For pain:

US: 2

C: 1


Refusal/DNA:

US: 2

C: 3

Franek 2004


Poland


Hospital inpatients


US group 1: US at 1 W/cm2 (n = 22)

US group 2: US at 0.5 W/cm2 (n = 21)


Both groups received pulsed cycle of 1:5, frequency 1 MHz.


Cointerventions: saline soaked gauze. Single‐layer elastic compression (Hartmann).

INDIRECT and HIGH FREQUENCY

Pharmacotherapy group (n = 22): no US. Local baths of potassium permanganate and wet dressings of 0.1M copper sulphate solution plus compresses of fibrolan, chloramphenicol, colistin, gentamicin. Drugs alternated every few days. Single layer elastic compression (Hartmann). Treatment for 3 weeks. 


This was problematic as the use of US or not was not the only difference in treatment between the groups i.e. performance bias.  Also US groups 1 and 2 were hospitalised in  the Dermatology Clinic of Katowice and Group C in the Dermatology Dept of Zabrze.


Included: people with venous ulcers (signs of venous disease) and ABPI > 1.0. Excluded: people with diabetes, advanced sclerosis


Mean (median) area after treatment (cm2):

A: 14 (11.14) p = 0.0001

B: 9.29 (3.78) p = 0.00006

C: 20.58 (9.86) p = 0.002


Complete ulcer healing by 3 weeks:

A: 1/22

B: 3/21

C: 1/22


Franek 2006

Poland

Hospital inpatients

Electrostimulation group: once a day, 50 minutes each session, 6 consecutive days, 4 weeks total (2 weeks cathodic and 2 weeks anodic stimulation), NaCl 0.9% locally (no further details provided)

Laser therapy group: 65 mW once a day, 5 consecutive days, duration of each session depending of ulceration area – device was set up to develop 4J/cm2 on average power 65 mW, various pharmacological agents locally, 4 weeks total

US group: 0.5 W/cm2 – once a day, duration of each session depending on ulceration area: 5 cm2 received 5 minutes, plus 1 minute more for each 1 cm2 of additional ulcer area, 4 weeks total, 0.9% NaCl locally

Compression therapy provided for all groups. Bandages were removed every time for purposes of physical therapy and then put back on.

Compression + pharmacological agents group: 4 weeks total

People with venous leg ulcers

Mean % change in ulcer area (relative to baseline) at 4 weeks:

Group 1: ‐55.26%; Group 2: ‐35.97%; Group 3: ‐63.42%;

Group 4: ‐30.77%

P(Group 3 & Group 4) = 0.007

Lundeberg 1990


Sweden


US. group (n = 22):

US: pulsed 1:9

0.5 W/cm2 at 1 MHz

US applied to ulcer surface and surrounding tissue for 10 minutes; probe applied for 1 minute per probe head area (no further details provided). Treated 3 x per week for 4 weeks, then 2 x per week for 4 weeks, then once a week for 4 weeks.

Plus standard care, which comprised of

cleansing with saline; paste bandage; support bandage; exercise instructions.


DIRECT and HIGH FREQUENCY

Sham US (no further details provided) + standard treatment group

(n = 22): standard care consisted of

cleansing with saline; paste bandage; support bandage; exercise instructions.

Patients with VLUs referred from depts. of internal medicine, surgery, primary health care.


Exclusion: skin allergy, PVD, RA, DM, traumatic venous ulcer.


Cumulative % (n) healed at 8 weeks:

US: 30% (5)

C: 20% (3)


Cumulative % (n) healed at 12 weeks:

US: 59% (10)

C: 52% (8)


Mean % ulcer area remaining at 8 weeks (SD) in patients completing:

US: 47% (8)

C: 53% (10)


Mean % ulcer area remaining at 12 weeks (SD) in patients completing:

US: 39% (5)

C: 43% (6)


12/44 patients withdrew (7 placebo group, 5 US group).


Placebo: 3 allergy, 1 pain, 3 DNA/refused.


US: 2 allergy, 1 pain, 2 DNA/refused

Peschen 1997


Germany


Outpatient clinic

US group (n = 12):

US treatment involved placing legs in footbath of water at 32 °C‐34 °C filled to 10 cm above the ulcer. US sound head transducer immersed in bath and placed in line with ulcer 5 cm away. The continuous US  was given for 10 minutes at 30 kHz, 0.1 W/cm2 3 x per week.

Standard care was also given.

This comprised HCL dressings (Coloplast); compression therapy using “strong‐quality elastic compression bandages (Beiersdorf)”


INDIRECT and LOW FREQUENCY

Sham US group (n = 12): sham US plus standard care


Sham procedure involved placing legs in footbath of water at 32 °C‐34 °C filled to 10 cm above the ulcer. US sound head transducer immersed in bath and placed in line with ulcer 5 cm away. Sham US for 10 minutes 3 x per week.

Standard care consisted of

HCL dressings (Coloplast); compression therapy using “strong‐quality elastic compression bandages (Beiersdorf)”

24 people attending outpatients clinic.

Included: people with chronic VLUs at least 2 cm2 and 3 months’ duration. Clinical diagnosis of VLU confirmed by history, Doppler US, light reflection rheography, ABPI of 0.8 or above.

Excluded: arterial disease, liver, cardiac or renal insufficiency, heamorrhagic gastroduodenitis, colitis, leukaemia, diabetes, RA, treatment allergy.


Complete ulcer healing at 12 weeks:

US: 2/12

C: 0/12 (or 0/10 completers)


Mean % decrease in ulcer area 12 weeks:

US: 55.4%

C: 16.5%

No variance data

p<0.007


Micro‐bleeding around the ulcer:

US: 5

C: 0


Pain:

US: 3/12

C: 4/10 pain free


Irritation:

US: 8/12

C: 0


8 US patients felt tingling sensation during US.


After 12 wk treatment phase, standard care continued.


At 3 months post treatment:

Mean ulcer area:

US: 30.6%

C: 70.2%


Mean change ulcer radius (mm)

US: 9.9mm (n = 12)

C: 5.3mm (n = 10)

(P<0.012)


Taradaj 2007

Poland

US group (n = 24): sonotherapy with sonicator 730 device, in water bath, 1 MHZ, 0.5 W/cm2, duration dependent on area of ulceration ‐ e.g. 5 min for ≦ 5 cm2), 6 days/week for 7 weeks plus pharmacotherapy

All participants used moist normal saline dressing, and pharmacotherapy (diosmin 450 mg and hesperidin 50 mg combined as proprietary preparation (Detralex)

All patients: treatment duration 7 weeks.

Compression group (n = 25): compression plus stocking and pharmacotherapy

Standard care group (n = 24): pharmacotherapy

People with venous ulcers who had undergone venous surgery by modified Babcock method.

Mean % change in ulcer area (relative to baseline) at 7 weeks:

Group 1: ‐53.6%; Group 2: ‐69.4%; Group 3: ‐62.6% (P > 0.05 for all 3 comparisons between groups).

Mean ± SD ulcer area in cm2 at 7 weeks (NB: comparisons are within group vs baseline):

Group 1: 14.1 ± 11.7 (P = 0.00002);

Group 2: 8.8 ± 10.0 (P = 0.00001);

Group 3: 11.4 ± 14.1 (P = 0.00002).

Taradaj 2008


Poland

Surgery + US group (n = 21): surgery plus US, compression stockings (Sigvaris, 30 mmHg‐40 mmHg at ankle), drug therapy


No surgery + US group: US, compression and drug therapy


Drug therapy was flavonoid (450 mg diosmin, 50 mg hesperidin), 2 tabs (one of each) twice daily.


Ulcers covered by saline soaks. Dressings changed once day only in clinic.


Ultrasound; 0.5 W/cm2 pulsed; impulse 2 mS, interval 8 mS. Frequency 1 MHz. Performed in a bath of water with temp 34 °C. probe head 10 cm2 placed 2 cm above ulcer. An ulcer of 5 cm2 or less had 5 minutes treatment, with 1 minute more for each 1 cm2 by which the ulcer exceeded this size.  If larger than 20 cm2 the ulcer was divided in 2. Treatment daily for 6 days/week for 7 weeks. 


INDIRECT and HIGH FREQUENCY

Surgery ‐ US group (n = 20): surgery plus compression and drug therapy


No surgery ‐ US group (n = 20): compression and drug therapy


Drug therapy was flavonoid (450 mg diosmin, 50 mg hesperidin), 2 tabs (one of each) twice daily.

Ulcers covered by saline soaks. Dressings changed once day only in clinic.

People with venous disease assessed by symptoms and Duplex scanning. All offered venous surgery. Those refusing surgery were randomised to US or no US.


Group 1 vs. Group 2

Group 3 vs. Group 4


Numbers completely healed at 7 weeks:

Group 1: 6/21

Group 2: 6/20


Group 3: 6/20

Group 4: 3/20


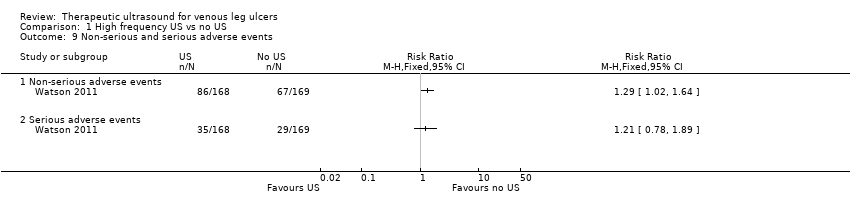
Watson 2011


UK

Community nurse services, community leg ulcer clinics, and hospital outpatient leg ulcer clinics

US group (n = 168): low‐dose (0.5 W/cm2) US, 1 MHz, with a pulsed pattern of 1:4, applied for 5 to 10 minutes to periulcer skin,

weekly for up to 12 weeks, plus standard care, then standard care alone.

 DIRECT and HIGH FREQUENCY


Standard care group (n = 169): simple low‐adherent dressing and high compression (4‐layer bandage), reduced compression or no compression depending on participant tolerance.


337 patients with hard‐to‐heal venous leg ulcers i.e., ulcer of 6 months’ duration or more and/or area greater than 5 cm2. Considered a venous ulcer if no other obvious causative factor and ulcer appeared clinically venous (moist, shallow, irregular shape, venous eczema, ankle oedema, lipodermatosclerosis, ulcer not confined to the foot).  Participants had to have ABPI of 0.8 or greater. Excluded if poorly controlled diabetes, ankle prostheses, thrombophlebitis, active infection including cellulitis, local or metastatic cancer.


Hazard ratio* for US vs. SC 0.99 (0.70 to 1.40), p = 0.969 (NSD).

* the analysis adjusted for centre as a random effect, ulcer area (from baseline tracing), ulcer duration and whether or not the patient was treated with high‐compression bandaging.

Median time (for all ulcers) to complete healing:

US:  365 days (95% CI 224, inestimable)

SC: 328 days (95% CI 235, inestimable) P = 0.9051, log rank.


Ulcers completely healed/not healed (%) at 8 wks (personal communication):

US: 9/168

SC: 15/169


Ulcers completely healed/not healed (%)  at 12 wks (personal communication):

US: 26/168

SC: 25/169

Ulcers completely healed/not healed (%) at 12 month (personal communication):

US: 72/168

SC: 78/169

HRQoL by SF‐12:

Mean Baseline PCS (SD):

US:  36.55 (11.32); n = 160

SC:  35.33 (11.47); n = 167


3 month PCS (SD):

US:33.87 (11.49); n = 143

SC: 34.96 (11.39); n = 142


12 month PCS (SD):

US:34.61 (12.09); n = 118

SC: 35.57 (11.39); n = 111

Baseline MCS (SD):

US: 46.72 (11.52); n = 160

SC:  47.11 (11.29); n = 167


3 month MCS (SD):

US:  45.95 (12.22); n = 143

SC:  46.83 (11.38); n = 142


12 month MCS (SD):

US: 47.51 (11.54); n = 118

SC: 45.41 (12.15); n = 111

Serious

Adverse Events (SAEs):

US: 35/168 patients

SC: 29/169 patients

Non serious AEs:
US: 86/168 patients

SC: 67/169 patients

NS using random effects negative binomial regression (p = 0.3904).


Using random effects negative binomial regression showed that significantly more non serious AEs in US group (p = 0.0411).


For all adverse events in random effects binomial regression, there was a significant effect of treatment (p = 0.0446).

Adjusted annual costs (

95% bias‐corrected CI):

US arm 1583.39 (1427.51 to 1728.70) vs. SC arm 1385.51 (1223.84 to 1549.21

Weichenthal 1997


Outpatient clinic


Germany

US group: 'experimental' 30 kHz US applicator mounted to footbath. Transducer positioned within 5 cm of ulcer surface. Surface subjected to 30 kHz US at 0.1 W/cm2 for 10 minutes, plus standard care.


INDIRECT and LOW FREQUENCY

Conventional therapy group:

topical fibrinolytic agents, antibiotics or other antiseptics and occlusive dressings. Eczema of surrounding skin could be treated with topical steroids. Compression with elastic bandages. Dressings changed at least 3 x per week.


Participants received foot bathing but participants in US group did not.

Inclusion: presence of ulceration for min. 3 mo. plus evidence of venous incompetence.

Excluded: diabetes, arterial disease.

Mean ulcer area at 3 weeks (SD):

US: 8.3 (6.4)

C: 14.7 (10.4)


Mean ulcer area at 8 weeks (SD):

US: 6.2 (5.9)

C: 13.4 (12.1)


Ulcers completely healed at 8 weeks:

US: 1/19

C: 0/19 (0/18 completers)


US: no/minor complaints about pain with US.

Mild to mod erythema often observed with US.

Figuras y tablas -
Table 1. Data extraction table
Comparison 1. High frequency US vs no US

Outcome or subgroup title

No. of studies

No. of participants

Statistical method

Effect size

1 Proportion of ulcers completely healed at 3 weeks Show forest plot

1

Risk Ratio (M‐H, Fixed, 95% CI)

Totals not selected

2 Proportion of ulcers completely healed at 7 or 8 weeks Show forest plot

6

Risk Ratio (M‐H, Random, 95% CI)

Subtotals only

2.1 Losses as unhealed

6

678

Risk Ratio (M‐H, Random, 95% CI)

1.21 [0.86, 1.71]

2.2 Complete case analysis

6

627

Risk Ratio (M‐H, Random, 95% CI)

1.21 [0.88, 1.67]

3 Proportion of ulcers completely healed at 12 weeks Show forest plot

3

Risk Ratio (M‐H, Fixed, 95% CI)

Subtotals only

3.1 Losses as unhealed

3

489

Risk Ratio (M‐H, Fixed, 95% CI)

1.26 [0.92, 1.73]

3.2 Complete case analysis

3

451

Risk Ratio (M‐H, Fixed, 95% CI)

1.20 [0.89, 1.62]

4 Proportion of ulcers completely healed at 12 months (nurse‐reported data) Show forest plot

1

Risk Ratio (M‐H, Fixed, 95% CI)

Totals not selected

5 HRQoL: 12‐week SF‐12 Physical Component Score Show forest plot

1

Mean Difference (IV, Fixed, 95% CI)

Totals not selected

6 HRQoL: 12‐week SF‐12 Mental Component Score Show forest plot

1

Mean Difference (IV, Fixed, 95% CI)

Totals not selected

7 HRQoL: 12‐month SF‐12 Physical Component Score Show forest plot

1

Mean Difference (IV, Fixed, 95% CI)

Totals not selected

8 HRQoL: 12‐month SF‐12 Mental Component Score Show forest plot

1

Mean Difference (IV, Fixed, 95% CI)

Totals not selected

9 Non‐serious and serious adverse events Show forest plot

1

Risk Ratio (M‐H, Fixed, 95% CI)

Totals not selected

9.1 Non‐serious adverse events

1

Risk Ratio (M‐H, Fixed, 95% CI)

0.0 [0.0, 0.0]

9.2 Serious adverse events

1

Risk Ratio (M‐H, Fixed, 95% CI)

0.0 [0.0, 0.0]

Figuras y tablas -
Comparison 1. High frequency US vs no US
Comparison 2. Low frequency US vs no US

Outcome or subgroup title

No. of studies

No. of participants

Statistical method

Effect size

1 Proportion of ulcers completely healed at 8‐12 weeks Show forest plot

2

61

Risk Ratio (M‐H, Fixed, 95% CI)

3.91 [0.47, 32.85]

Figuras y tablas -
Comparison 2. Low frequency US vs no US