بررسی تاثیر استفاده زودهنگام (< 7 روز) از کورتیکواستروئیدهای سیستمیک پس از زایمان برای پیشگیری از بروز دیسپلازی برونکوپولمونری در نوزادان نارس
Información
- DOI:
- https://doi.org/10.1002/14651858.CD001146.pub6Copiar DOI

- Base de datos:
-
- Cochrane Database of Systematic Reviews
- Versión publicada:
-
- 21 octubre 2021see what's new
- Tipo:
-
- Intervention
- Etapa:
-
- Review
- Grupo Editorial Cochrane:
-
Grupo Cochrane de Neonatología
- Copyright:
-
- Copyright © 2022 The Cochrane Collaboration. Published by John Wiley & Sons, Ltd.
Cifras del artículo
Altmetric:
Citado por:
Autores
Contributions of authors
Lex Doyle collated data on long‐term neurosensory outcomes. For earlier reviews, he assisted Henry Halliday, Richard Ehrenkranz, and Jeanie Cheong in identifying relevant studies, synthesising data, and writing some of the earlier versions of the review. He identified new studies for the current review.
Jeanie Cheong identified studies for the previous version of the review and has assisted in identifying studies in the most recent literature search, synthesising data, and writing the current version of this review.
Susanne Hay has assisted in identifying studies in the most recent literature search, double‐checking and synthesising data, and writing the current version of this review.
Brett Manley has assisted in identifying studies in the most recent literature search, double‐checking and synthesising data, and writing the current version of this review.
Henry Halliday identified all studies, synthesised data, wrote earlier versions of this review, and has assisted in identifying studies in the most recent literature search, interpreting data, and writing the current version of this review.
Sources of support
Internal sources
-
Action Research UK, UK
Grant to study effects of postnatal steroids
-
Action Research UK, UK
Grant to study long‐term follow‐up
External sources
-
National Health and Medical Research Council, Australia
Various project grants and Centre for Research Excellence (1153176)
-
Vermont Oxford Network, USA
Cochrane Neonatal Reviews are produced with support from Vermont Oxford Network, a worldwide collaboration of health professionals dedicated to providing evidence‐based care of the highest quality for newborn infants and their families
Declarations of interest
Jeanie Cheong received a Career Development Fellowship, for salary support, from the Australian Medical Research Future Fund.
Lex Doyle's institution received grant funding from the National Health and Medical Research Council (NHMRC) of Australia.
Henry Halliday declared no conflicts of interest.
Susanne Hay was the PI on a network meta‐analysis of systemic corticosteroids for bronchopulmonary dysplasia, for which her institution received a grant from the Deborah Munroe Noonan Memorial Research Fund. She works as a neonatologist at Beth Israel Deaconess Medical Center.
Brett Manley's institution received funding for a Career Development Fellowship from the Australian Medical Research Future Fund. His institution also received project grant funding from the NHMRC of Australia. He has published articles and review articles on the topic of postnatal steroids in peer‐reviewed journals, and has commented on social media. He works as a Consultant Neonatologist at The Royal Women's Hospital, Parkville, Victoria, Australia.
Acknowledgements
We acknowledge the contribution of Richard Ehrenkranz (deceased) to earlier versions of this review.
We would like to thank Cochrane Neonatal: Colleen Ovelman, (former) Managing Editor; Jane Cracknell, Managing Editor; Michelle Fiander, Information Specialist; Roger Soll, Co‐coordinating Editor; and Bill McGuire, Co‐coordinating Editor; who provided editorial and administrative support.
Carol Friesen, (former) Information Specialist, designed and ran literature searches for the 2020 update, and Colleen Ovelman peer‐reviewed the OVID MEDLINE search strategy.
Sarah Hodgkinson, Bob Boyle, Roger Soll, and Vibhuti Shah peer‐reviewed and offered feedback on this updated review.
Version history
| Published | Title | Stage | Authors | Version |
| 2021 Oct 21 | Early (< 7 days) systemic postnatal corticosteroids for prevention of bronchopulmonary dysplasia in preterm infants | Review | Lex W Doyle, Jeanie L Cheong, Susanne Hay, Brett J Manley, Henry L Halliday, Roger Soll | |
| 2017 Oct 24 | Early (< 8 days) systemic postnatal corticosteroids for prevention of bronchopulmonary dysplasia in preterm infants | Review | Lex W Doyle, Jeanie L Cheong, Richard A Ehrenkranz, Henry L Halliday | |
| 2014 May 13 | Early (< 8 days) postnatal corticosteroids for preventing chronic lung disease in preterm infants | Review | Lex W Doyle, Richard A Ehrenkranz, Henry L Halliday | |
| 2010 Jan 20 | Early (< 8 days) postnatal corticosteroids for preventing chronic lung disease in preterm infants | Review | Henry L Halliday, Richard A Ehrenkranz, Lex W Doyle | |
| 2009 Jan 21 | Early (< 8 days) postnatal corticosteroids for preventing chronic lung disease in preterm infants | Review | Henry L Halliday, Richard A Ehrenkranz, Lex W Doyle | |
| 2003 Jan 20 | Early postnatal (<96 hours) corticosteroids for preventing chronic lung disease in preterm infants | Review | Henry L Halliday, Richard A Ehrenkranz, L W Doyle, LEX W DOYLE | |
Differences between protocol and review
-
We added the methods and plan for 'Summary of findings' tables and GRADE recommendations, which were not included in the original protocol (Halliday 2000), nor in earlier versions of this review (Doyle 2014a; Halliday 2003; Halliday 2009; Halliday 2010). For the 2017 update (Doyle 2017a), we changed the title to "Early (< 8 days) systemic postnatal corticosteroids for prevention of bronchopulmonary dysplasia in preterm infants". For the 2021 update, we changed the title further to "Early (< 7 days) systemic postnatal corticosteroids for prevention of bronchopulmonary dysplasia in preterm infants"; because two trials started treatment with systemic corticosteroids on Day 7 after birth, they were included in the "late" review
-
As of July 2019, Cochrane Neonatal no longer searches Embase for its reviews. RCTs and controlled clinical trials (CCTs) from Embase are added to the Cochrane Central Register of Controlled Trials (CENTRAL), in the Cochrane Library, via a robust process (see How CENTRAL is created). Cochrane Neonatal has validated its searches to ensure that relevant Embase records are found while searching CENTRAL (Ovelman 2020).
-
Also starting in July 2019, Cochrane Neonatal no longer searches for RCTs and CCTs on the following platforms: ClinicalTrials.gov or World Health Organization’s International Clinical Trials Registry Platform (ICTRP), as records from both platforms are added to CENTRAL on a monthly basis (see How CENTRAL is created). Comprehensive search strategies are executed in CENTRAL to retrieve relevant records. The ISRCTN Registry (at www.isrctn.com/; formerly Controlled‐trials.com) is searched separately
-
Starting in September 2020, Cochrane Neonatal no longer searches for RCTs and quasi‐RCTs from the Cumulative Index to Nursing and Allied Health Literature (CINAHL), as records are identified and added to CENTRAL on a monthly basis through Cochrane's Centralised Search Service project (see How CENTRAL is created at https://www.cochranelibrary.com/central/central-creation#CINAHL%20section)
-
For the 2020 update, we ran searches in the following databases: CENTRAL via CRS Web and MEDLINE via OVID. Search strategies are available in Appendix 1. Previous search methods are available in Appendix 2 and Appendix 3
-
Because the indication for early hydrocortisone treatment might be primarily to treat lung problems or low blood pressure, we performed for the 2021 review a sensitivity analysis by indication for hydrocortisone for major outcomes of mortality at latest age, BPD at 36 weeks, and mortality or BPD at 36 weeks
Keywords
MeSH
Medical Subject Headings (MeSH) Keywords
Medical Subject Headings Check Words
Humans; Infant; Infant, Newborn;
PICO
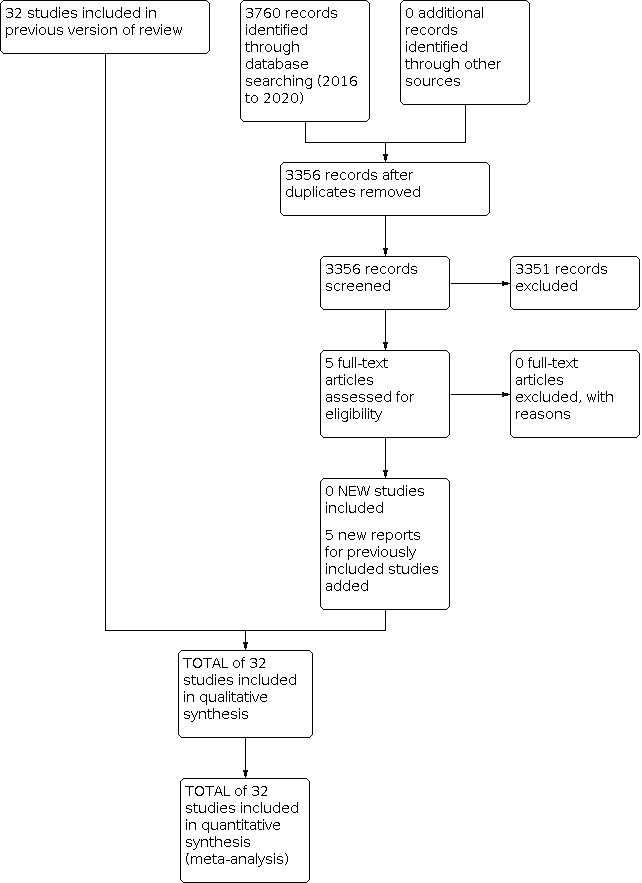
Study flow diagram: review update.

Risk of bias table.

Risk of bias summary: review authors' judgements about each risk of bias item for each included study.

Funnel plot of comparison: 1 Mortality, outcome: 1.4 Mortality at latest reported age.

Funnel plot of comparison: 2 Bronchopulmonary dysplasia (BPD), outcome: 2.2 BPD (36 weeks' postmenstrual age).

Funnel plot of comparison: 3 Death or bronchopulmonary dysplasia (BPD), outcome: 3.2 Death or BPD at 36 weeks' postmenstrual age.

Funnel plot of comparison: 5 Complications during primary hospitalisation, outcome: 5.15 Gastrointestinal perforation.

Funnel plot of comparison: 6 Long‐term follow‐up, outcome: 6.11 Cerebral palsy.

Funnel plot of comparison: 6 Long‐term follow‐up, outcome: 6.13 Death or cerebral palsy.

Comparison 1: Mortality at different ages, Outcome 1: Neonatal mortality (up to 28 days)

Comparison 1: Mortality at different ages, Outcome 2: Mortality at 36 weeks

Comparison 1: Mortality at different ages, Outcome 3: Mortality to hospital discharge

Comparison 1: Mortality at different ages, Outcome 4: Mortality at latest reported age

Comparison 2: Bronchopulmonary dysplasia (BPD) at different ages, Outcome 1: BPD (28 days of life)

Comparison 2: Bronchopulmonary dysplasia (BPD) at different ages, Outcome 2: BPD (36 weeks' postmenstrual age)

Comparison 2: Bronchopulmonary dysplasia (BPD) at different ages, Outcome 3: BPD at 36 weeks' postmenstrual age in survivors to 36 weeks

Comparison 2: Bronchopulmonary dysplasia (BPD) at different ages, Outcome 4: Late rescue with corticosteroids

Comparison 2: Bronchopulmonary dysplasia (BPD) at different ages, Outcome 5: Survivors who had late rescue with corticosteroids

Comparison 2: Bronchopulmonary dysplasia (BPD) at different ages, Outcome 6: Survivors discharged home on oxygen

Comparison 3: Mortality or bronchopulmonary dysplasia (BPD) at different ages, Outcome 1: Death or BPD at 28 days of life

Comparison 3: Mortality or bronchopulmonary dysplasia (BPD) at different ages, Outcome 2: Death or BPD at 36 weeks' postmenstrual age

Comparison 4: Failure to extubate at different ages, Outcome 1: Failure to extubate by third day

Comparison 4: Failure to extubate at different ages, Outcome 2: Failure to extubate by seventh day

Comparison 4: Failure to extubate at different ages, Outcome 3: Failure to extubate by 14th day

Comparison 4: Failure to extubate at different ages, Outcome 4: Failure to extubate by 28th day

Comparison 5: Complications during primary hospitalisation, Outcome 1: Infection

Comparison 5: Complications during primary hospitalisation, Outcome 2: Hyperglycaemia

Comparison 5: Complications during primary hospitalisation, Outcome 3: Hypertension

Comparison 5: Complications during primary hospitalisation, Outcome 4: Hypertrophic cardiomyopathy

Comparison 5: Complications during primary hospitalisation, Outcome 5: Growth failure

Comparison 5: Complications during primary hospitalisation, Outcome 6: Pulmonary air leak

Comparison 5: Complications during primary hospitalisation, Outcome 7: Patent ductus arteriosus (PDA)

Comparison 5: Complications during primary hospitalisation, Outcome 8: Severe IVH

Comparison 5: Complications during primary hospitalisation, Outcome 9: Severe intraventricular haemorrhage (IVH) in infants examined

Comparison 5: Complications during primary hospitalisation, Outcome 10: Periventricular leukomalacia (PVL)

Comparison 5: Complications during primary hospitalisation, Outcome 11: PVL in infants with cranial ultrasound scans

Comparison 5: Complications during primary hospitalisation, Outcome 12: PVL in survivors seen at follow‐up

Comparison 5: Complications during primary hospitalisation, Outcome 13: Necrotising enterocolitis (NEC)

Comparison 5: Complications during primary hospitalisation, Outcome 14: Gastrointestinal bleeding

Comparison 5: Complications during primary hospitalisation, Outcome 15: Gastrointestinal perforation

Comparison 5: Complications during primary hospitalisation, Outcome 16: Pulmonary haemorrhage

Comparison 5: Complications during primary hospitalisation, Outcome 17: Any retinopathy of prematurity (ROP)

Comparison 5: Complications during primary hospitalisation, Outcome 18: Severe ROP

Comparison 5: Complications during primary hospitalisation, Outcome 19: Severe ROP in survivors

Comparison 6: Long‐term follow‐up into later childhood, Outcome 1: Bayley Mental Developmental Index (MDI) < ‐2 SD

Comparison 6: Long‐term follow‐up into later childhood, Outcome 2: Bayley MDI < ‐2 SD in tested survivors

Comparison 6: Long‐term follow‐up into later childhood, Outcome 3: Bayley Psychomotor Developmental Index (PDI) < ‐2 SD

Comparison 6: Long‐term follow‐up into later childhood, Outcome 4: Bayley PDI < ‐2 SD in tested survivors

Comparison 6: Long‐term follow‐up into later childhood, Outcome 5: Developmental delay (other criteria)

Comparison 6: Long‐term follow‐up into later childhood, Outcome 6: Developmental delay (other criteria) in tested survivors

Comparison 6: Long‐term follow‐up into later childhood, Outcome 7: Blindness

Comparison 6: Long‐term follow‐up into later childhood, Outcome 8: Blindness in survivors assessed

Comparison 6: Long‐term follow‐up into later childhood, Outcome 9: Deafness

Comparison 6: Long‐term follow‐up into later childhood, Outcome 10: Deafness in survivors assessed

Comparison 6: Long‐term follow‐up into later childhood, Outcome 11: Cerebral palsy

Comparison 6: Long‐term follow‐up into later childhood, Outcome 12: Death before follow‐up in trials assessing cerebral palsy

Comparison 6: Long‐term follow‐up into later childhood, Outcome 13: Death or cerebral palsy

Comparison 6: Long‐term follow‐up into later childhood, Outcome 14: Cerebral palsy in survivors assessed

Comparison 6: Long‐term follow‐up into later childhood, Outcome 15: Major neurosensory disability (variable criteria ‐ see individual studies)

Comparison 6: Long‐term follow‐up into later childhood, Outcome 16: Death before follow‐up in trials assessing major neurosensory disability (variable criteria)

Comparison 6: Long‐term follow‐up into later childhood, Outcome 17: Death or major neurosensory disability (variable criteria)

Comparison 6: Long‐term follow‐up into later childhood, Outcome 18: Major neurosensory disability in survivors examined (variable criteria)

Comparison 6: Long‐term follow‐up into later childhood, Outcome 19: Abnormal neurological exam (variable criteria ‐ see individual studies)

Comparison 6: Long‐term follow‐up into later childhood, Outcome 20: Death before follow‐up in trials assessing abnormal neurological exam (variable criteria)

Comparison 6: Long‐term follow‐up into later childhood, Outcome 21: Death or abnormal neurological exam (variable criteria)

Comparison 6: Long‐term follow‐up into later childhood, Outcome 22: Abnormal neurological exam in tested survivors (variable criteria)

Comparison 6: Long‐term follow‐up into later childhood, Outcome 23: Intellectual impairment (IQ < 70)

Comparison 6: Long‐term follow‐up into later childhood, Outcome 24: Intellectual impairment (IQ < 70) in survivors assessed

Comparison 6: Long‐term follow‐up into later childhood, Outcome 25: "Major neurosensory impairment" ‐ blindness or deafness

Comparison 6: Long‐term follow‐up into later childhood, Outcome 26: "Major neurosensory impairment" ‐ blindness or deafness ‐ in survivors assessed

Comparison 6: Long‐term follow‐up into later childhood, Outcome 27: Behaviour abnormalities

Comparison 6: Long‐term follow‐up into later childhood, Outcome 28: Behaviour abnormalities in 3‐year‐old survivors assessed

Comparison 6: Long‐term follow‐up into later childhood, Outcome 29: Abnormal EEG

Comparison 6: Long‐term follow‐up into later childhood, Outcome 30: Abnormal EEG in tested survivors

Comparison 6: Long‐term follow‐up into later childhood, Outcome 31: Re‐hospitalisation in infancy

Comparison 6: Long‐term follow‐up into later childhood, Outcome 32: Re‐hospitalisation in infancy in survivors

Comparison 7: Sensitivity analyses by indication for hydrocortisone, Outcome 1: Mortality to latest age

Comparison 7: Sensitivity analyses by indication for hydrocortisone, Outcome 2: Bronchopulmonary dysplasia at 36 weeks

Comparison 7: Sensitivity analyses by indication for hydrocortisone, Outcome 3: Mortality or bronchopulmonary dysplasia at 36 weeks
| Early systemic postnatal corticosteroids (dexamethasone and hydrocortisone) compared with placebo or no treatment for preventing bronchopulmonary dysplasia in preterm infants | ||||||
| Patient or population: preventing bronchopulmonary dysplasia in preterm infants | ||||||
| Outcomes | Anticipated absolute effects* (95% CI) | Relative effect | No. of participants | Certainty of the evidence | Comments | |
|---|---|---|---|---|---|---|
| Risk with placebo or no treatment | Risk with early systemic postnatal corticosteroids | |||||
| Mortality at latest reported age
| Study population (studies treating with dexamethasone or hydrocortisone) | RR 0.95 | 4373 | ⊕⊕⊕⊕ | critical P = 0.05 for subgroup differences | |
| 232 per 1000 | 221 per 1000 | |||||
| Study population (subgroup of studies treating with dexamethasone) | RR 1.02 | 2940 | ⊕⊕⊕⊕ | critical | ||
| 236 per 1000 | 241 per 1000 (212 to 274) | |||||
| Study population (subgroup of studies treating with hydrocortisone) | RR 0.80 | 1433 | ⊕⊕⊕⊕ | critical | ||
| 225 per 1000 | 180 per 1000 | |||||
| BPD (36 weeks' PMA)
| Study population (studies treating with dexamethasone or hydrocortisone) | RR 0.80 | 4167 | ⊕⊕⊕⊝ | important P = 0.01 for subgroup differences | |
| 308 per 1000 | 247 per 1000 | |||||
| Study population (subgroup of studies treating with dexamethasone) | RR 0.72 | 2791 | ⊕⊕⊕⊕ | important | ||
| 269 per 1000 | 194 per 1000 | |||||
| Study population (subgroup of studies treating with hydrocortisone) | RR 0.92 | 1376 | ⊕⊕⊕⊕ | important | ||
| 385 per 1000 | 354 per 1000 | |||||
| Mortality or BPD at 36 weeks' PMA
| Study population (studies treating with dexamethasone or hydrocortisone) | RR 0.89 | 4167 | ⊕⊕⊕⊕ | critical | |
| 515 per 1000 | 458 per 1000 | |||||
| Study population (subgroup of studies treating with dexamethasone) | RR 0.88 | 2791 | ⊕⊕⊕⊕ | critical | ||
| 487 per 1000 | 429 per 1000 | |||||
| Study population (subgroup of studies treating with hydrocortisone) | RR 0.90 | 1376 | ⊕⊕⊕⊕ | critical | ||
| 569 per 1000 | 512 per 1000 | |||||
| Gastrointestinal perforation during primary hospitalisation
| Study population (studies treating with dexamethasone or hydrocortisone) | RR 1.84 | 3040 | ⊕⊕⊕⊕ | important | |
| 39 per 1000 | 71 per 1000 | |||||
| Study population (subgroup of studies treating with dexamethasone) | RR 1.73 | 1936 | ⊕⊕⊕⊕ | important | ||
| 41 per 1000 | 71 per 1000 | |||||
| Study population (subgroup of infants treated with hydrocortisone | RR 2.05 | 1104 | ⊕⊕⊕⊕ | important | ||
| 34 per 1000 | 70 per 1000 | |||||
| Cerebral palsy at latest reported age
| Study population (studies treating with dexamethasone or hydrocortisone) | RR 1.42 | 1973 | ⊕⊕⊕⊕ | critical P = 0.09 for subgroup differences | |
| 74 per 1000 | 106 per 1000 | |||||
| Study population (subgroup of studies treating with dexamethasone) | RR 1.77 | 921 | ⊕⊕⊕⊕ | critical | ||
| 89 per 1000 | 158 per 1000 | |||||
| Study population (subgroup of studies treating with hydrocortisone) | RR 1.05 | 1052 | ⊕⊕⊕⊕ | critical | ||
| 62 per 1000 | 65 per 1000 | |||||
| Mortality or cerebral palsy at latest reported age
| Study population (studies treating with dexamethasone or hydrocortisone) | RR 1.03 | 1973 | ⊕⊕⊕⊕ | critical P = 0.02 for subgroup differences | |
| 335 per 1000 | 345 per 1000 | |||||
| Study population (subgroup of studies treating with dexamethasone) | RR 1.18 | 921 | ⊕⊕⊕⊕ | critical
| ||
| 383 per 1000 | 452 per 1000 | |||||
| Study population (subgroup of studies treating with hydrocortisone) | RR 0.86 | 1052 | ⊕⊕⊕⊕ | critical | ||
| 295 per 1000 | 254 per 1000 | |||||
| *The risk in the intervention group (and its 95% confidence interval) is based on assumed risk in the comparison group and the relative effect of the intervention (and its 95% CI). | ||||||
| GRADE Working Group grades of evidence. High certainty: further research is very unlikely to change our confidence in the estimate of effect. Moderate certainty: further research is likely to have an important impact on our confidence in the estimate of effect and may change the estimate. Low certainty: further research is very likely to have an important impact on our confidence in the estimate of effect and is likely to change the estimate. Very low certainty: we are very uncertain about the estimate. | ||||||
| aDowngraded one level for serious study limitations owing to evidence of publication bias for studies overall, but not within subgroups. | ||||||
| Outcome or subgroup title | No. of studies | No. of participants | Statistical method | Effect size |
| 1.1 Neonatal mortality (up to 28 days) Show forest plot | 20 | 2933 | Risk Ratio (M‐H, Fixed, 95% CI) | 1.01 [0.87, 1.18] |
| 1.1.1 Dexamethasone | 16 | 2576 | Risk Ratio (M‐H, Fixed, 95% CI) | 1.05 [0.90, 1.23] |
| 1.1.2 Hydrocortisone | 4 | 357 | Risk Ratio (M‐H, Fixed, 95% CI) | 0.77 [0.49, 1.21] |
| 1.2 Mortality at 36 weeks Show forest plot | 27 | 4176 | Risk Ratio (M‐H, Fixed, 95% CI) | 1.01 [0.90, 1.13] |
| 1.2.1 Dexamethasone | 17 | 2791 | Risk Ratio (M‐H, Fixed, 95% CI) | 1.08 [0.94, 1.23] |
| 1.2.2 Hydrocortisone | 10 | 1385 | Risk Ratio (M‐H, Fixed, 95% CI) | 0.85 [0.67, 1.06] |
| 1.3 Mortality to hospital discharge Show forest plot | 29 | 4164 | Risk Ratio (M‐H, Fixed, 95% CI) | 0.96 [0.85, 1.07] |
| 1.3.1 Dexamethasone | 18 | 2731 | Risk Ratio (M‐H, Fixed, 95% CI) | 1.03 [0.90, 1.19] |
| 1.3.2 Hydrocortisone | 11 | 1433 | Risk Ratio (M‐H, Fixed, 95% CI) | 0.80 [0.65, 0.99] |
| 1.4 Mortality at latest reported age Show forest plot | 31 | 4373 | Risk Ratio (M‐H, Fixed, 95% CI) | 0.95 [0.85, 1.06] |
| 1.4.1 Dexamethasone | 20 | 2940 | Risk Ratio (M‐H, Fixed, 95% CI) | 1.02 [0.90, 1.16] |
| 1.4.2 Hydrocortisone | 11 | 1433 | Risk Ratio (M‐H, Fixed, 95% CI) | 0.80 [0.65, 0.99] |
| Outcome or subgroup title | No. of studies | No. of participants | Statistical method | Effect size |
| 2.1 BPD (28 days of life) Show forest plot | 15 | 2580 | Risk Ratio (M‐H, Fixed, 95% CI) | 0.86 [0.80, 0.93] |
| 2.1.1 Dexamethasone | 14 | 2327 | Risk Ratio (M‐H, Fixed, 95% CI) | 0.84 [0.78, 0.91] |
| 2.1.2 Hydrocortisone | 1 | 253 | Risk Ratio (M‐H, Fixed, 95% CI) | 1.00 [0.85, 1.18] |
| 2.2 BPD (36 weeks' postmenstrual age) Show forest plot | 26 | 4167 | Risk Ratio (M‐H, Fixed, 95% CI) | 0.80 [0.73, 0.88] |
| 2.2.1 Dexamethasone | 17 | 2791 | Risk Ratio (M‐H, Fixed, 95% CI) | 0.72 [0.63, 0.82] |
| 2.2.2 Hydrocortisone | 9 | 1376 | Risk Ratio (M‐H, Fixed, 95% CI) | 0.92 [0.81, 1.06] |
| 2.3 BPD at 36 weeks' postmenstrual age in survivors to 36 weeks Show forest plot | 24 | 3093 | Risk Ratio (M‐H, Fixed, 95% CI) | 0.79 [0.72, 0.87] |
| 2.3.1 Dexamethasone | 15 | 1948 | Risk Ratio (M‐H, Fixed, 95% CI) | 0.72 [0.63, 0.82] |
| 2.3.2 Hydrocortisone | 9 | 1145 | Risk Ratio (M‐H, Fixed, 95% CI) | 0.89 [0.78, 1.02] |
| 2.4 Late rescue with corticosteroids Show forest plot | 15 | 3004 | Risk Ratio (M‐H, Fixed, 95% CI) | 0.79 [0.73, 0.86] |
| 2.4.1 Dexamethasone | 10 | 1974 | Risk Ratio (M‐H, Fixed, 95% CI) | 0.72 [0.65, 0.80] |
| 2.4.2 Hydrocortisone | 5 | 1030 | Risk Ratio (M‐H, Fixed, 95% CI) | 0.94 [0.81, 1.09] |
| 2.5 Survivors who had late rescue with corticosteroids Show forest plot | 7 | 895 | Risk Ratio (M‐H, Fixed, 95% CI) | 0.77 [0.67, 0.89] |
| 2.5.1 Dexamethasone | 6 | 853 | Risk Ratio (M‐H, Fixed, 95% CI) | 0.79 [0.68, 0.91] |
| 2.5.2 Hydrocortisone | 1 | 42 | Risk Ratio (M‐H, Fixed, 95% CI) | 0.48 [0.24, 0.98] |
| 2.6 Survivors discharged home on oxygen Show forest plot | 9 | 1442 | Risk Ratio (M‐H, Fixed, 95% CI) | 0.86 [0.70, 1.07] |
| 2.6.1 Dexamethasone | 3 | 406 | Risk Ratio (M‐H, Fixed, 95% CI) | 0.78 [0.48, 1.26] |
| 2.6.2 Hydrocortisone | 6 | 1036 | Risk Ratio (M‐H, Fixed, 95% CI) | 0.89 [0.70, 1.13] |
| Outcome or subgroup title | No. of studies | No. of participants | Statistical method | Effect size |
| 3.1 Death or BPD at 28 days of life Show forest plot | 14 | 2471 | Risk Ratio (M‐H, Fixed, 95% CI) | 0.92 [0.87, 0.96] |
| 3.1.1 Dexamethasone | 13 | 2218 | Risk Ratio (M‐H, Fixed, 95% CI) | 0.90 [0.86, 0.95] |
| 3.1.2 Hydrocortisone | 1 | 253 | Risk Ratio (M‐H, Fixed, 95% CI) | 1.00 [0.90, 1.12] |
| 3.2 Death or BPD at 36 weeks' postmenstrual age Show forest plot | 26 | 4167 | Risk Ratio (M‐H, Fixed, 95% CI) | 0.89 [0.83, 0.94] |
| 3.2.1 Dexamethasone | 17 | 2791 | Risk Ratio (M‐H, Fixed, 95% CI) | 0.88 [0.81, 0.95] |
| 3.2.2 Hydrocortisone | 9 | 1376 | Risk Ratio (M‐H, Fixed, 95% CI) | 0.90 [0.82, 0.99] |
| Outcome or subgroup title | No. of studies | No. of participants | Statistical method | Effect size |
| 4.1 Failure to extubate by third day Show forest plot | 4 | 887 | Risk Ratio (M‐H, Fixed, 95% CI) | 0.85 [0.75, 0.95] |
| 4.1.1 Dexamethasone | 3 | 381 | Risk Ratio (M‐H, Fixed, 95% CI) | 0.73 [0.62, 0.86] |
| 4.1.2 Hydrocortisone | 1 | 506 | Risk Ratio (M‐H, Fixed, 95% CI) | 0.96 [0.82, 1.14] |
| 4.2 Failure to extubate by seventh day Show forest plot | 8 | 1448 | Risk Ratio (M‐H, Fixed, 95% CI) | 0.76 [0.68, 0.85] |
| 4.2.1 Dexamethasone | 6 | 703 | Risk Ratio (M‐H, Fixed, 95% CI) | 0.71 [0.61, 0.84] |
| 4.2.2 Hydrocortisone | 2 | 745 | Risk Ratio (M‐H, Fixed, 95% CI) | 0.80 [0.69, 0.94] |
| 4.3 Failure to extubate by 14th day Show forest plot | 4 | 443 | Risk Ratio (M‐H, Fixed, 95% CI) | 0.77 [0.62, 0.97] |
| 4.4 Failure to extubate by 28th day Show forest plot | 7 | 902 | Risk Ratio (M‐H, Fixed, 95% CI) | 0.84 [0.72, 0.98] |
| Outcome or subgroup title | No. of studies | No. of participants | Statistical method | Effect size |
| 5.1 Infection Show forest plot | 25 | 4101 | Risk Ratio (M‐H, Fixed, 95% CI) | 1.05 [0.96, 1.15] |
| 5.1.1 Dexamethasone | 18 | 2821 | Risk Ratio (M‐H, Fixed, 95% CI) | 1.02 [0.91, 1.15] |
| 5.1.2 Hydrocortisone | 7 | 1280 | Risk Ratio (M‐H, Fixed, 95% CI) | 1.08 [0.94, 1.25] |
| 5.2 Hyperglycaemia Show forest plot | 14 | 2688 | Risk Ratio (M‐H, Fixed, 95% CI) | 1.26 [1.15, 1.37] |
| 5.2.1 Dexamethasone | 12 | 2117 | Risk Ratio (M‐H, Fixed, 95% CI) | 1.35 [1.21, 1.49] |
| 5.2.2 Hydrocortisone | 2 | 571 | Risk Ratio (M‐H, Fixed, 95% CI) | 1.01 [0.84, 1.22] |
| 5.3 Hypertension Show forest plot | 11 | 1993 | Risk Ratio (M‐H, Fixed, 95% CI) | 1.85 [1.54, 2.22] |
| 5.3.1 Dexamethasone | 10 | 1943 | Risk Ratio (M‐H, Fixed, 95% CI) | 1.84 [1.53, 2.21] |
| 5.3.2 Hydrocortisone | 1 | 50 | Risk Ratio (M‐H, Fixed, 95% CI) | 3.00 [0.33, 26.92] |
| 5.4 Hypertrophic cardiomyopathy Show forest plot | 1 | 50 | Risk Ratio (M‐H, Fixed, 95% CI) | 4.33 [1.40, 13.37] |
| 5.5 Growth failure Show forest plot | 1 | 50 | Risk Ratio (M‐H, Fixed, 95% CI) | 6.67 [2.27, 19.62] |
| 5.6 Pulmonary air leak Show forest plot | 17 | 3276 | Risk Ratio (M‐H, Fixed, 95% CI) | 0.90 [0.73, 1.11] |
| 5.6.1 Dexamethasone | 12 | 2041 | Risk Ratio (M‐H, Fixed, 95% CI) | 0.85 [0.66, 1.08] |
| 5.6.2 Hydrocortisone | 5 | 1235 | Risk Ratio (M‐H, Fixed, 95% CI) | 1.06 [0.72, 1.56] |
| 5.7 Patent ductus arteriosus (PDA) Show forest plot | 24 | 4013 | Risk Ratio (M‐H, Fixed, 95% CI) | 0.78 [0.72, 0.85] |
| 5.7.1 Dexamethasone | 17 | 2706 | Risk Ratio (M‐H, Fixed, 95% CI) | 0.76 [0.69, 0.84] |
| 5.7.2 Hydrocortisone | 7 | 1307 | Risk Ratio (M‐H, Fixed, 95% CI) | 0.82 [0.71, 0.95] |
| 5.8 Severe IVH Show forest plot | 26 | 4103 | Risk Ratio (M‐H, Fixed, 95% CI) | 0.97 [0.84, 1.12] |
| 5.8.1 Dexamethasone | 17 | 2736 | Risk Ratio (M‐H, Fixed, 95% CI) | 0.96 [0.81, 1.14] |
| 5.8.2 Hydrocortisone | 9 | 1367 | Risk Ratio (M‐H, Fixed, 95% CI) | 0.98 [0.76, 1.27] |
| 5.9 Severe intraventricular haemorrhage (IVH) in infants examined Show forest plot | 8 | 1964 | Risk Ratio (M‐H, Fixed, 95% CI) | 0.92 [0.75, 1.12] |
| 5.9.1 Dexamethasone | 4 | 994 | Risk Ratio (M‐H, Fixed, 95% CI) | 0.78 [0.59, 1.03] |
| 5.9.2 Hydrocortisone | 4 | 970 | Risk Ratio (M‐H, Fixed, 95% CI) | 1.11 [0.82, 1.49] |
| 5.10 Periventricular leukomalacia (PVL) Show forest plot | 15 | 2807 | Risk Ratio (M‐H, Fixed, 95% CI) | 1.12 [0.83, 1.53] |
| 5.10.1 Dexamethasone | 8 | 1514 | Risk Ratio (M‐H, Fixed, 95% CI) | 1.23 [0.84, 1.81] |
| 5.10.2 Hydrocortisone | 7 | 1293 | Risk Ratio (M‐H, Fixed, 95% CI) | 0.96 [0.58, 1.59] |
| 5.11 PVL in infants with cranial ultrasound scans Show forest plot | 7 | 1841 | Risk Ratio (M‐H, Fixed, 95% CI) | 1.13 [0.79, 1.60] |
| 5.12 PVL in survivors seen at follow‐up Show forest plot | 2 | 183 | Risk Ratio (M‐H, Fixed, 95% CI) | 1.22 [0.60, 2.48] |
| 5.13 Necrotising enterocolitis (NEC) Show forest plot | 25 | 4050 | Risk Ratio (M‐H, Fixed, 95% CI) | 0.90 [0.74, 1.11] |
| 5.13.1 Dexamethasone | 15 | 2661 | Risk Ratio (M‐H, Fixed, 95% CI) | 0.88 [0.69, 1.13] |
| 5.13.2 Hydrocortisone | 10 | 1389 | Risk Ratio (M‐H, Fixed, 95% CI) | 0.95 [0.66, 1.37] |
| 5.14 Gastrointestinal bleeding Show forest plot | 12 | 1816 | Risk Ratio (M‐H, Fixed, 95% CI) | 1.86 [1.35, 2.55] |
| 5.14.1 Dexamethasone | 10 | 1725 | Risk Ratio (M‐H, Fixed, 95% CI) | 1.87 [1.35, 2.58] |
| 5.14.2 Hydrocortisone | 2 | 91 | Risk Ratio (M‐H, Fixed, 95% CI) | 1.53 [0.27, 8.74] |
| 5.15 Gastrointestinal perforation Show forest plot | 16 | 3040 | Risk Ratio (M‐H, Fixed, 95% CI) | 1.84 [1.36, 2.49] |
| 5.15.1 Dexamethasone | 9 | 1936 | Risk Ratio (M‐H, Fixed, 95% CI) | 1.73 [1.20, 2.51] |
| 5.15.2 Hydrocortisone | 7 | 1104 | Risk Ratio (M‐H, Fixed, 95% CI) | 2.05 [1.21, 3.47] |
| 5.16 Pulmonary haemorrhage Show forest plot | 10 | 1820 | Risk Ratio (M‐H, Fixed, 95% CI) | 1.16 [0.87, 1.54] |
| 5.16.1 Dexamethasone | 7 | 686 | Risk Ratio (M‐H, Fixed, 95% CI) | 0.97 [0.65, 1.45] |
| 5.16.2 Hydrocortisone | 3 | 1134 | Risk Ratio (M‐H, Fixed, 95% CI) | 1.36 [0.92, 2.03] |
| 5.17 Any retinopathy of prematurity (ROP) Show forest plot | 9 | 1345 | Risk Ratio (M‐H, Fixed, 95% CI) | 0.88 [0.80, 0.97] |
| 5.17.1 Dexamethasone | 8 | 1042 | Risk Ratio (M‐H, Fixed, 95% CI) | 0.84 [0.72, 0.99] |
| 5.17.2 Hydrocortisone | 1 | 303 | Risk Ratio (M‐H, Fixed, 95% CI) | 0.93 [0.84, 1.04] |
| 5.18 Severe ROP Show forest plot | 14 | 2577 | Risk Ratio (M‐H, Fixed, 95% CI) | 0.81 [0.67, 0.99] |
| 5.18.1 Dexamethasone | 8 | 1507 | Risk Ratio (M‐H, Fixed, 95% CI) | 0.77 [0.60, 0.99] |
| 5.18.2 Hydrocortisone | 6 | 1070 | Risk Ratio (M‐H, Fixed, 95% CI) | 0.89 [0.65, 1.23] |
| 5.19 Severe ROP in survivors Show forest plot | 12 | 1575 | Risk Ratio (M‐H, Fixed, 95% CI) | 0.77 [0.64, 0.94] |
| 5.19.1 Dexamethasone | 10 | 1238 | Risk Ratio (M‐H, Fixed, 95% CI) | 0.75 [0.59, 0.95] |
| 5.19.2 Hydrocortisone | 2 | 337 | Risk Ratio (M‐H, Fixed, 95% CI) | 0.83 [0.60, 1.17] |
| Outcome or subgroup title | No. of studies | No. of participants | Statistical method | Effect size |
| 6.1 Bayley Mental Developmental Index (MDI) < ‐2 SD Show forest plot | 3 | 842 | Risk Ratio (M‐H, Fixed, 95% CI) | 1.00 [0.78, 1.29] |
| 6.2 Bayley MDI < ‐2 SD in tested survivors Show forest plot | 3 | 528 | Risk Ratio (M‐H, Fixed, 95% CI) | 1.00 [0.79, 1.25] |
| 6.3 Bayley Psychomotor Developmental Index (PDI) < ‐2 SD Show forest plot | 3 | 842 | Risk Ratio (M‐H, Fixed, 95% CI) | 1.17 [0.85, 1.60] |
| 6.4 Bayley PDI < ‐2 SD in tested survivors Show forest plot | 3 | 528 | Risk Ratio (M‐H, Fixed, 95% CI) | 1.17 [0.87, 1.57] |
| 6.5 Developmental delay (other criteria) Show forest plot | 2 | 769 | Risk Ratio (M‐H, Fixed, 95% CI) | 1.37 [0.93, 2.03] |
| 6.5.1 Dexamethasone | 1 | 248 | Risk Ratio (M‐H, Fixed, 95% CI) | 1.68 [1.08, 2.61] |
| 6.5.2 Hydrocortisone | 1 | 521 | Risk Ratio (M‐H, Fixed, 95% CI) | 0.66 [0.26, 1.69] |
| 6.6 Developmental delay (other criteria) in tested survivors Show forest plot | 2 | 538 | Risk Ratio (M‐H, Fixed, 95% CI) | 1.50 [1.05, 2.15] |
| 6.6.1 Dexamethasone | 1 | 159 | Risk Ratio (M‐H, Fixed, 95% CI) | 1.94 [1.30, 2.88] |
| 6.6.2 Hydrocortisone | 1 | 379 | Risk Ratio (M‐H, Fixed, 95% CI) | 0.61 [0.24, 1.53] |
| 6.7 Blindness Show forest plot | 9 | 1318 | Risk Ratio (M‐H, Fixed, 95% CI) | 2.01 [0.74, 5.50] |
| 6.7.1 Dexamethasone | 6 | 862 | Risk Ratio (M‐H, Fixed, 95% CI) | 2.01 [0.74, 5.50] |
| 6.7.2 Hydrocortisone | 3 | 456 | Risk Ratio (M‐H, Fixed, 95% CI) | Not estimable |
| 6.8 Blindness in survivors assessed Show forest plot | 9 | 964 | Risk Ratio (M‐H, Fixed, 95% CI) | 2.16 [0.80, 5.86] |
| 6.8.1 Dexamethasone | 6 | 532 | Risk Ratio (M‐H, Fixed, 95% CI) | 2.16 [0.80, 5.86] |
| 6.8.2 Hydrocortisone | 3 | 432 | Risk Ratio (M‐H, Fixed, 95% CI) | Not estimable |
| 6.9 Deafness Show forest plot | 9 | 1100 | Risk Ratio (M‐H, Fixed, 95% CI) | 1.14 [0.39, 3.37] |
| 6.9.1 Dexamethasone | 5 | 600 | Risk Ratio (M‐H, Fixed, 95% CI) | 0.97 [0.30, 3.14] |
| 6.9.2 Hydrocortisone | 4 | 500 | Risk Ratio (M‐H, Fixed, 95% CI) | 3.12 [0.13, 73.06] |
| 6.10 Deafness in survivors assessed Show forest plot | 8 | 476 | Risk Ratio (M‐H, Fixed, 95% CI) | 1.14 [0.40, 3.29] |
| 6.11 Cerebral palsy Show forest plot | 13 | 1973 | Risk Ratio (IV, Fixed, 95% CI) | 1.43 [1.07, 1.92] |
| 6.11.1 Dexamethasone | 7 | 921 | Risk Ratio (IV, Fixed, 95% CI) | 1.77 [1.21, 2.58] |
| 6.11.2 Hydrocortisone | 6 | 1052 | Risk Ratio (IV, Fixed, 95% CI) | 1.05 [0.66, 1.66] |
| 6.12 Death before follow‐up in trials assessing cerebral palsy Show forest plot | 13 | 1973 | Risk Ratio (M‐H, Fixed, 95% CI) | 0.90 [0.78, 1.05] |
| 6.12.1 Dexamethasone | 7 | 921 | Risk Ratio (M‐H, Fixed, 95% CI) | 0.99 [0.81, 1.21] |
| 6.12.2 Hydrocortisone | 6 | 1052 | Risk Ratio (M‐H, Fixed, 95% CI) | 0.81 [0.64, 1.02] |
| 6.13 Death or cerebral palsy Show forest plot | 13 | 1973 | Risk Ratio (M‐H, Fixed, 95% CI) | 1.03 [0.91, 1.16] |
| 6.13.1 Dexamethasone | 7 | 921 | Risk Ratio (M‐H, Fixed, 95% CI) | 1.18 [1.01, 1.37] |
| 6.13.2 Hydrocortisone | 6 | 1052 | Risk Ratio (M‐H, Fixed, 95% CI) | 0.86 [0.71, 1.05] |
| 6.14 Cerebral palsy in survivors assessed Show forest plot | 13 | 1329 | Risk Ratio (M‐H, Fixed, 95% CI) | 1.47 [1.12, 1.92] |
| 6.14.1 Dexamethasone | 7 | 587 | Risk Ratio (M‐H, Fixed, 95% CI) | 1.85 [1.31, 2.61] |
| 6.14.2 Hydrocortisone | 6 | 742 | Risk Ratio (M‐H, Fixed, 95% CI) | 1.01 [0.65, 1.58] |
| 6.15 Major neurosensory disability (variable criteria ‐ see individual studies) Show forest plot | 7 | 1703 | Risk Ratio (M‐H, Fixed, 95% CI) | 1.08 [0.89, 1.33] |
| 6.15.1 Dexamethasone | 4 | 772 | Risk Ratio (M‐H, Fixed, 95% CI) | 1.37 [1.03, 1.83] |
| 6.15.2 Hydrocortisone | 3 | 931 | Risk Ratio (M‐H, Fixed, 95% CI) | 0.86 [0.64, 1.14] |
| 6.16 Death before follow‐up in trials assessing major neurosensory disability (variable criteria) Show forest plot | 8 | 1754 | Risk Ratio (M‐H, Fixed, 95% CI) | 0.91 [0.77, 1.06] |
| 6.16.1 Dexamethasone | 4 | 772 | Risk Ratio (M‐H, Fixed, 95% CI) | 1.02 [0.82, 1.25] |
| 6.16.2 Hydrocortisone | 4 | 982 | Risk Ratio (M‐H, Fixed, 95% CI) | 0.79 [0.62, 1.01] |
| 6.17 Death or major neurosensory disability (variable criteria) Show forest plot | 7 | 1703 | Risk Ratio (M‐H, Fixed, 95% CI) | 0.97 [0.87, 1.08] |
| 6.17.1 Dexamethasone | 4 | 772 | Risk Ratio (M‐H, Fixed, 95% CI) | 1.13 [0.99, 1.30] |
| 6.17.2 Hydrocortisone | 3 | 931 | Risk Ratio (M‐H, Fixed, 95% CI) | 0.82 [0.69, 0.97] |
| 6.18 Major neurosensory disability in survivors examined (variable criteria) Show forest plot | 8 | 1178 | Risk Ratio (M‐H, Fixed, 95% CI) | 1.07 [0.89, 1.28] |
| 6.18.1 Dexamethasone | 4 | 469 | Risk Ratio (M‐H, Fixed, 95% CI) | 1.36 [1.05, 1.77] |
| 6.18.2 Hydrocortisone | 4 | 709 | Risk Ratio (M‐H, Fixed, 95% CI) | 0.84 [0.65, 1.10] |
| 6.19 Abnormal neurological exam (variable criteria ‐ see individual studies) Show forest plot | 5 | 829 | Risk Ratio (M‐H, Fixed, 95% CI) | 1.81 [1.33, 2.47] |
| 6.20 Death before follow‐up in trials assessing abnormal neurological exam (variable criteria) Show forest plot | 6 | 1350 | Risk Ratio (M‐H, Fixed, 95% CI) | 0.89 [0.75, 1.07] |
| 6.20.1 Dexamethasone | 5 | 829 | Risk Ratio (M‐H, Fixed, 95% CI) | 0.97 [0.79, 1.21] |
| 6.20.2 Hydrocortisone | 1 | 521 | Risk Ratio (M‐H, Fixed, 95% CI) | 0.75 [0.54, 1.04] |
| 6.21 Death or abnormal neurological exam (variable criteria) Show forest plot | 5 | 829 | Risk Ratio (M‐H, Fixed, 95% CI) | 1.23 [1.06, 1.42] |
| 6.22 Abnormal neurological exam in tested survivors (variable criteria) Show forest plot | 5 | 508 | Risk Ratio (M‐H, Fixed, 95% CI) | 1.89 [1.41, 2.52] |
| 6.23 Intellectual impairment (IQ < 70) Show forest plot | 3 | 125 | Risk Ratio (M‐H, Fixed, 95% CI) | 1.46 [0.64, 3.33] |
| 6.23.1 Dexamethasone | 2 | 90 | Risk Ratio (M‐H, Fixed, 95% CI) | 1.37 [0.57, 3.31] |
| 6.23.2 Hydrocortisone | 1 | 35 | Risk Ratio (M‐H, Fixed, 95% CI) | 2.12 [0.21, 21.27] |
| 6.24 Intellectual impairment (IQ < 70) in survivors assessed Show forest plot | 2 | 76 | Risk Ratio (M‐H, Fixed, 95% CI) | 1.12 [0.47, 2.65] |
| 6.25 "Major neurosensory impairment" ‐ blindness or deafness Show forest plot | 1 | 50 | Risk Ratio (M‐H, Fixed, 95% CI) | 0.60 [0.16, 2.25] |
| 6.26 "Major neurosensory impairment" ‐ blindness or deafness ‐ in survivors assessed Show forest plot | 1 | 45 | Risk Ratio (M‐H, Fixed, 95% CI) | 0.57 [0.16, 2.12] |
| 6.27 Behaviour abnormalities Show forest plot | 1 | 50 | Risk Ratio (M‐H, Fixed, 95% CI) | 0.60 [0.16, 2.25] |
| 6.28 Behaviour abnormalities in 3‐year‐old survivors assessed Show forest plot | 1 | 46 | Risk Ratio (M‐H, Fixed, 95% CI) | 0.60 [0.16, 2.22] |
| 6.29 Abnormal EEG Show forest plot | 2 | 306 | Risk Ratio (M‐H, Fixed, 95% CI) | 1.24 [0.66, 2.33] |
| 6.30 Abnormal EEG in tested survivors Show forest plot | 2 | 146 | Risk Ratio (M‐H, Fixed, 95% CI) | 1.13 [0.61, 2.08] |
| 6.31 Re‐hospitalisation in infancy Show forest plot | 3 | 672 | Risk Ratio (M‐H, Fixed, 95% CI) | 0.86 [0.68, 1.08] |
| 6.32 Re‐hospitalisation in infancy in survivors Show forest plot | 3 | 430 | Risk Ratio (M‐H, Fixed, 95% CI) | 0.87 [0.71, 1.07] |
| Outcome or subgroup title | No. of studies | No. of participants | Statistical method | Effect size |
| 7.1 Mortality to latest age Show forest plot | 11 | 1433 | Risk Ratio (M‐H, Fixed, 95% CI) | 0.80 [0.65, 0.99] |
| 7.1.1 Lung | 7 | 1319 | Risk Ratio (M‐H, Fixed, 95% CI) | 0.82 [0.66, 1.01] |
| 7.1.2 Blood pressure | 4 | 114 | Risk Ratio (M‐H, Fixed, 95% CI) | 0.58 [0.24, 1.38] |
| 7.2 Bronchopulmonary dysplasia at 36 weeks Show forest plot | 9 | 1152 | Risk Ratio (M‐H, Fixed, 95% CI) | 0.90 [0.80, 1.02] |
| 7.2.1 Lung | 6 | 1058 | Risk Ratio (M‐H, Fixed, 95% CI) | 0.89 [0.79, 1.02] |
| 7.2.2 Blood pressure | 3 | 94 | Risk Ratio (M‐H, Fixed, 95% CI) | 1.01 [0.66, 1.54] |
| 7.3 Mortality or bronchopulmonary dysplasia at 36 weeks Show forest plot | 7 | 1297 | Risk Ratio (M‐H, Fixed, 95% CI) | 0.89 [0.80, 0.98] |
| 7.3.1 Lung | 6 | 1275 | Risk Ratio (M‐H, Fixed, 95% CI) | 0.90 [0.81, 0.99] |
| 7.3.2 Blood pressure | 1 | 22 | Risk Ratio (M‐H, Fixed, 95% CI) | 0.44 [0.19, 1.02] |