بررسی تاثیر استفاده زودهنگام (< 7 روز) از کورتیکواستروئیدهای سیستمیک پس از زایمان برای پیشگیری از بروز دیسپلازی برونکوپولمونری در نوزادان نارس
Appendices
Appendix 1. 2020 search methods
The RCT filters have been created using Cochrane's highly sensitive search strategies for identifying randomised trials (Higgins 2020). The neonatal filters were created and tested by the Cochrane Neonatal Information Specialist.
CENTRAL via CRS Web
Date ranges: 01 January 2016 to 25 September 2020
Terms:
1 MESH DESCRIPTOR Adrenal Cortex Hormones EXPLODE ALL AND CENTRAL:TARGET
2 MESH DESCRIPTOR Steroids EXPLODE ALL AND CENTRAL:TARGET
3 MESH DESCRIPTOR Glucocorticoids EXPLODE ALL AND CENTRAL:TARGET
4 adrenal cortex hormone* OR dexamethasone OR betamethasone OR hydrocortisone OR steroid OR steroids OR corticosteroid* OR prednisolone OR methylprednisolone OR glucocorticoid* AND CENTRAL:TARGET
5 #1 OR #2 OR #3 OR #4
6 MESH DESCRIPTOR Infant, Newborn EXPLODE ALL AND CENTRAL:TARGET
7 infant or infants or infant's or "infant s" or infantile or infancy or newborn* or "new born" or "new borns" or "newly born" or neonat* or baby* or babies or premature or prematures or prematurity or preterm or preterms or "pre term" or premies or "low birth weight" or "low birthweight" or VLBW or LBW or ELBW or NICU AND CENTRAL:TARGET
8 #7 OR #6 AND CENTRAL:TARGET
9 #5 AND #8
10 2016 TO 2020:YR AND CENTRAL:TARGET
11 #10 AND #9
MEDLINE via OVID
Date ranges: 01 January 2016 to 25 September 2020
Terms:
1. exp Adrenal Cortex Hormones/
2. exp Steroids/
3. exp Glucocorticoids/
4. (adrenal cortex hormone* or dexamethasone or betamethasone or hydrocortisone or steroid or steroids or corticosteroid* or prednisolone or methylprednisolone or glucocorticoid*).mp.
5. 1 or 2 or 3 or 4
6. exp infant, newborn/
7. (newborn* or new born or new borns or newly born or baby* or babies or premature or prematurity or preterm or pre term or low birth weight or low birthweight or VLBW or LBW or infant or infants or 'infant s' or infant's or infantile or infancy or neonat*).ti,ab.
8. 6 or 7
9. randomized controlled trial.pt.
10. controlled clinical trial.pt.
11. randomized.ab.
12. placebo.ab.
13. drug therapy.fs.
14. randomly.ab.
15. trial.ab.
16. groups.ab.
17. or/9‐16
18. exp animals/ not humans.sh.
19. 17 not 18
20. 8 and 19
21. randomi?ed.ti,ab.
22. randomly.ti,ab.
23. trial.ti,ab.
24. groups.ti,ab.
25. ((single or doubl* or tripl* or treb*) and (blind* or mask*)).ti,ab.
26. placebo*.ti,ab.
27. 21 or 22 or 23 or 24 or 25 or 26
28. 7 and 27
29. limit 28 to yr="2019 ‐Current"
30. 20 or 29
31. 5 and 30
32. limit 31 to yr="2016 ‐Current"
ISRCTN
Date ranges: 2016 to 2020
Terms:
corticosteroid* within Participant age range: Neonate
"Adrenal Cortex Hormones AND ( Participant age range: Neonate )"
"Glucocorticoid* AND ( Participant age range: Neonate )"
Steroids within Participant age range: Neonate
Appendix 2. 2017 search methods
We used the criteria and standard methods of Cochrane and Cochrane Neonatal.
We conducted a comprehensive search that included the Cochrane Central Register of Controlled Trials (CENTRAL; 2017, Issue 1), in the Cochrane Library; MEDLINE via PubMed (January 2013 to 21 February 2017); Embase (January 2013 to 21 February 2017); and the Cumulative Index to Nursing and Allied Health Literature (CINAHL) (January 2013 to 21 February 2017), using the following search terms: (adrenal cortex hormones OR dexamethasone OR betamethasone OR hydrocortisone OR steroid OR corticosteroid), plus database‐specific limiters for RCTs and neonates (see below for full search strategies for each database). We did not apply language restrictions.
We searched clinical trials registries for ongoing or recently completed trials (clinicaltrials.gov; World Health Organization International Trial Registry and Platform (www.whoint/ictrp/search/en/); the ISRCTN Registry).
PubMed: ((infant, newborn[MeSH] OR newborn OR neonate OR neonatal OR premature OR low birth weight OR VLBW OR LBW or infan* or neonat*) AND (randomized controlled trial [pt] OR controlled clinical trial [pt] OR randomized [tiab] OR placebo [tiab] OR drug therapy [sh] OR randomly [tiab] OR trial [tiab] OR groups [tiab]) NOT (animals [mh] NOT humans [mh]))
Embase: (infant, newborn or newborn or neonate or neonatal or premature or very low birth weight or low birth weight or VLBW or LBW or Newborn or infan* or neonat*) AND (human not animal) AND (randomized controlled trial or controlled clinical trial or randomized or placebo or clinical trials as topic or randomly or trial or clinical trial)
CINAHL: (infant, newborn OR newborn OR neonate OR neonatal OR premature OR low birth weight OR VLBW OR LBW or Newborn or infan* or neonat*) AND (randomized controlled trial OR controlled clinical trial OR randomized OR placebo OR clinical trials as topic OR randomly OR trial OR PT clinical trial)
The Cochrane Library: (infant or newborn or neonate or neonatal or premature or preterm or very low birth weight or low birth weight or VLBW or LBW)
Appendix 3. 2013 search methods
For previous versions of this review, we sought randomised controlled trials of postnatal corticosteroid therapy from the Cochrane Central Register of Controlled Trials (CENTRAL; 2013, Issue 8), in the Cochrane Library; MEDLINE (1966 to August 2013); handsearching of paediatric and perinatal journals; and examination of previous review articles and information received from practising neonatologists. We searched MEDLINE using the terms: adrenal cortex hormones or dexamethasone or betamethasone or hydrocortisone or steroids or corticosteroids, limits randomised controlled trials, human, all infant: birth to 23 months. We contacted the authors of all studies, when possible, to confirm details of reported follow‐up studies, or to obtain any information about long‐term follow‐up when none had been reported.
Appendix 4. Risk of bias tool
Sequence generation (checking for possible selection bias). Was the allocation sequence adequately generated?
For each included study, we categorised the method used to generate the allocation sequence as:
-
low risk (any truly random process, e.g. random number table; computer random number generator);
-
high risk (any non‐random process, e.g. odd or even date of birth; hospital or clinic record number); or
-
unclear risk.
Allocation concealment (checking for possible selection bias). Was allocation adequately concealed?
For each included study, we categorised the method used to conceal the allocation sequence as:
-
low risk (e.g. telephone or central randomisation; consecutively numbered sealed opaque envelopes);
-
high risk (open random allocation; unsealed or non‐opaque envelopes, alternation; date of birth); or
-
unclear risk.
Blinding of participants and personnel (checking for possible performance bias). Was knowledge of the allocated intervention adequately prevented during the study?
For each included study, we categorised the methods used to blind study participants and personnel from knowledge of which intervention a participant received. We assessed blinding separately for different outcomes or classes of outcomes. We categorised methods as:
-
low risk, high risk, or unclear risk for participants; and
-
low risk, high risk, or unclear risk for personnel.
Blinding of outcome assessment (checking for possible detection bias). Was knowledge of the allocated intervention adequately prevented at the time of outcome assessment?
For each included study, we categorised the methods used to blind outcome assessment. We assessed blinding separately for different outcomes or classes of outcomes. We categorised the methods as:
-
low risk for outcome assessors;
-
high risk for outcome assessors; or
-
unclear risk for outcome assessors.
Incomplete outcome data (checking for possible attrition bias through withdrawals, dropouts, protocol deviations). Were incomplete outcome data adequately addressed?
For each included study and for each outcome, we described the completeness of data including attrition and exclusions from the analysis. We noted whether attrition and exclusions were reported, numbers included in the analysis at each stage (compared with total randomised participants), reasons for attrition or exclusion when reported, and whether missing data were balanced across groups or were related to outcomes. When trial authors reported or supplied sufficient information, we re‐included missing data in the analyses. We categorised methods as:
-
low risk (< 20% missing data);
-
high risk (≥ 20% missing data); or
-
unclear risk.
Selective reporting bias. Are reports of the study free of suggestion of selective outcome reporting?
For each included study, we described how we investigated the possibility of selective outcome reporting bias and what we found. We assessed methods as:
-
low risk (when it is clear that all of the study's prespecified outcomes and all expected outcomes of interest to the review have been reported);
-
high risk (when not all of the study's prespecified outcomes have been reported; one or more reported primary outcomes were not prespecified outcomes of interest and are reported incompletely and so cannot be used; study fails to include results of a key outcome that would have been expected to have been reported); or
-
unclear risk.
Other sources of bias. Was the study apparently free of other problems that could put it at high risk of bias?
For each included study, we described any important concerns we had about other possible sources of bias (e.g. whether there was a potential source of bias related to the specific study design, whether the trial was stopped early owing to some data‐dependent process). We assessed whether each study was free of other problems that could put it at risk of bias as:
-
low risk;
-
high risk; or
-
unclear risk.
If needed, we explored the impact of the level of bias by undertaking sensitivity analyses.
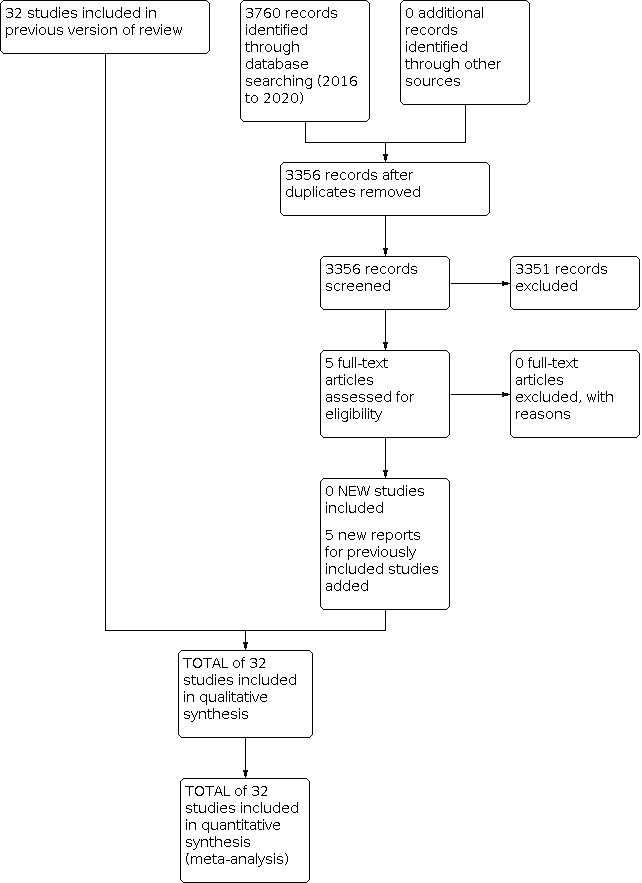
Study flow diagram: review update.

Risk of bias table.

Risk of bias summary: review authors' judgements about each risk of bias item for each included study.

Funnel plot of comparison: 1 Mortality, outcome: 1.4 Mortality at latest reported age.

Funnel plot of comparison: 2 Bronchopulmonary dysplasia (BPD), outcome: 2.2 BPD (36 weeks' postmenstrual age).

Funnel plot of comparison: 3 Death or bronchopulmonary dysplasia (BPD), outcome: 3.2 Death or BPD at 36 weeks' postmenstrual age.

Funnel plot of comparison: 5 Complications during primary hospitalisation, outcome: 5.15 Gastrointestinal perforation.

Funnel plot of comparison: 6 Long‐term follow‐up, outcome: 6.11 Cerebral palsy.

Funnel plot of comparison: 6 Long‐term follow‐up, outcome: 6.13 Death or cerebral palsy.

Comparison 1: Mortality at different ages, Outcome 1: Neonatal mortality (up to 28 days)

Comparison 1: Mortality at different ages, Outcome 2: Mortality at 36 weeks

Comparison 1: Mortality at different ages, Outcome 3: Mortality to hospital discharge

Comparison 1: Mortality at different ages, Outcome 4: Mortality at latest reported age

Comparison 2: Bronchopulmonary dysplasia (BPD) at different ages, Outcome 1: BPD (28 days of life)

Comparison 2: Bronchopulmonary dysplasia (BPD) at different ages, Outcome 2: BPD (36 weeks' postmenstrual age)

Comparison 2: Bronchopulmonary dysplasia (BPD) at different ages, Outcome 3: BPD at 36 weeks' postmenstrual age in survivors to 36 weeks

Comparison 2: Bronchopulmonary dysplasia (BPD) at different ages, Outcome 4: Late rescue with corticosteroids

Comparison 2: Bronchopulmonary dysplasia (BPD) at different ages, Outcome 5: Survivors who had late rescue with corticosteroids

Comparison 2: Bronchopulmonary dysplasia (BPD) at different ages, Outcome 6: Survivors discharged home on oxygen

Comparison 3: Mortality or bronchopulmonary dysplasia (BPD) at different ages, Outcome 1: Death or BPD at 28 days of life

Comparison 3: Mortality or bronchopulmonary dysplasia (BPD) at different ages, Outcome 2: Death or BPD at 36 weeks' postmenstrual age

Comparison 4: Failure to extubate at different ages, Outcome 1: Failure to extubate by third day

Comparison 4: Failure to extubate at different ages, Outcome 2: Failure to extubate by seventh day

Comparison 4: Failure to extubate at different ages, Outcome 3: Failure to extubate by 14th day

Comparison 4: Failure to extubate at different ages, Outcome 4: Failure to extubate by 28th day

Comparison 5: Complications during primary hospitalisation, Outcome 1: Infection

Comparison 5: Complications during primary hospitalisation, Outcome 2: Hyperglycaemia

Comparison 5: Complications during primary hospitalisation, Outcome 3: Hypertension

Comparison 5: Complications during primary hospitalisation, Outcome 4: Hypertrophic cardiomyopathy

Comparison 5: Complications during primary hospitalisation, Outcome 5: Growth failure

Comparison 5: Complications during primary hospitalisation, Outcome 6: Pulmonary air leak

Comparison 5: Complications during primary hospitalisation, Outcome 7: Patent ductus arteriosus (PDA)

Comparison 5: Complications during primary hospitalisation, Outcome 8: Severe IVH

Comparison 5: Complications during primary hospitalisation, Outcome 9: Severe intraventricular haemorrhage (IVH) in infants examined

Comparison 5: Complications during primary hospitalisation, Outcome 10: Periventricular leukomalacia (PVL)

Comparison 5: Complications during primary hospitalisation, Outcome 11: PVL in infants with cranial ultrasound scans

Comparison 5: Complications during primary hospitalisation, Outcome 12: PVL in survivors seen at follow‐up

Comparison 5: Complications during primary hospitalisation, Outcome 13: Necrotising enterocolitis (NEC)

Comparison 5: Complications during primary hospitalisation, Outcome 14: Gastrointestinal bleeding

Comparison 5: Complications during primary hospitalisation, Outcome 15: Gastrointestinal perforation

Comparison 5: Complications during primary hospitalisation, Outcome 16: Pulmonary haemorrhage

Comparison 5: Complications during primary hospitalisation, Outcome 17: Any retinopathy of prematurity (ROP)

Comparison 5: Complications during primary hospitalisation, Outcome 18: Severe ROP

Comparison 5: Complications during primary hospitalisation, Outcome 19: Severe ROP in survivors

Comparison 6: Long‐term follow‐up into later childhood, Outcome 1: Bayley Mental Developmental Index (MDI) < ‐2 SD

Comparison 6: Long‐term follow‐up into later childhood, Outcome 2: Bayley MDI < ‐2 SD in tested survivors

Comparison 6: Long‐term follow‐up into later childhood, Outcome 3: Bayley Psychomotor Developmental Index (PDI) < ‐2 SD

Comparison 6: Long‐term follow‐up into later childhood, Outcome 4: Bayley PDI < ‐2 SD in tested survivors

Comparison 6: Long‐term follow‐up into later childhood, Outcome 5: Developmental delay (other criteria)

Comparison 6: Long‐term follow‐up into later childhood, Outcome 6: Developmental delay (other criteria) in tested survivors

Comparison 6: Long‐term follow‐up into later childhood, Outcome 7: Blindness

Comparison 6: Long‐term follow‐up into later childhood, Outcome 8: Blindness in survivors assessed

Comparison 6: Long‐term follow‐up into later childhood, Outcome 9: Deafness

Comparison 6: Long‐term follow‐up into later childhood, Outcome 10: Deafness in survivors assessed

Comparison 6: Long‐term follow‐up into later childhood, Outcome 11: Cerebral palsy

Comparison 6: Long‐term follow‐up into later childhood, Outcome 12: Death before follow‐up in trials assessing cerebral palsy

Comparison 6: Long‐term follow‐up into later childhood, Outcome 13: Death or cerebral palsy

Comparison 6: Long‐term follow‐up into later childhood, Outcome 14: Cerebral palsy in survivors assessed

Comparison 6: Long‐term follow‐up into later childhood, Outcome 15: Major neurosensory disability (variable criteria ‐ see individual studies)

Comparison 6: Long‐term follow‐up into later childhood, Outcome 16: Death before follow‐up in trials assessing major neurosensory disability (variable criteria)

Comparison 6: Long‐term follow‐up into later childhood, Outcome 17: Death or major neurosensory disability (variable criteria)

Comparison 6: Long‐term follow‐up into later childhood, Outcome 18: Major neurosensory disability in survivors examined (variable criteria)

Comparison 6: Long‐term follow‐up into later childhood, Outcome 19: Abnormal neurological exam (variable criteria ‐ see individual studies)

Comparison 6: Long‐term follow‐up into later childhood, Outcome 20: Death before follow‐up in trials assessing abnormal neurological exam (variable criteria)

Comparison 6: Long‐term follow‐up into later childhood, Outcome 21: Death or abnormal neurological exam (variable criteria)

Comparison 6: Long‐term follow‐up into later childhood, Outcome 22: Abnormal neurological exam in tested survivors (variable criteria)

Comparison 6: Long‐term follow‐up into later childhood, Outcome 23: Intellectual impairment (IQ < 70)

Comparison 6: Long‐term follow‐up into later childhood, Outcome 24: Intellectual impairment (IQ < 70) in survivors assessed

Comparison 6: Long‐term follow‐up into later childhood, Outcome 25: "Major neurosensory impairment" ‐ blindness or deafness

Comparison 6: Long‐term follow‐up into later childhood, Outcome 26: "Major neurosensory impairment" ‐ blindness or deafness ‐ in survivors assessed

Comparison 6: Long‐term follow‐up into later childhood, Outcome 27: Behaviour abnormalities

Comparison 6: Long‐term follow‐up into later childhood, Outcome 28: Behaviour abnormalities in 3‐year‐old survivors assessed

Comparison 6: Long‐term follow‐up into later childhood, Outcome 29: Abnormal EEG

Comparison 6: Long‐term follow‐up into later childhood, Outcome 30: Abnormal EEG in tested survivors

Comparison 6: Long‐term follow‐up into later childhood, Outcome 31: Re‐hospitalisation in infancy

Comparison 6: Long‐term follow‐up into later childhood, Outcome 32: Re‐hospitalisation in infancy in survivors

Comparison 7: Sensitivity analyses by indication for hydrocortisone, Outcome 1: Mortality to latest age

Comparison 7: Sensitivity analyses by indication for hydrocortisone, Outcome 2: Bronchopulmonary dysplasia at 36 weeks

Comparison 7: Sensitivity analyses by indication for hydrocortisone, Outcome 3: Mortality or bronchopulmonary dysplasia at 36 weeks
| Early systemic postnatal corticosteroids (dexamethasone and hydrocortisone) compared with placebo or no treatment for preventing bronchopulmonary dysplasia in preterm infants | ||||||
| Patient or population: preventing bronchopulmonary dysplasia in preterm infants | ||||||
| Outcomes | Anticipated absolute effects* (95% CI) | Relative effect | No. of participants | Certainty of the evidence | Comments | |
|---|---|---|---|---|---|---|
| Risk with placebo or no treatment | Risk with early systemic postnatal corticosteroids | |||||
| Mortality at latest reported age
| Study population (studies treating with dexamethasone or hydrocortisone) | RR 0.95 | 4373 | ⊕⊕⊕⊕ | critical P = 0.05 for subgroup differences | |
| 232 per 1000 | 221 per 1000 | |||||
| Study population (subgroup of studies treating with dexamethasone) | RR 1.02 | 2940 | ⊕⊕⊕⊕ | critical | ||
| 236 per 1000 | 241 per 1000 (212 to 274) | |||||
| Study population (subgroup of studies treating with hydrocortisone) | RR 0.80 | 1433 | ⊕⊕⊕⊕ | critical | ||
| 225 per 1000 | 180 per 1000 | |||||
| BPD (36 weeks' PMA)
| Study population (studies treating with dexamethasone or hydrocortisone) | RR 0.80 | 4167 | ⊕⊕⊕⊝ | important P = 0.01 for subgroup differences | |
| 308 per 1000 | 247 per 1000 | |||||
| Study population (subgroup of studies treating with dexamethasone) | RR 0.72 | 2791 | ⊕⊕⊕⊕ | important | ||
| 269 per 1000 | 194 per 1000 | |||||
| Study population (subgroup of studies treating with hydrocortisone) | RR 0.92 | 1376 | ⊕⊕⊕⊕ | important | ||
| 385 per 1000 | 354 per 1000 | |||||
| Mortality or BPD at 36 weeks' PMA
| Study population (studies treating with dexamethasone or hydrocortisone) | RR 0.89 | 4167 | ⊕⊕⊕⊕ | critical | |
| 515 per 1000 | 458 per 1000 | |||||
| Study population (subgroup of studies treating with dexamethasone) | RR 0.88 | 2791 | ⊕⊕⊕⊕ | critical | ||
| 487 per 1000 | 429 per 1000 | |||||
| Study population (subgroup of studies treating with hydrocortisone) | RR 0.90 | 1376 | ⊕⊕⊕⊕ | critical | ||
| 569 per 1000 | 512 per 1000 | |||||
| Gastrointestinal perforation during primary hospitalisation
| Study population (studies treating with dexamethasone or hydrocortisone) | RR 1.84 | 3040 | ⊕⊕⊕⊕ | important | |
| 39 per 1000 | 71 per 1000 | |||||
| Study population (subgroup of studies treating with dexamethasone) | RR 1.73 | 1936 | ⊕⊕⊕⊕ | important | ||
| 41 per 1000 | 71 per 1000 | |||||
| Study population (subgroup of infants treated with hydrocortisone | RR 2.05 | 1104 | ⊕⊕⊕⊕ | important | ||
| 34 per 1000 | 70 per 1000 | |||||
| Cerebral palsy at latest reported age
| Study population (studies treating with dexamethasone or hydrocortisone) | RR 1.42 | 1973 | ⊕⊕⊕⊕ | critical P = 0.09 for subgroup differences | |
| 74 per 1000 | 106 per 1000 | |||||
| Study population (subgroup of studies treating with dexamethasone) | RR 1.77 | 921 | ⊕⊕⊕⊕ | critical | ||
| 89 per 1000 | 158 per 1000 | |||||
| Study population (subgroup of studies treating with hydrocortisone) | RR 1.05 | 1052 | ⊕⊕⊕⊕ | critical | ||
| 62 per 1000 | 65 per 1000 | |||||
| Mortality or cerebral palsy at latest reported age
| Study population (studies treating with dexamethasone or hydrocortisone) | RR 1.03 | 1973 | ⊕⊕⊕⊕ | critical P = 0.02 for subgroup differences | |
| 335 per 1000 | 345 per 1000 | |||||
| Study population (subgroup of studies treating with dexamethasone) | RR 1.18 | 921 | ⊕⊕⊕⊕ | critical
| ||
| 383 per 1000 | 452 per 1000 | |||||
| Study population (subgroup of studies treating with hydrocortisone) | RR 0.86 | 1052 | ⊕⊕⊕⊕ | critical | ||
| 295 per 1000 | 254 per 1000 | |||||
| *The risk in the intervention group (and its 95% confidence interval) is based on assumed risk in the comparison group and the relative effect of the intervention (and its 95% CI). | ||||||
| GRADE Working Group grades of evidence. High certainty: further research is very unlikely to change our confidence in the estimate of effect. Moderate certainty: further research is likely to have an important impact on our confidence in the estimate of effect and may change the estimate. Low certainty: further research is very likely to have an important impact on our confidence in the estimate of effect and is likely to change the estimate. Very low certainty: we are very uncertain about the estimate. | ||||||
| aDowngraded one level for serious study limitations owing to evidence of publication bias for studies overall, but not within subgroups. | ||||||
| Outcome or subgroup title | No. of studies | No. of participants | Statistical method | Effect size |
| 1.1 Neonatal mortality (up to 28 days) Show forest plot | 20 | 2933 | Risk Ratio (M‐H, Fixed, 95% CI) | 1.01 [0.87, 1.18] |
| 1.1.1 Dexamethasone | 16 | 2576 | Risk Ratio (M‐H, Fixed, 95% CI) | 1.05 [0.90, 1.23] |
| 1.1.2 Hydrocortisone | 4 | 357 | Risk Ratio (M‐H, Fixed, 95% CI) | 0.77 [0.49, 1.21] |
| 1.2 Mortality at 36 weeks Show forest plot | 27 | 4176 | Risk Ratio (M‐H, Fixed, 95% CI) | 1.01 [0.90, 1.13] |
| 1.2.1 Dexamethasone | 17 | 2791 | Risk Ratio (M‐H, Fixed, 95% CI) | 1.08 [0.94, 1.23] |
| 1.2.2 Hydrocortisone | 10 | 1385 | Risk Ratio (M‐H, Fixed, 95% CI) | 0.85 [0.67, 1.06] |
| 1.3 Mortality to hospital discharge Show forest plot | 29 | 4164 | Risk Ratio (M‐H, Fixed, 95% CI) | 0.96 [0.85, 1.07] |
| 1.3.1 Dexamethasone | 18 | 2731 | Risk Ratio (M‐H, Fixed, 95% CI) | 1.03 [0.90, 1.19] |
| 1.3.2 Hydrocortisone | 11 | 1433 | Risk Ratio (M‐H, Fixed, 95% CI) | 0.80 [0.65, 0.99] |
| 1.4 Mortality at latest reported age Show forest plot | 31 | 4373 | Risk Ratio (M‐H, Fixed, 95% CI) | 0.95 [0.85, 1.06] |
| 1.4.1 Dexamethasone | 20 | 2940 | Risk Ratio (M‐H, Fixed, 95% CI) | 1.02 [0.90, 1.16] |
| 1.4.2 Hydrocortisone | 11 | 1433 | Risk Ratio (M‐H, Fixed, 95% CI) | 0.80 [0.65, 0.99] |
| Outcome or subgroup title | No. of studies | No. of participants | Statistical method | Effect size |
| 2.1 BPD (28 days of life) Show forest plot | 15 | 2580 | Risk Ratio (M‐H, Fixed, 95% CI) | 0.86 [0.80, 0.93] |
| 2.1.1 Dexamethasone | 14 | 2327 | Risk Ratio (M‐H, Fixed, 95% CI) | 0.84 [0.78, 0.91] |
| 2.1.2 Hydrocortisone | 1 | 253 | Risk Ratio (M‐H, Fixed, 95% CI) | 1.00 [0.85, 1.18] |
| 2.2 BPD (36 weeks' postmenstrual age) Show forest plot | 26 | 4167 | Risk Ratio (M‐H, Fixed, 95% CI) | 0.80 [0.73, 0.88] |
| 2.2.1 Dexamethasone | 17 | 2791 | Risk Ratio (M‐H, Fixed, 95% CI) | 0.72 [0.63, 0.82] |
| 2.2.2 Hydrocortisone | 9 | 1376 | Risk Ratio (M‐H, Fixed, 95% CI) | 0.92 [0.81, 1.06] |
| 2.3 BPD at 36 weeks' postmenstrual age in survivors to 36 weeks Show forest plot | 24 | 3093 | Risk Ratio (M‐H, Fixed, 95% CI) | 0.79 [0.72, 0.87] |
| 2.3.1 Dexamethasone | 15 | 1948 | Risk Ratio (M‐H, Fixed, 95% CI) | 0.72 [0.63, 0.82] |
| 2.3.2 Hydrocortisone | 9 | 1145 | Risk Ratio (M‐H, Fixed, 95% CI) | 0.89 [0.78, 1.02] |
| 2.4 Late rescue with corticosteroids Show forest plot | 15 | 3004 | Risk Ratio (M‐H, Fixed, 95% CI) | 0.79 [0.73, 0.86] |
| 2.4.1 Dexamethasone | 10 | 1974 | Risk Ratio (M‐H, Fixed, 95% CI) | 0.72 [0.65, 0.80] |
| 2.4.2 Hydrocortisone | 5 | 1030 | Risk Ratio (M‐H, Fixed, 95% CI) | 0.94 [0.81, 1.09] |
| 2.5 Survivors who had late rescue with corticosteroids Show forest plot | 7 | 895 | Risk Ratio (M‐H, Fixed, 95% CI) | 0.77 [0.67, 0.89] |
| 2.5.1 Dexamethasone | 6 | 853 | Risk Ratio (M‐H, Fixed, 95% CI) | 0.79 [0.68, 0.91] |
| 2.5.2 Hydrocortisone | 1 | 42 | Risk Ratio (M‐H, Fixed, 95% CI) | 0.48 [0.24, 0.98] |
| 2.6 Survivors discharged home on oxygen Show forest plot | 9 | 1442 | Risk Ratio (M‐H, Fixed, 95% CI) | 0.86 [0.70, 1.07] |
| 2.6.1 Dexamethasone | 3 | 406 | Risk Ratio (M‐H, Fixed, 95% CI) | 0.78 [0.48, 1.26] |
| 2.6.2 Hydrocortisone | 6 | 1036 | Risk Ratio (M‐H, Fixed, 95% CI) | 0.89 [0.70, 1.13] |
| Outcome or subgroup title | No. of studies | No. of participants | Statistical method | Effect size |
| 3.1 Death or BPD at 28 days of life Show forest plot | 14 | 2471 | Risk Ratio (M‐H, Fixed, 95% CI) | 0.92 [0.87, 0.96] |
| 3.1.1 Dexamethasone | 13 | 2218 | Risk Ratio (M‐H, Fixed, 95% CI) | 0.90 [0.86, 0.95] |
| 3.1.2 Hydrocortisone | 1 | 253 | Risk Ratio (M‐H, Fixed, 95% CI) | 1.00 [0.90, 1.12] |
| 3.2 Death or BPD at 36 weeks' postmenstrual age Show forest plot | 26 | 4167 | Risk Ratio (M‐H, Fixed, 95% CI) | 0.89 [0.83, 0.94] |
| 3.2.1 Dexamethasone | 17 | 2791 | Risk Ratio (M‐H, Fixed, 95% CI) | 0.88 [0.81, 0.95] |
| 3.2.2 Hydrocortisone | 9 | 1376 | Risk Ratio (M‐H, Fixed, 95% CI) | 0.90 [0.82, 0.99] |
| Outcome or subgroup title | No. of studies | No. of participants | Statistical method | Effect size |
| 4.1 Failure to extubate by third day Show forest plot | 4 | 887 | Risk Ratio (M‐H, Fixed, 95% CI) | 0.85 [0.75, 0.95] |
| 4.1.1 Dexamethasone | 3 | 381 | Risk Ratio (M‐H, Fixed, 95% CI) | 0.73 [0.62, 0.86] |
| 4.1.2 Hydrocortisone | 1 | 506 | Risk Ratio (M‐H, Fixed, 95% CI) | 0.96 [0.82, 1.14] |
| 4.2 Failure to extubate by seventh day Show forest plot | 8 | 1448 | Risk Ratio (M‐H, Fixed, 95% CI) | 0.76 [0.68, 0.85] |
| 4.2.1 Dexamethasone | 6 | 703 | Risk Ratio (M‐H, Fixed, 95% CI) | 0.71 [0.61, 0.84] |
| 4.2.2 Hydrocortisone | 2 | 745 | Risk Ratio (M‐H, Fixed, 95% CI) | 0.80 [0.69, 0.94] |
| 4.3 Failure to extubate by 14th day Show forest plot | 4 | 443 | Risk Ratio (M‐H, Fixed, 95% CI) | 0.77 [0.62, 0.97] |
| 4.4 Failure to extubate by 28th day Show forest plot | 7 | 902 | Risk Ratio (M‐H, Fixed, 95% CI) | 0.84 [0.72, 0.98] |
| Outcome or subgroup title | No. of studies | No. of participants | Statistical method | Effect size |
| 5.1 Infection Show forest plot | 25 | 4101 | Risk Ratio (M‐H, Fixed, 95% CI) | 1.05 [0.96, 1.15] |
| 5.1.1 Dexamethasone | 18 | 2821 | Risk Ratio (M‐H, Fixed, 95% CI) | 1.02 [0.91, 1.15] |
| 5.1.2 Hydrocortisone | 7 | 1280 | Risk Ratio (M‐H, Fixed, 95% CI) | 1.08 [0.94, 1.25] |
| 5.2 Hyperglycaemia Show forest plot | 14 | 2688 | Risk Ratio (M‐H, Fixed, 95% CI) | 1.26 [1.15, 1.37] |
| 5.2.1 Dexamethasone | 12 | 2117 | Risk Ratio (M‐H, Fixed, 95% CI) | 1.35 [1.21, 1.49] |
| 5.2.2 Hydrocortisone | 2 | 571 | Risk Ratio (M‐H, Fixed, 95% CI) | 1.01 [0.84, 1.22] |
| 5.3 Hypertension Show forest plot | 11 | 1993 | Risk Ratio (M‐H, Fixed, 95% CI) | 1.85 [1.54, 2.22] |
| 5.3.1 Dexamethasone | 10 | 1943 | Risk Ratio (M‐H, Fixed, 95% CI) | 1.84 [1.53, 2.21] |
| 5.3.2 Hydrocortisone | 1 | 50 | Risk Ratio (M‐H, Fixed, 95% CI) | 3.00 [0.33, 26.92] |
| 5.4 Hypertrophic cardiomyopathy Show forest plot | 1 | 50 | Risk Ratio (M‐H, Fixed, 95% CI) | 4.33 [1.40, 13.37] |
| 5.5 Growth failure Show forest plot | 1 | 50 | Risk Ratio (M‐H, Fixed, 95% CI) | 6.67 [2.27, 19.62] |
| 5.6 Pulmonary air leak Show forest plot | 17 | 3276 | Risk Ratio (M‐H, Fixed, 95% CI) | 0.90 [0.73, 1.11] |
| 5.6.1 Dexamethasone | 12 | 2041 | Risk Ratio (M‐H, Fixed, 95% CI) | 0.85 [0.66, 1.08] |
| 5.6.2 Hydrocortisone | 5 | 1235 | Risk Ratio (M‐H, Fixed, 95% CI) | 1.06 [0.72, 1.56] |
| 5.7 Patent ductus arteriosus (PDA) Show forest plot | 24 | 4013 | Risk Ratio (M‐H, Fixed, 95% CI) | 0.78 [0.72, 0.85] |
| 5.7.1 Dexamethasone | 17 | 2706 | Risk Ratio (M‐H, Fixed, 95% CI) | 0.76 [0.69, 0.84] |
| 5.7.2 Hydrocortisone | 7 | 1307 | Risk Ratio (M‐H, Fixed, 95% CI) | 0.82 [0.71, 0.95] |
| 5.8 Severe IVH Show forest plot | 26 | 4103 | Risk Ratio (M‐H, Fixed, 95% CI) | 0.97 [0.84, 1.12] |
| 5.8.1 Dexamethasone | 17 | 2736 | Risk Ratio (M‐H, Fixed, 95% CI) | 0.96 [0.81, 1.14] |
| 5.8.2 Hydrocortisone | 9 | 1367 | Risk Ratio (M‐H, Fixed, 95% CI) | 0.98 [0.76, 1.27] |
| 5.9 Severe intraventricular haemorrhage (IVH) in infants examined Show forest plot | 8 | 1964 | Risk Ratio (M‐H, Fixed, 95% CI) | 0.92 [0.75, 1.12] |
| 5.9.1 Dexamethasone | 4 | 994 | Risk Ratio (M‐H, Fixed, 95% CI) | 0.78 [0.59, 1.03] |
| 5.9.2 Hydrocortisone | 4 | 970 | Risk Ratio (M‐H, Fixed, 95% CI) | 1.11 [0.82, 1.49] |
| 5.10 Periventricular leukomalacia (PVL) Show forest plot | 15 | 2807 | Risk Ratio (M‐H, Fixed, 95% CI) | 1.12 [0.83, 1.53] |
| 5.10.1 Dexamethasone | 8 | 1514 | Risk Ratio (M‐H, Fixed, 95% CI) | 1.23 [0.84, 1.81] |
| 5.10.2 Hydrocortisone | 7 | 1293 | Risk Ratio (M‐H, Fixed, 95% CI) | 0.96 [0.58, 1.59] |
| 5.11 PVL in infants with cranial ultrasound scans Show forest plot | 7 | 1841 | Risk Ratio (M‐H, Fixed, 95% CI) | 1.13 [0.79, 1.60] |
| 5.12 PVL in survivors seen at follow‐up Show forest plot | 2 | 183 | Risk Ratio (M‐H, Fixed, 95% CI) | 1.22 [0.60, 2.48] |
| 5.13 Necrotising enterocolitis (NEC) Show forest plot | 25 | 4050 | Risk Ratio (M‐H, Fixed, 95% CI) | 0.90 [0.74, 1.11] |
| 5.13.1 Dexamethasone | 15 | 2661 | Risk Ratio (M‐H, Fixed, 95% CI) | 0.88 [0.69, 1.13] |
| 5.13.2 Hydrocortisone | 10 | 1389 | Risk Ratio (M‐H, Fixed, 95% CI) | 0.95 [0.66, 1.37] |
| 5.14 Gastrointestinal bleeding Show forest plot | 12 | 1816 | Risk Ratio (M‐H, Fixed, 95% CI) | 1.86 [1.35, 2.55] |
| 5.14.1 Dexamethasone | 10 | 1725 | Risk Ratio (M‐H, Fixed, 95% CI) | 1.87 [1.35, 2.58] |
| 5.14.2 Hydrocortisone | 2 | 91 | Risk Ratio (M‐H, Fixed, 95% CI) | 1.53 [0.27, 8.74] |
| 5.15 Gastrointestinal perforation Show forest plot | 16 | 3040 | Risk Ratio (M‐H, Fixed, 95% CI) | 1.84 [1.36, 2.49] |
| 5.15.1 Dexamethasone | 9 | 1936 | Risk Ratio (M‐H, Fixed, 95% CI) | 1.73 [1.20, 2.51] |
| 5.15.2 Hydrocortisone | 7 | 1104 | Risk Ratio (M‐H, Fixed, 95% CI) | 2.05 [1.21, 3.47] |
| 5.16 Pulmonary haemorrhage Show forest plot | 10 | 1820 | Risk Ratio (M‐H, Fixed, 95% CI) | 1.16 [0.87, 1.54] |
| 5.16.1 Dexamethasone | 7 | 686 | Risk Ratio (M‐H, Fixed, 95% CI) | 0.97 [0.65, 1.45] |
| 5.16.2 Hydrocortisone | 3 | 1134 | Risk Ratio (M‐H, Fixed, 95% CI) | 1.36 [0.92, 2.03] |
| 5.17 Any retinopathy of prematurity (ROP) Show forest plot | 9 | 1345 | Risk Ratio (M‐H, Fixed, 95% CI) | 0.88 [0.80, 0.97] |
| 5.17.1 Dexamethasone | 8 | 1042 | Risk Ratio (M‐H, Fixed, 95% CI) | 0.84 [0.72, 0.99] |
| 5.17.2 Hydrocortisone | 1 | 303 | Risk Ratio (M‐H, Fixed, 95% CI) | 0.93 [0.84, 1.04] |
| 5.18 Severe ROP Show forest plot | 14 | 2577 | Risk Ratio (M‐H, Fixed, 95% CI) | 0.81 [0.67, 0.99] |
| 5.18.1 Dexamethasone | 8 | 1507 | Risk Ratio (M‐H, Fixed, 95% CI) | 0.77 [0.60, 0.99] |
| 5.18.2 Hydrocortisone | 6 | 1070 | Risk Ratio (M‐H, Fixed, 95% CI) | 0.89 [0.65, 1.23] |
| 5.19 Severe ROP in survivors Show forest plot | 12 | 1575 | Risk Ratio (M‐H, Fixed, 95% CI) | 0.77 [0.64, 0.94] |
| 5.19.1 Dexamethasone | 10 | 1238 | Risk Ratio (M‐H, Fixed, 95% CI) | 0.75 [0.59, 0.95] |
| 5.19.2 Hydrocortisone | 2 | 337 | Risk Ratio (M‐H, Fixed, 95% CI) | 0.83 [0.60, 1.17] |
| Outcome or subgroup title | No. of studies | No. of participants | Statistical method | Effect size |
| 6.1 Bayley Mental Developmental Index (MDI) < ‐2 SD Show forest plot | 3 | 842 | Risk Ratio (M‐H, Fixed, 95% CI) | 1.00 [0.78, 1.29] |
| 6.2 Bayley MDI < ‐2 SD in tested survivors Show forest plot | 3 | 528 | Risk Ratio (M‐H, Fixed, 95% CI) | 1.00 [0.79, 1.25] |
| 6.3 Bayley Psychomotor Developmental Index (PDI) < ‐2 SD Show forest plot | 3 | 842 | Risk Ratio (M‐H, Fixed, 95% CI) | 1.17 [0.85, 1.60] |
| 6.4 Bayley PDI < ‐2 SD in tested survivors Show forest plot | 3 | 528 | Risk Ratio (M‐H, Fixed, 95% CI) | 1.17 [0.87, 1.57] |
| 6.5 Developmental delay (other criteria) Show forest plot | 2 | 769 | Risk Ratio (M‐H, Fixed, 95% CI) | 1.37 [0.93, 2.03] |
| 6.5.1 Dexamethasone | 1 | 248 | Risk Ratio (M‐H, Fixed, 95% CI) | 1.68 [1.08, 2.61] |
| 6.5.2 Hydrocortisone | 1 | 521 | Risk Ratio (M‐H, Fixed, 95% CI) | 0.66 [0.26, 1.69] |
| 6.6 Developmental delay (other criteria) in tested survivors Show forest plot | 2 | 538 | Risk Ratio (M‐H, Fixed, 95% CI) | 1.50 [1.05, 2.15] |
| 6.6.1 Dexamethasone | 1 | 159 | Risk Ratio (M‐H, Fixed, 95% CI) | 1.94 [1.30, 2.88] |
| 6.6.2 Hydrocortisone | 1 | 379 | Risk Ratio (M‐H, Fixed, 95% CI) | 0.61 [0.24, 1.53] |
| 6.7 Blindness Show forest plot | 9 | 1318 | Risk Ratio (M‐H, Fixed, 95% CI) | 2.01 [0.74, 5.50] |
| 6.7.1 Dexamethasone | 6 | 862 | Risk Ratio (M‐H, Fixed, 95% CI) | 2.01 [0.74, 5.50] |
| 6.7.2 Hydrocortisone | 3 | 456 | Risk Ratio (M‐H, Fixed, 95% CI) | Not estimable |
| 6.8 Blindness in survivors assessed Show forest plot | 9 | 964 | Risk Ratio (M‐H, Fixed, 95% CI) | 2.16 [0.80, 5.86] |
| 6.8.1 Dexamethasone | 6 | 532 | Risk Ratio (M‐H, Fixed, 95% CI) | 2.16 [0.80, 5.86] |
| 6.8.2 Hydrocortisone | 3 | 432 | Risk Ratio (M‐H, Fixed, 95% CI) | Not estimable |
| 6.9 Deafness Show forest plot | 9 | 1100 | Risk Ratio (M‐H, Fixed, 95% CI) | 1.14 [0.39, 3.37] |
| 6.9.1 Dexamethasone | 5 | 600 | Risk Ratio (M‐H, Fixed, 95% CI) | 0.97 [0.30, 3.14] |
| 6.9.2 Hydrocortisone | 4 | 500 | Risk Ratio (M‐H, Fixed, 95% CI) | 3.12 [0.13, 73.06] |
| 6.10 Deafness in survivors assessed Show forest plot | 8 | 476 | Risk Ratio (M‐H, Fixed, 95% CI) | 1.14 [0.40, 3.29] |
| 6.11 Cerebral palsy Show forest plot | 13 | 1973 | Risk Ratio (IV, Fixed, 95% CI) | 1.43 [1.07, 1.92] |
| 6.11.1 Dexamethasone | 7 | 921 | Risk Ratio (IV, Fixed, 95% CI) | 1.77 [1.21, 2.58] |
| 6.11.2 Hydrocortisone | 6 | 1052 | Risk Ratio (IV, Fixed, 95% CI) | 1.05 [0.66, 1.66] |
| 6.12 Death before follow‐up in trials assessing cerebral palsy Show forest plot | 13 | 1973 | Risk Ratio (M‐H, Fixed, 95% CI) | 0.90 [0.78, 1.05] |
| 6.12.1 Dexamethasone | 7 | 921 | Risk Ratio (M‐H, Fixed, 95% CI) | 0.99 [0.81, 1.21] |
| 6.12.2 Hydrocortisone | 6 | 1052 | Risk Ratio (M‐H, Fixed, 95% CI) | 0.81 [0.64, 1.02] |
| 6.13 Death or cerebral palsy Show forest plot | 13 | 1973 | Risk Ratio (M‐H, Fixed, 95% CI) | 1.03 [0.91, 1.16] |
| 6.13.1 Dexamethasone | 7 | 921 | Risk Ratio (M‐H, Fixed, 95% CI) | 1.18 [1.01, 1.37] |
| 6.13.2 Hydrocortisone | 6 | 1052 | Risk Ratio (M‐H, Fixed, 95% CI) | 0.86 [0.71, 1.05] |
| 6.14 Cerebral palsy in survivors assessed Show forest plot | 13 | 1329 | Risk Ratio (M‐H, Fixed, 95% CI) | 1.47 [1.12, 1.92] |
| 6.14.1 Dexamethasone | 7 | 587 | Risk Ratio (M‐H, Fixed, 95% CI) | 1.85 [1.31, 2.61] |
| 6.14.2 Hydrocortisone | 6 | 742 | Risk Ratio (M‐H, Fixed, 95% CI) | 1.01 [0.65, 1.58] |
| 6.15 Major neurosensory disability (variable criteria ‐ see individual studies) Show forest plot | 7 | 1703 | Risk Ratio (M‐H, Fixed, 95% CI) | 1.08 [0.89, 1.33] |
| 6.15.1 Dexamethasone | 4 | 772 | Risk Ratio (M‐H, Fixed, 95% CI) | 1.37 [1.03, 1.83] |
| 6.15.2 Hydrocortisone | 3 | 931 | Risk Ratio (M‐H, Fixed, 95% CI) | 0.86 [0.64, 1.14] |
| 6.16 Death before follow‐up in trials assessing major neurosensory disability (variable criteria) Show forest plot | 8 | 1754 | Risk Ratio (M‐H, Fixed, 95% CI) | 0.91 [0.77, 1.06] |
| 6.16.1 Dexamethasone | 4 | 772 | Risk Ratio (M‐H, Fixed, 95% CI) | 1.02 [0.82, 1.25] |
| 6.16.2 Hydrocortisone | 4 | 982 | Risk Ratio (M‐H, Fixed, 95% CI) | 0.79 [0.62, 1.01] |
| 6.17 Death or major neurosensory disability (variable criteria) Show forest plot | 7 | 1703 | Risk Ratio (M‐H, Fixed, 95% CI) | 0.97 [0.87, 1.08] |
| 6.17.1 Dexamethasone | 4 | 772 | Risk Ratio (M‐H, Fixed, 95% CI) | 1.13 [0.99, 1.30] |
| 6.17.2 Hydrocortisone | 3 | 931 | Risk Ratio (M‐H, Fixed, 95% CI) | 0.82 [0.69, 0.97] |
| 6.18 Major neurosensory disability in survivors examined (variable criteria) Show forest plot | 8 | 1178 | Risk Ratio (M‐H, Fixed, 95% CI) | 1.07 [0.89, 1.28] |
| 6.18.1 Dexamethasone | 4 | 469 | Risk Ratio (M‐H, Fixed, 95% CI) | 1.36 [1.05, 1.77] |
| 6.18.2 Hydrocortisone | 4 | 709 | Risk Ratio (M‐H, Fixed, 95% CI) | 0.84 [0.65, 1.10] |
| 6.19 Abnormal neurological exam (variable criteria ‐ see individual studies) Show forest plot | 5 | 829 | Risk Ratio (M‐H, Fixed, 95% CI) | 1.81 [1.33, 2.47] |
| 6.20 Death before follow‐up in trials assessing abnormal neurological exam (variable criteria) Show forest plot | 6 | 1350 | Risk Ratio (M‐H, Fixed, 95% CI) | 0.89 [0.75, 1.07] |
| 6.20.1 Dexamethasone | 5 | 829 | Risk Ratio (M‐H, Fixed, 95% CI) | 0.97 [0.79, 1.21] |
| 6.20.2 Hydrocortisone | 1 | 521 | Risk Ratio (M‐H, Fixed, 95% CI) | 0.75 [0.54, 1.04] |
| 6.21 Death or abnormal neurological exam (variable criteria) Show forest plot | 5 | 829 | Risk Ratio (M‐H, Fixed, 95% CI) | 1.23 [1.06, 1.42] |
| 6.22 Abnormal neurological exam in tested survivors (variable criteria) Show forest plot | 5 | 508 | Risk Ratio (M‐H, Fixed, 95% CI) | 1.89 [1.41, 2.52] |
| 6.23 Intellectual impairment (IQ < 70) Show forest plot | 3 | 125 | Risk Ratio (M‐H, Fixed, 95% CI) | 1.46 [0.64, 3.33] |
| 6.23.1 Dexamethasone | 2 | 90 | Risk Ratio (M‐H, Fixed, 95% CI) | 1.37 [0.57, 3.31] |
| 6.23.2 Hydrocortisone | 1 | 35 | Risk Ratio (M‐H, Fixed, 95% CI) | 2.12 [0.21, 21.27] |
| 6.24 Intellectual impairment (IQ < 70) in survivors assessed Show forest plot | 2 | 76 | Risk Ratio (M‐H, Fixed, 95% CI) | 1.12 [0.47, 2.65] |
| 6.25 "Major neurosensory impairment" ‐ blindness or deafness Show forest plot | 1 | 50 | Risk Ratio (M‐H, Fixed, 95% CI) | 0.60 [0.16, 2.25] |
| 6.26 "Major neurosensory impairment" ‐ blindness or deafness ‐ in survivors assessed Show forest plot | 1 | 45 | Risk Ratio (M‐H, Fixed, 95% CI) | 0.57 [0.16, 2.12] |
| 6.27 Behaviour abnormalities Show forest plot | 1 | 50 | Risk Ratio (M‐H, Fixed, 95% CI) | 0.60 [0.16, 2.25] |
| 6.28 Behaviour abnormalities in 3‐year‐old survivors assessed Show forest plot | 1 | 46 | Risk Ratio (M‐H, Fixed, 95% CI) | 0.60 [0.16, 2.22] |
| 6.29 Abnormal EEG Show forest plot | 2 | 306 | Risk Ratio (M‐H, Fixed, 95% CI) | 1.24 [0.66, 2.33] |
| 6.30 Abnormal EEG in tested survivors Show forest plot | 2 | 146 | Risk Ratio (M‐H, Fixed, 95% CI) | 1.13 [0.61, 2.08] |
| 6.31 Re‐hospitalisation in infancy Show forest plot | 3 | 672 | Risk Ratio (M‐H, Fixed, 95% CI) | 0.86 [0.68, 1.08] |
| 6.32 Re‐hospitalisation in infancy in survivors Show forest plot | 3 | 430 | Risk Ratio (M‐H, Fixed, 95% CI) | 0.87 [0.71, 1.07] |
| Outcome or subgroup title | No. of studies | No. of participants | Statistical method | Effect size |
| 7.1 Mortality to latest age Show forest plot | 11 | 1433 | Risk Ratio (M‐H, Fixed, 95% CI) | 0.80 [0.65, 0.99] |
| 7.1.1 Lung | 7 | 1319 | Risk Ratio (M‐H, Fixed, 95% CI) | 0.82 [0.66, 1.01] |
| 7.1.2 Blood pressure | 4 | 114 | Risk Ratio (M‐H, Fixed, 95% CI) | 0.58 [0.24, 1.38] |
| 7.2 Bronchopulmonary dysplasia at 36 weeks Show forest plot | 9 | 1152 | Risk Ratio (M‐H, Fixed, 95% CI) | 0.90 [0.80, 1.02] |
| 7.2.1 Lung | 6 | 1058 | Risk Ratio (M‐H, Fixed, 95% CI) | 0.89 [0.79, 1.02] |
| 7.2.2 Blood pressure | 3 | 94 | Risk Ratio (M‐H, Fixed, 95% CI) | 1.01 [0.66, 1.54] |
| 7.3 Mortality or bronchopulmonary dysplasia at 36 weeks Show forest plot | 7 | 1297 | Risk Ratio (M‐H, Fixed, 95% CI) | 0.89 [0.80, 0.98] |
| 7.3.1 Lung | 6 | 1275 | Risk Ratio (M‐H, Fixed, 95% CI) | 0.90 [0.81, 0.99] |
| 7.3.2 Blood pressure | 1 | 22 | Risk Ratio (M‐H, Fixed, 95% CI) | 0.44 [0.19, 1.02] |