Administración posnatal temprana (< 8 días) de corticosteroides sistémicos para la prevención de la displasia broncopulmonar en lactantes prematuros
Información
- DOI:
- https://doi.org/10.1002/14651858.CD001146.pub5Copiar DOI

- Base de datos:
-
- Cochrane Database of Systematic Reviews
- Versión publicada:
-
- 24 octubre 2017see what's new
- Tipo:
-
- Intervention
- Etapa:
-
- Review
- Grupo Editorial Cochrane:
-
Grupo Cochrane de Neonatología
- Copyright:
-
- Copyright © 2018 The Cochrane Collaboration. Published by John Wiley & Sons, Ltd.
Cifras del artículo
Altmetric:
Citado por:
Autores
Contributions of authors
Lex Doyle collated data concerning long‐term neurosensory outcomes; he assisted Henry Halliday and Richard Ehrenkranz in identifying all studies, synthesising the data, and writing earlier versions of this review. Richard Ehrenkranz assisted Henry Halliday in identifying all studies, synthesising the data, and writing earlier versions of this review. Henry Halliday identified all studies, synthesised the data, and wrote earlier versions of this review. Jeanie Cheong assisted Lex Doyle in identifying all studies in the most recent literature search, synthesising the data, and writing the current version of this review.
Sources of support
Internal sources
-
Action Research UK Grant to study effects of postnatal steroids, UK.
-
Action Research UK Grant to study long‐term follow‐up, UK.
External sources
-
National Health and Medical Research Council, Australia.
Declarations of interest
Lex Doyle was Chief Investigator in the DART study, a randomised controlled trial of low‐dose, short‐course dexamethasone in ventilator‐dependent infants that was funded by the National Health and Medical Research Council of Australia.
Henry Halliday (HLH) is a retired neonatologist. He is joint Editor‐in‐Chief of the journal Neonatology and sits on many Data Monitoring and Trial Steering Committees for various neonatal/perinatal trials. He has received support in the past for co‐ordinating the OSECT study (2000), for which AstraZeneca (Sweden) supplied metered‐dose inhalers of budesonide and placebo. HLH also acts as a consultant for Chiesi Farmiceutici (Italy), a company that sells two neonatal drugs ‐ Curosurf (a surfactant to treat respiratory distress syndrome) and Peyona (a caffeine preparation to treat apnoea of prematurity).
Acknowledgements
None noted.
Version history
| Published | Title | Stage | Authors | Version |
| 2021 Oct 21 | Early (< 7 days) systemic postnatal corticosteroids for prevention of bronchopulmonary dysplasia in preterm infants | Review | Lex W Doyle, Jeanie L Cheong, Susanne Hay, Brett J Manley, Henry L Halliday, Roger Soll | |
| 2017 Oct 24 | Early (< 8 days) systemic postnatal corticosteroids for prevention of bronchopulmonary dysplasia in preterm infants | Review | Lex W Doyle, Jeanie L Cheong, Richard A Ehrenkranz, Henry L Halliday | |
| 2014 May 13 | Early (< 8 days) postnatal corticosteroids for preventing chronic lung disease in preterm infants | Review | Lex W Doyle, Richard A Ehrenkranz, Henry L Halliday | |
| 2010 Jan 20 | Early (< 8 days) postnatal corticosteroids for preventing chronic lung disease in preterm infants | Review | Henry L Halliday, Richard A Ehrenkranz, Lex W Doyle | |
| 2009 Jan 21 | Early (< 8 days) postnatal corticosteroids for preventing chronic lung disease in preterm infants | Review | Henry L Halliday, Richard A Ehrenkranz, Lex W Doyle | |
| 2003 Jan 20 | Early postnatal (<96 hours) corticosteroids for preventing chronic lung disease in preterm infants | Review | Henry L Halliday, Richard A Ehrenkranz, L W Doyle, LEX W DOYLE | |
Differences between protocol and review
We added the methods and plan for 'Summary of findings' tables and GRADE recommendations, which were not included in the original protocol nor in the last version of this review. For the 2017 update, we changed the title to "Early (< 8 days) systemic postnatal corticosteroids for prevention of bronchopulmonary dysplasia in preterm infants."
Keywords
MeSH
Medical Subject Headings (MeSH) Keywords
- Administration, Inhalation;
- Anti‐Inflammatory Agents [adverse effects, *therapeutic use];
- Bronchopulmonary Dysplasia [*prevention & control];
- Cerebral Palsy [epidemiology];
- Chronic Disease;
- Dexamethasone [adverse effects, *therapeutic use];
- Drug Administration Schedule;
- Glucocorticoids [adverse effects, *therapeutic use];
- Hydrocortisone [adverse effects, *therapeutic use];
- Infant, Low Birth Weight;
- Infant, Premature;
- Intestinal Perforation [epidemiology];
- Oxygen Inhalation Therapy [statistics & numerical data];
- Randomized Controlled Trials as Topic;
- Time Factors;
Medical Subject Headings Check Words
Humans; Infant, Newborn;
PICO
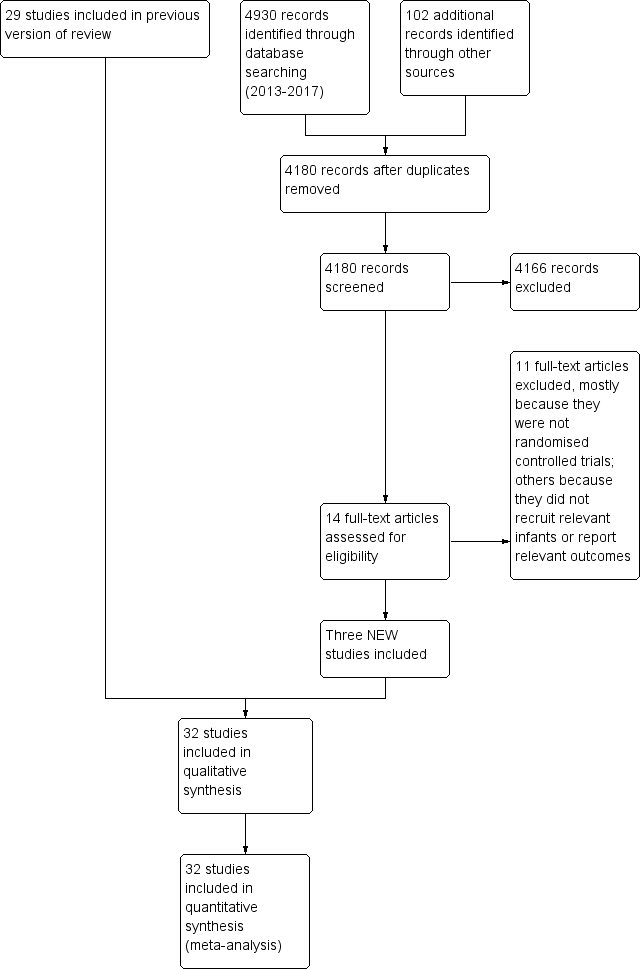
Study flow diagram: review update.
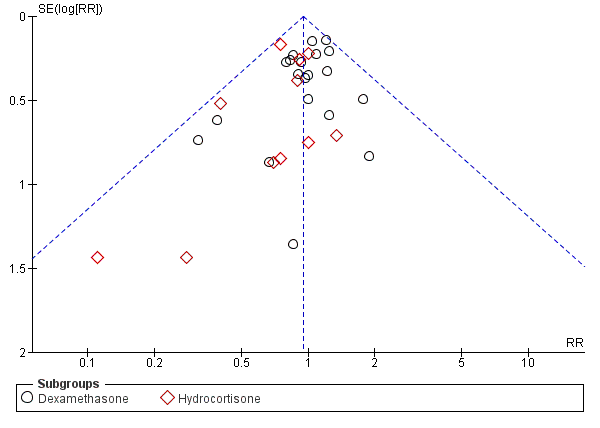
Funnel plot of comparison: 1 Mortality, outcome: 1.4 Mortality at latest reported age.
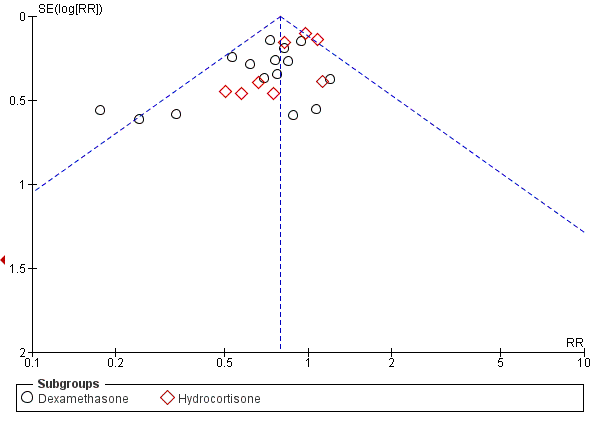
Funnel plot of comparison: 2 Bronchopulmonary dysplasia (BPD), outcome: 2.2 BPD (36 weeks' postmenstrual age).
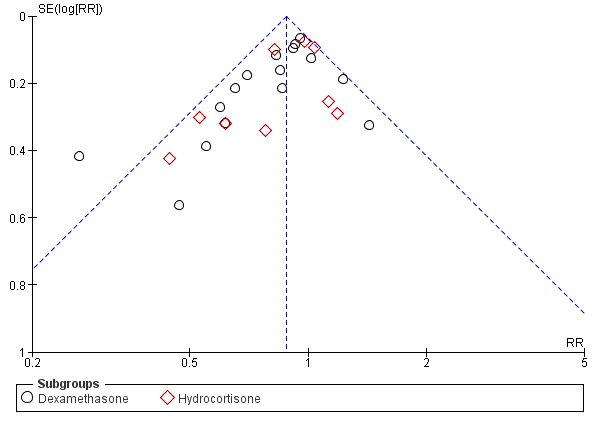
Funnel plot of comparison: 3 Death or bronchopulmonary dysplasia (BPD), outcome: 3.2 Death or BPD at 36 weeks' postmenstrual age.

Funnel plot of comparison: 6 Long‐term follow‐up, outcome: 6.11 Cerebral palsy.

Comparison 1 Mortality, Outcome 1 Neonatal mortality (up to 28 days).
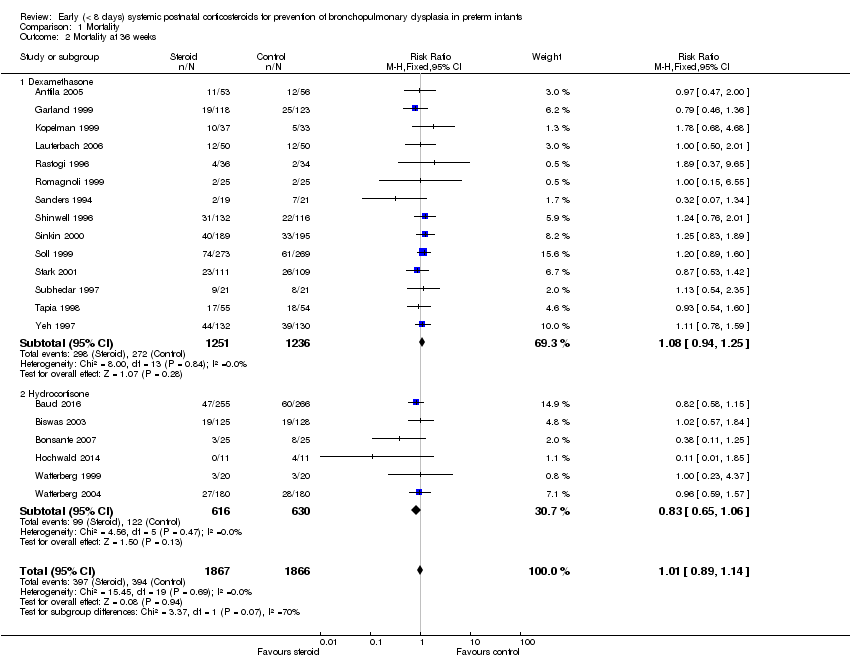
Comparison 1 Mortality, Outcome 2 Mortality at 36 weeks.
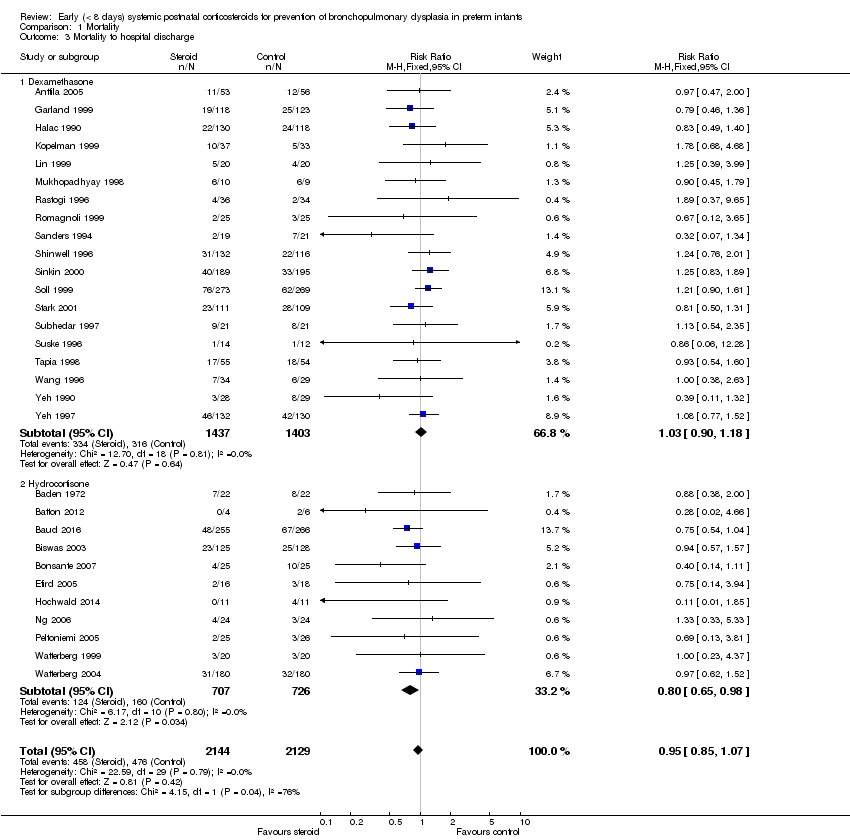
Comparison 1 Mortality, Outcome 3 Mortality to hospital discharge.
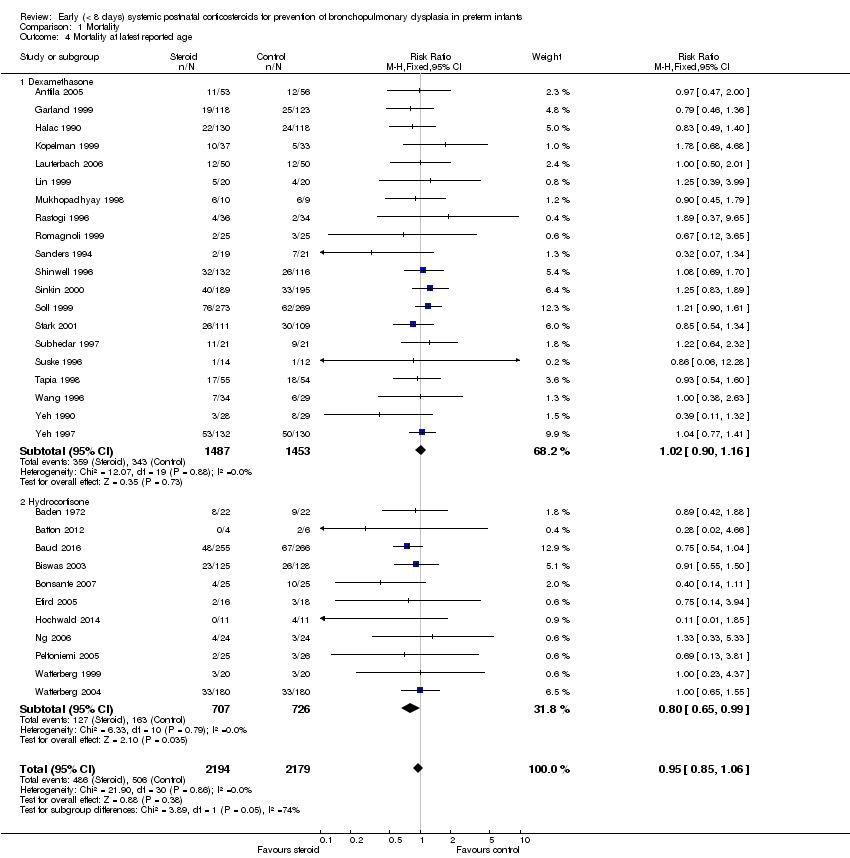
Comparison 1 Mortality, Outcome 4 Mortality at latest reported age.

Comparison 2 Bronchopulmonary dysplasia (BPD), Outcome 1 BPD (28 days of life).
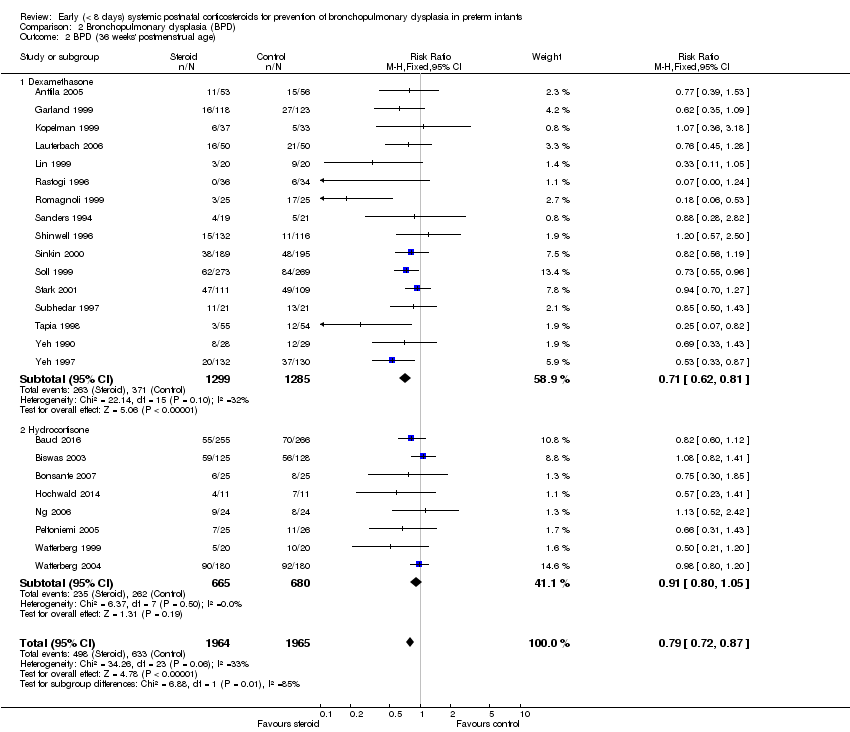
Comparison 2 Bronchopulmonary dysplasia (BPD), Outcome 2 BPD (36 weeks' postmenstrual age).
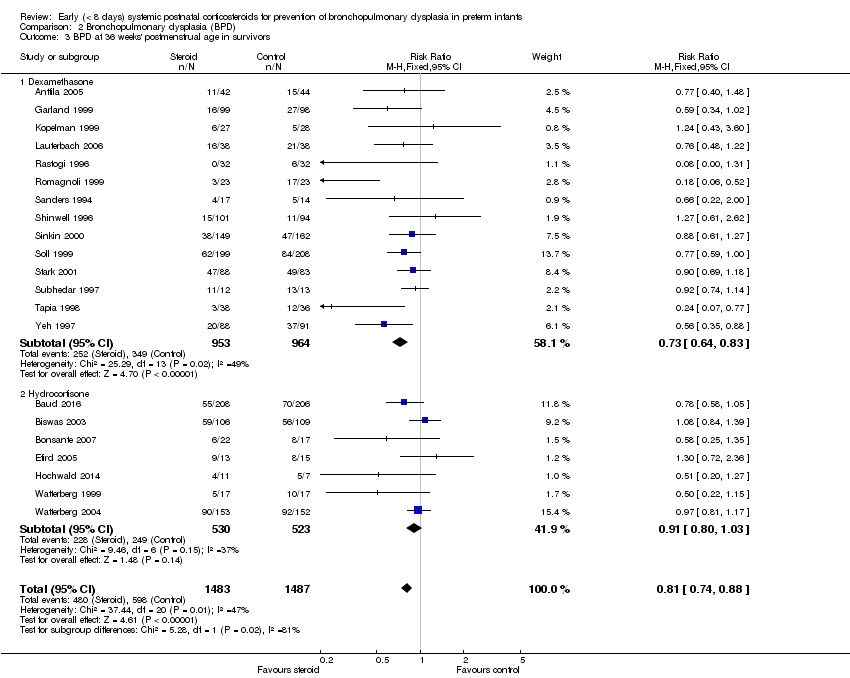
Comparison 2 Bronchopulmonary dysplasia (BPD), Outcome 3 BPD at 36 weeks' postmenstrual age in survivors.
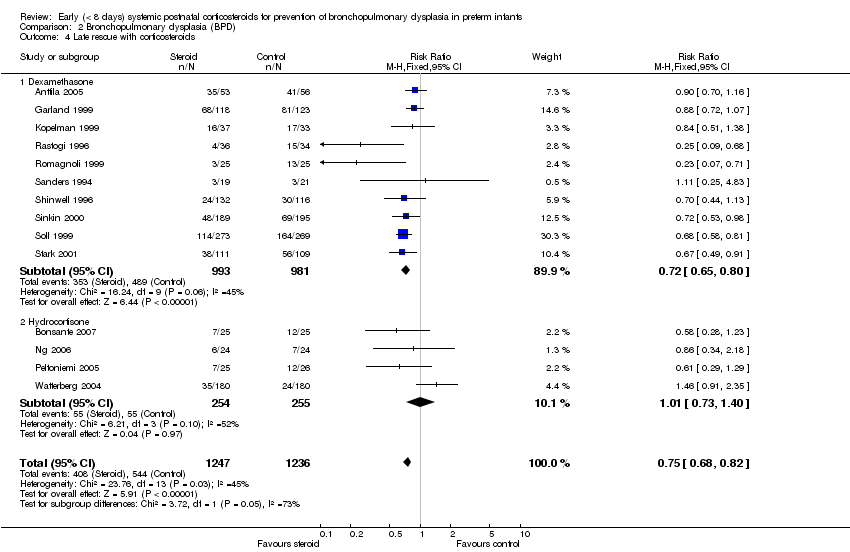
Comparison 2 Bronchopulmonary dysplasia (BPD), Outcome 4 Late rescue with corticosteroids.
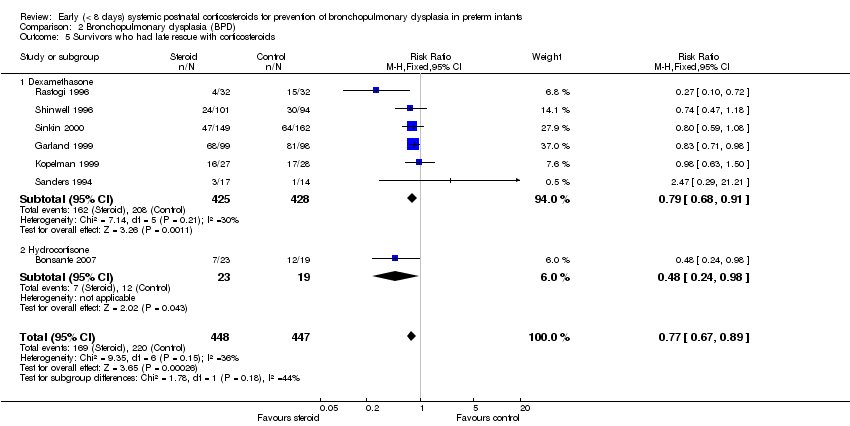
Comparison 2 Bronchopulmonary dysplasia (BPD), Outcome 5 Survivors who had late rescue with corticosteroids.
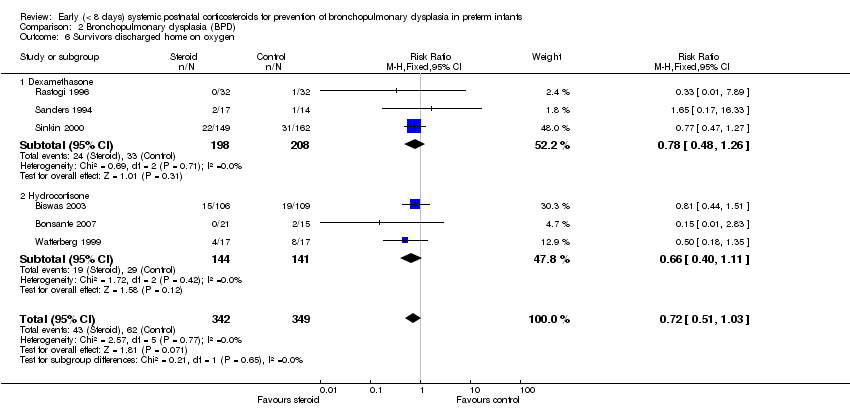
Comparison 2 Bronchopulmonary dysplasia (BPD), Outcome 6 Survivors discharged home on oxygen.

Comparison 3 Death or bronchopulmonary dysplasia (BPD), Outcome 1 Death or BPD at 28 days of life.
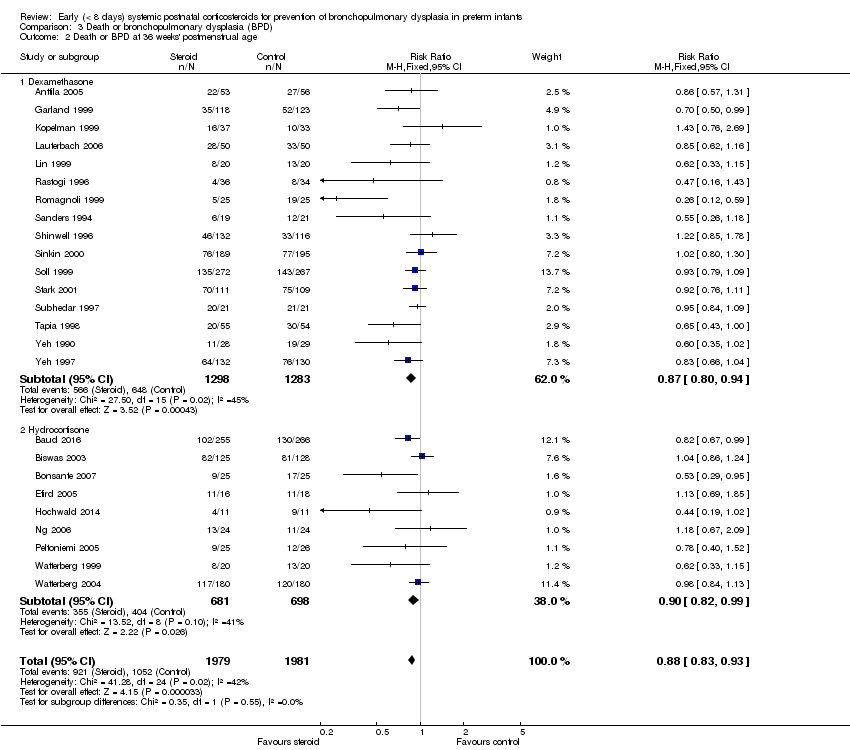
Comparison 3 Death or bronchopulmonary dysplasia (BPD), Outcome 2 Death or BPD at 36 weeks' postmenstrual age.
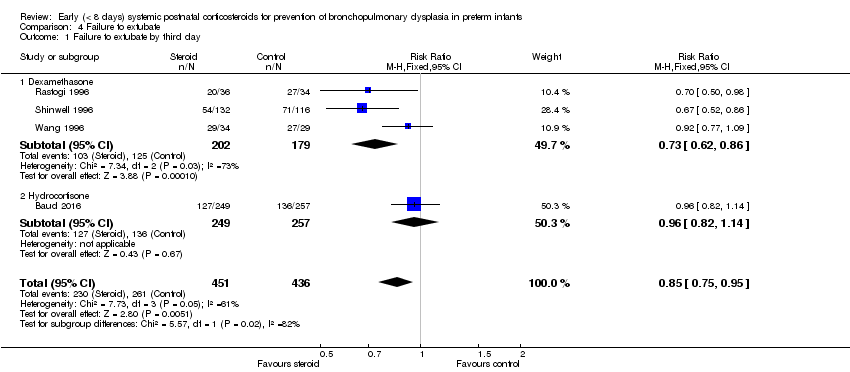
Comparison 4 Failure to extubate, Outcome 1 Failure to extubate by third day.

Comparison 4 Failure to extubate, Outcome 2 Failure to extubate by seventh day.
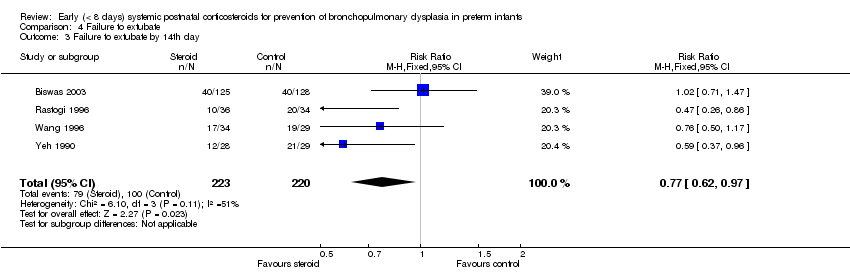
Comparison 4 Failure to extubate, Outcome 3 Failure to extubate by 14th day.

Comparison 4 Failure to extubate, Outcome 4 Failure to extubate by 28th day.

Comparison 5 Complications during primary hospitalisation, Outcome 1 Infection.

Comparison 5 Complications during primary hospitalisation, Outcome 2 Hyperglycaemia.
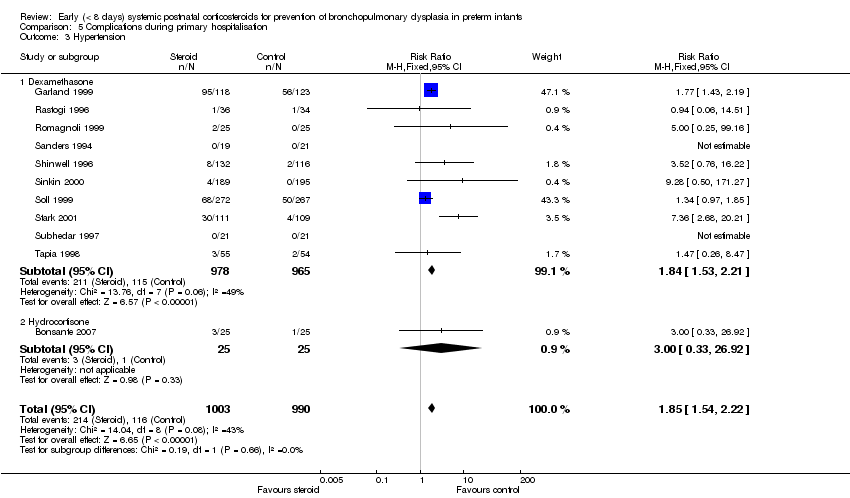
Comparison 5 Complications during primary hospitalisation, Outcome 3 Hypertension.

Comparison 5 Complications during primary hospitalisation, Outcome 4 Hypertrophic cardiomyopathy.

Comparison 5 Complications during primary hospitalisation, Outcome 5 Growth failure.

Comparison 5 Complications during primary hospitalisation, Outcome 6 Pulmonary air leak.

Comparison 5 Complications during primary hospitalisation, Outcome 7 Patent ductus arteriosus (PDA).

Comparison 5 Complications during primary hospitalisation, Outcome 8 Severe IVH.
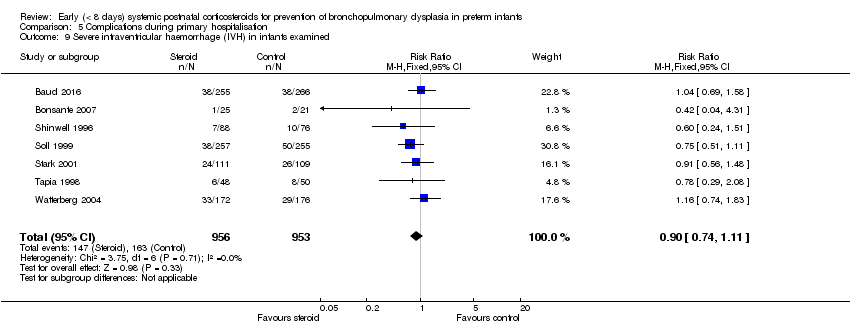
Comparison 5 Complications during primary hospitalisation, Outcome 9 Severe intraventricular haemorrhage (IVH) in infants examined.

Comparison 5 Complications during primary hospitalisation, Outcome 10 Periventricular leukomalacia (PVL).

Comparison 5 Complications during primary hospitalisation, Outcome 11 PVL in infants with cranial ultrasound scans.

Comparison 5 Complications during primary hospitalisation, Outcome 12 PVL in survivors seen at follow‐up.
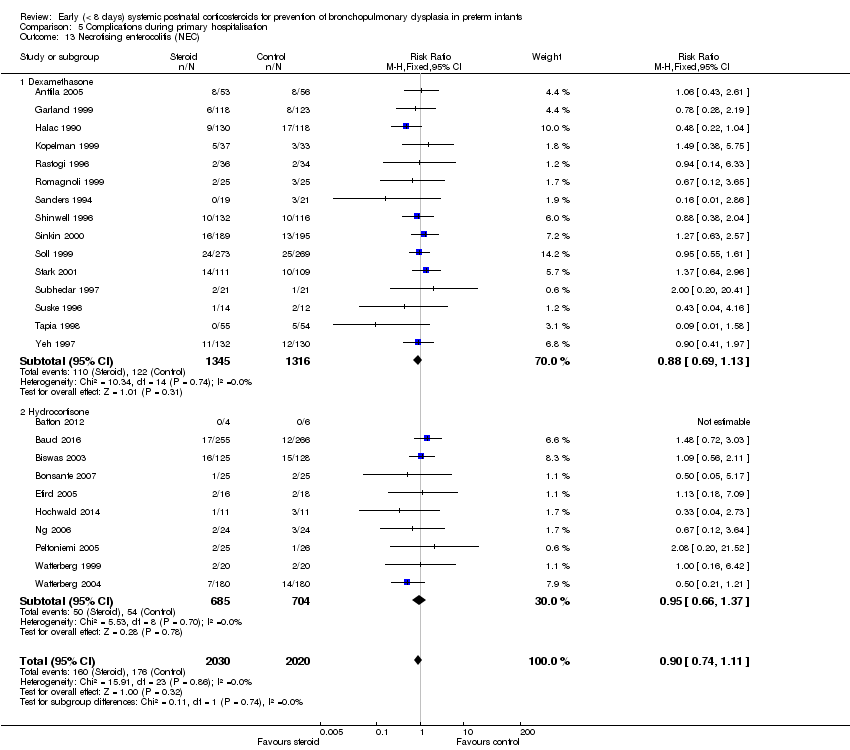
Comparison 5 Complications during primary hospitalisation, Outcome 13 Necrotising enterocolitis (NEC).

Comparison 5 Complications during primary hospitalisation, Outcome 14 Gastrointestinal bleeding.

Comparison 5 Complications during primary hospitalisation, Outcome 15 Gastrointestinal perforation.
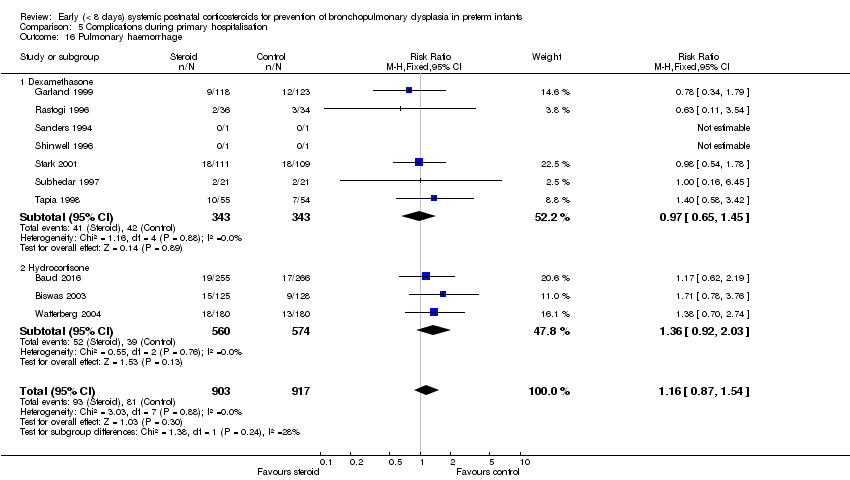
Comparison 5 Complications during primary hospitalisation, Outcome 16 Pulmonary haemorrhage.
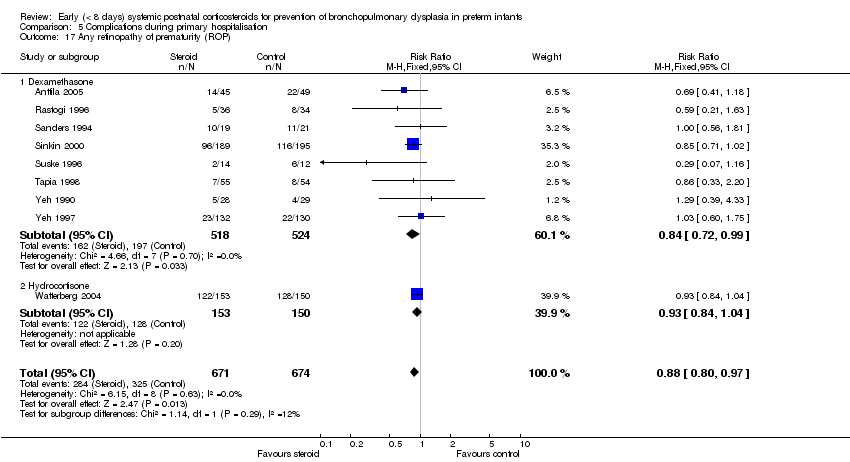
Comparison 5 Complications during primary hospitalisation, Outcome 17 Any retinopathy of prematurity (ROP).
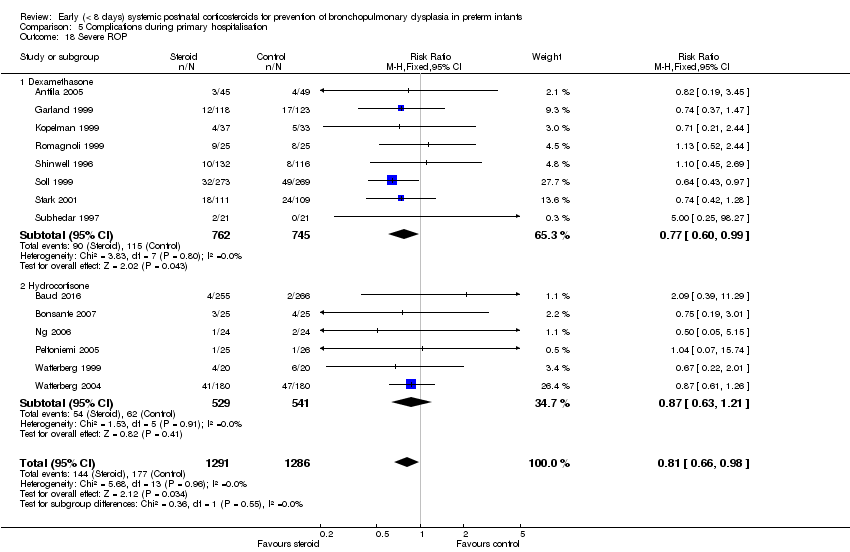
Comparison 5 Complications during primary hospitalisation, Outcome 18 Severe ROP.

Comparison 5 Complications during primary hospitalisation, Outcome 19 Severe ROP in survivors.

Comparison 6 Long‐term follow‐up, Outcome 1 Bayley Mental Developmental Index (MDI) <‐2 SD.
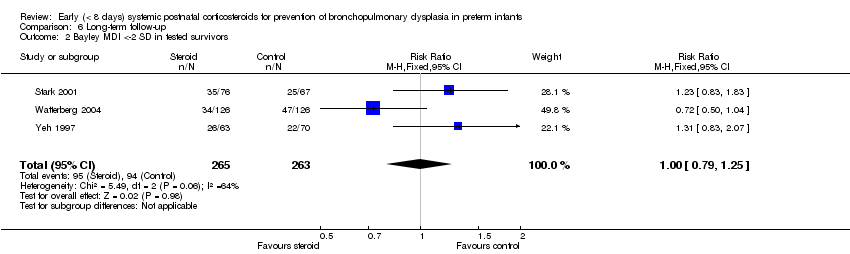
Comparison 6 Long‐term follow‐up, Outcome 2 Bayley MDI <‐2 SD in tested survivors.
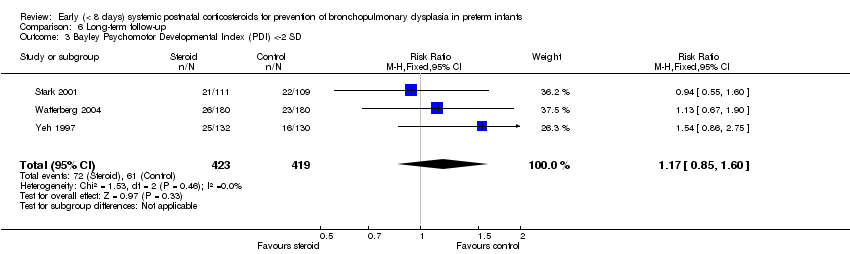
Comparison 6 Long‐term follow‐up, Outcome 3 Bayley Psychomotor Developmental Index (PDI) <‐2 SD.

Comparison 6 Long‐term follow‐up, Outcome 4 Bayley PDI <‐2 SD in tested survivors.

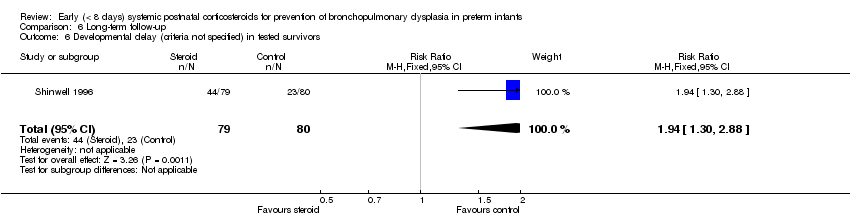
Comparison 6 Long‐term follow‐up, Outcome 5 Developmental delay (criteria not specified).
Comparison 6 Long‐term follow‐up, Outcome 6 Developmental delay (criteria not specified) in tested survivors.

Comparison 6 Long‐term follow‐up, Outcome 7 Blindness.

Comparison 6 Long‐term follow‐up, Outcome 8 Blindness in survivors assessed.
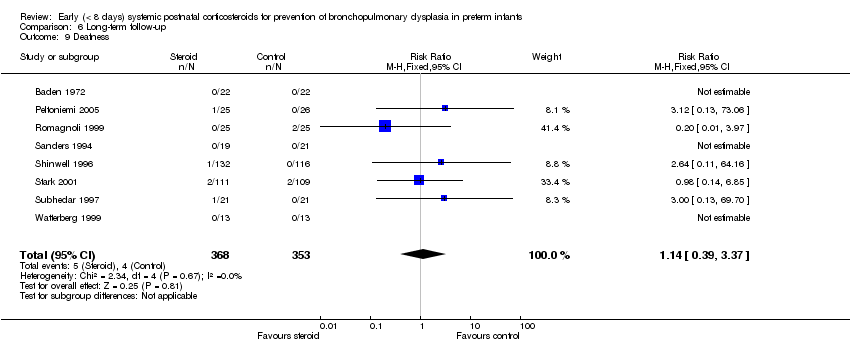
Comparison 6 Long‐term follow‐up, Outcome 9 Deafness.

Comparison 6 Long‐term follow‐up, Outcome 10 Deafness in survivors assessed.
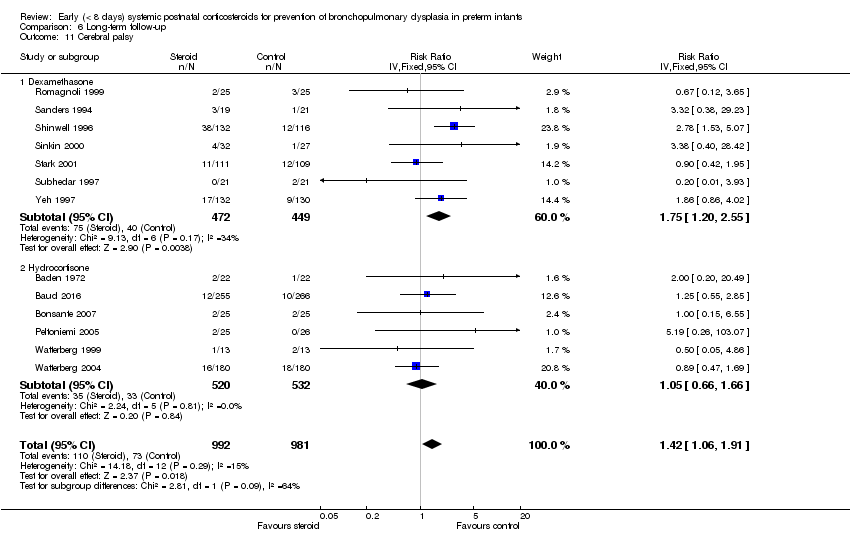
Comparison 6 Long‐term follow‐up, Outcome 11 Cerebral palsy.

Comparison 6 Long‐term follow‐up, Outcome 12 Death before follow‐up in trials assessing cerebral palsy.
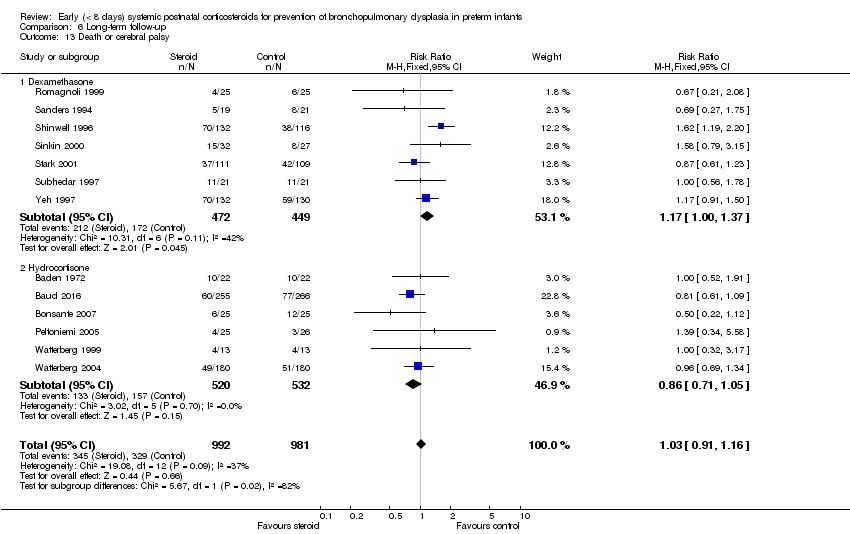
Comparison 6 Long‐term follow‐up, Outcome 13 Death or cerebral palsy.

Comparison 6 Long‐term follow‐up, Outcome 14 Cerebral palsy in survivors assessed.
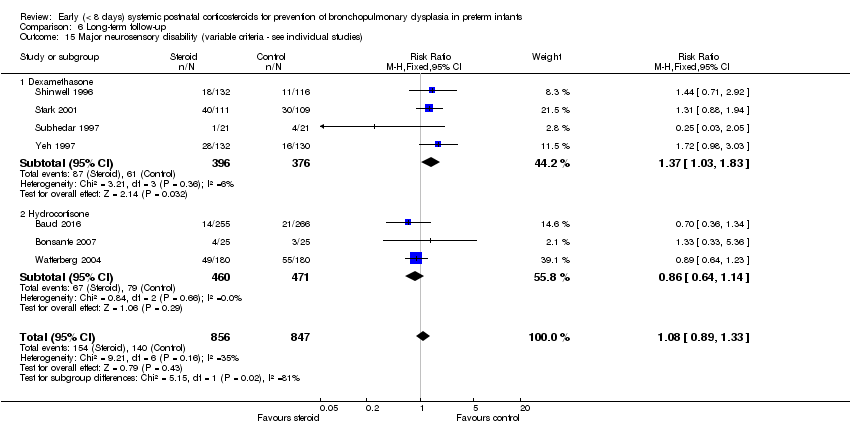
Comparison 6 Long‐term follow‐up, Outcome 15 Major neurosensory disability (variable criteria ‐ see individual studies).

Comparison 6 Long‐term follow‐up, Outcome 16 Death before follow‐up in trials assessing major neurosensory disability (variable criteria).
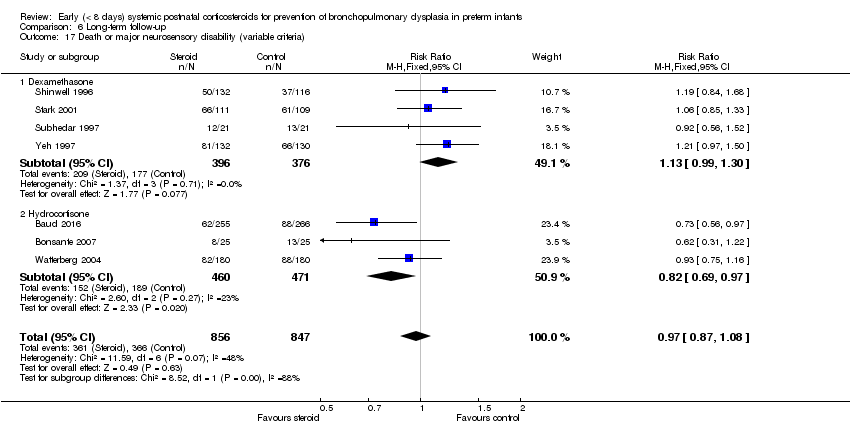
Comparison 6 Long‐term follow‐up, Outcome 17 Death or major neurosensory disability (variable criteria).
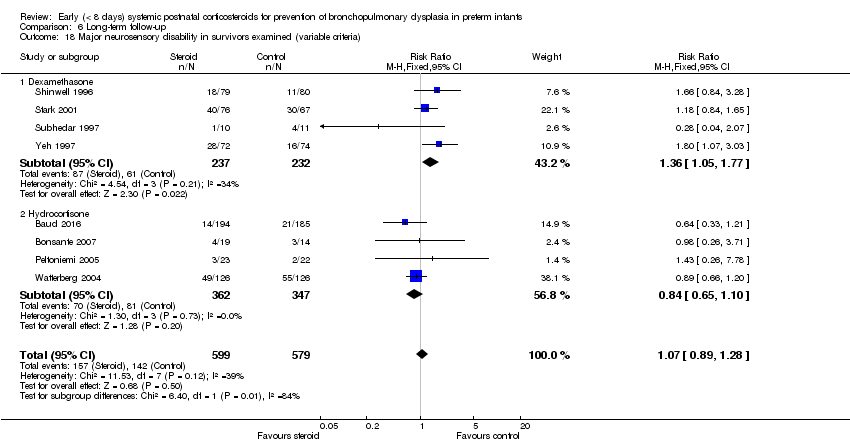
Comparison 6 Long‐term follow‐up, Outcome 18 Major neurosensory disability in survivors examined (variable criteria).
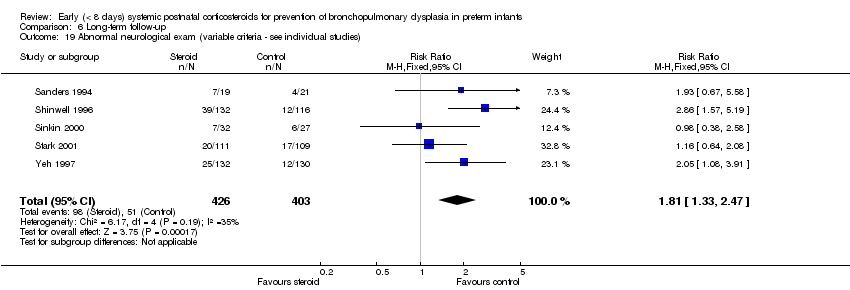
Comparison 6 Long‐term follow‐up, Outcome 19 Abnormal neurological exam (variable criteria ‐ see individual studies).
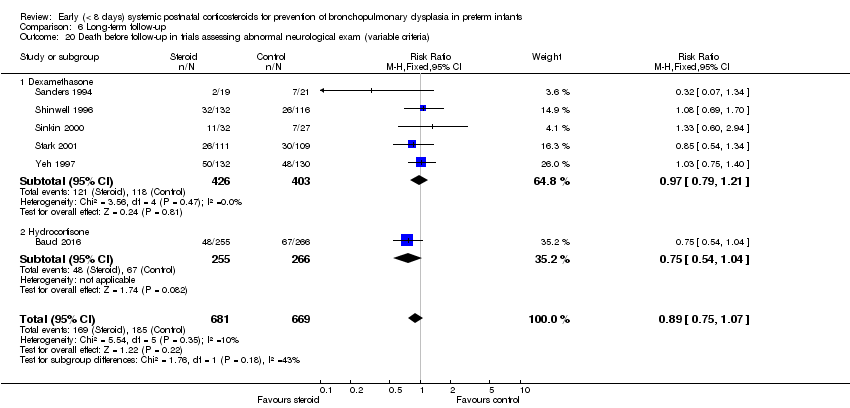
Comparison 6 Long‐term follow‐up, Outcome 20 Death before follow‐up in trials assessing abnormal neurological exam (variable criteria).
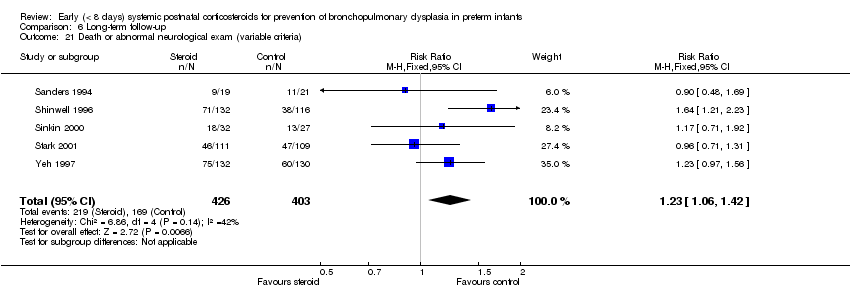
Comparison 6 Long‐term follow‐up, Outcome 21 Death or abnormal neurological exam (variable criteria).

Comparison 6 Long‐term follow‐up, Outcome 22 Abnormal neurological exam in tested survivors (variable criteria).

Comparison 6 Long‐term follow‐up, Outcome 23 Intellectual impairment (IQ < 70).

Comparison 6 Long‐term follow‐up, Outcome 24 Intellectual impairment (IQ < 70) in survivors assessed.

Comparison 6 Long‐term follow‐up, Outcome 25 "Major neurosensory impairment" ‐ blindness or deafness.

Comparison 6 Long‐term follow‐up, Outcome 26 "Major neurosensory impairment" ‐ blindness or deafness ‐ in survivors assessed.
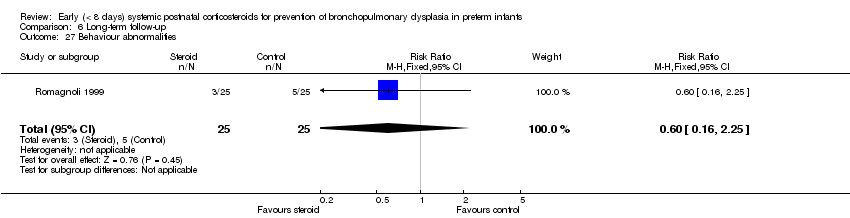
Comparison 6 Long‐term follow‐up, Outcome 27 Behaviour abnormalities.

Comparison 6 Long‐term follow‐up, Outcome 28 Behaviour abnormalities in 3‐year‐old survivors assessed.

Comparison 6 Long‐term follow‐up, Outcome 29 Abnormal EEG.

Comparison 6 Long‐term follow‐up, Outcome 30 Abnormal EEG in tested survivors.
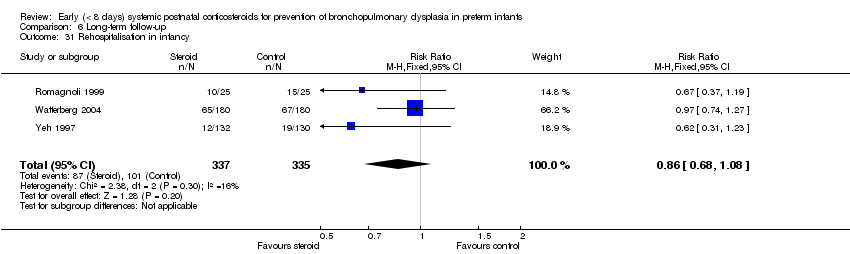
Comparison 6 Long‐term follow‐up, Outcome 31 Rehospitalisation in infancy.

Comparison 6 Long‐term follow‐up, Outcome 32 Rehospitalisation in infancy in survivors.
| Early systemic postnatal corticosteroids compared with placebo or no treatment for preventing bronchopulmonary dysplasia in preterm infants | ||||||
| Patient or population: preventing bronchopulmonary dysplasia in preterm infants | ||||||
| Outcomes | Anticipated absolute effects* (95% CI) | Relative effect | No. of participants | Quality of the evidence | Comments | |
| Risk with placebo or no treatment | Risk with early systemic postnatal corticosteroids | |||||
| Mortality at 36 weeks | Study population | RR 1.01 | 3733 | ⊕⊕⊕⊕ | ||
| 211 per 1000 | 213 per 1000 | |||||
| Mortality at latest reported age | Study population | RR 0.95 | 4373 | ⊕⊕⊕⊝ | ||
| 232 per 1000 | 221 per 1000 | |||||
| BPD (36 weeks) | Study population | RR 0.79 | 3929 | ⊕⊕⊕⊝ | ||
| 322 per 1000 | 254 per 1000 | |||||
| Death or BPD at 36 weeks | Study population | RR 0.88 | 3960 | ⊕⊕⊕⊝ | ||
| 531 per 1000 | 467 per 1000 | |||||
| Gastrointestinal perforation | Study population | RR 1.72 | 3040 | ⊕⊕⊕⊕ | ||
| 43 per 1000 | 74 per 1000 | |||||
| Cerebral palsy | Study population | RR 1.42 | 1973 | ⊕⊕⊕⊕ | ||
| 74 per 1000 | 106 per 1000 | |||||
| Death or cerebral palsy | Study population | RR 1.03 | 1973 | ⊕⊕⊕⊝ | ||
| 335 per 1000 | 345 per 1000 | |||||
| *The risk in the intervention group (and its 95% confidence interval) is based on assumed risk in the comparison group and the relative effect of the intervention (and its 95% CI). | ||||||
| GRADE Working Group grades of evidence. | ||||||
| aDowngraded one level for serious study limitations owing to weak evidence for publication bias, particularly for studies of hydrocortisone. bDowngraded one level for serious study limitations owing to weak evidence for publication bias, for both dexamethasone and hydrocortisone studies. cDowngraded one level for serious study limitations owing to moderate heterogeneity, particularly for studies of dexamethasone. | ||||||
| Outcome or subgroup title | No. of studies | No. of participants | Statistical method | Effect size |
| 1 Neonatal mortality (up to 28 days) Show forest plot | 19 | 2950 | Risk Ratio (M‐H, Fixed, 95% CI) | 1.02 [0.88, 1.19] |
| 1.1 Dexamethasone | 16 | 2603 | Risk Ratio (M‐H, Fixed, 95% CI) | 1.06 [0.90, 1.24] |
| 1.2 Hydrocortisone | 3 | 347 | Risk Ratio (M‐H, Fixed, 95% CI) | 0.78 [0.50, 1.23] |
| 2 Mortality at 36 weeks Show forest plot | 20 | 3733 | Risk Ratio (M‐H, Fixed, 95% CI) | 1.01 [0.89, 1.14] |
| 2.1 Dexamethasone | 14 | 2487 | Risk Ratio (M‐H, Fixed, 95% CI) | 1.08 [0.94, 1.25] |
| 2.2 Hydrocortisone | 6 | 1246 | Risk Ratio (M‐H, Fixed, 95% CI) | 0.83 [0.65, 1.06] |
| 3 Mortality to hospital discharge Show forest plot | 30 | 4273 | Risk Ratio (M‐H, Fixed, 95% CI) | 0.95 [0.85, 1.07] |
| 3.1 Dexamethasone | 19 | 2840 | Risk Ratio (M‐H, Fixed, 95% CI) | 1.03 [0.90, 1.18] |
| 3.2 Hydrocortisone | 11 | 1433 | Risk Ratio (M‐H, Fixed, 95% CI) | 0.80 [0.65, 0.98] |
| 4 Mortality at latest reported age Show forest plot | 31 | 4373 | Risk Ratio (M‐H, Fixed, 95% CI) | 0.95 [0.85, 1.06] |
| 4.1 Dexamethasone | 20 | 2940 | Risk Ratio (M‐H, Fixed, 95% CI) | 1.02 [0.90, 1.16] |
| 4.2 Hydrocortisone | 11 | 1433 | Risk Ratio (M‐H, Fixed, 95% CI) | 0.80 [0.65, 0.99] |
| Outcome or subgroup title | No. of studies | No. of participants | Statistical method | Effect size |
| 1 BPD (28 days of life) Show forest plot | 17 | 2874 | Risk Ratio (M‐H, Fixed, 95% CI) | 0.87 [0.81, 0.93] |
| 1.1 Dexamethasone | 16 | 2621 | Risk Ratio (M‐H, Fixed, 95% CI) | 0.85 [0.79, 0.92] |
| 1.2 Hydrocortisone | 1 | 253 | Risk Ratio (M‐H, Fixed, 95% CI) | 1.00 [0.85, 1.18] |
| 2 BPD (36 weeks' postmenstrual age) Show forest plot | 24 | 3929 | Risk Ratio (M‐H, Fixed, 95% CI) | 0.79 [0.72, 0.87] |
| 2.1 Dexamethasone | 16 | 2584 | Risk Ratio (M‐H, Fixed, 95% CI) | 0.71 [0.62, 0.81] |
| 2.2 Hydrocortisone | 8 | 1345 | Risk Ratio (M‐H, Fixed, 95% CI) | 0.91 [0.80, 1.05] |
| 3 BPD at 36 weeks' postmenstrual age in survivors Show forest plot | 21 | 2970 | Risk Ratio (M‐H, Fixed, 95% CI) | 0.81 [0.74, 0.88] |
| 3.1 Dexamethasone | 14 | 1917 | Risk Ratio (M‐H, Fixed, 95% CI) | 0.73 [0.64, 0.83] |
| 3.2 Hydrocortisone | 7 | 1053 | Risk Ratio (M‐H, Fixed, 95% CI) | 0.91 [0.80, 1.03] |
| 4 Late rescue with corticosteroids Show forest plot | 14 | 2483 | Risk Ratio (M‐H, Fixed, 95% CI) | 0.75 [0.68, 0.82] |
| 4.1 Dexamethasone | 10 | 1974 | Risk Ratio (M‐H, Fixed, 95% CI) | 0.72 [0.65, 0.80] |
| 4.2 Hydrocortisone | 4 | 509 | Risk Ratio (M‐H, Fixed, 95% CI) | 1.01 [0.73, 1.40] |
| 5 Survivors who had late rescue with corticosteroids Show forest plot | 7 | 895 | Risk Ratio (M‐H, Fixed, 95% CI) | 0.77 [0.67, 0.89] |
| 5.1 Dexamethasone | 6 | 853 | Risk Ratio (M‐H, Fixed, 95% CI) | 0.79 [0.68, 0.91] |
| 5.2 Hydrocortisone | 1 | 42 | Risk Ratio (M‐H, Fixed, 95% CI) | 0.48 [0.24, 0.98] |
| 6 Survivors discharged home on oxygen Show forest plot | 6 | 691 | Risk Ratio (M‐H, Fixed, 95% CI) | 0.72 [0.51, 1.03] |
| 6.1 Dexamethasone | 3 | 406 | Risk Ratio (M‐H, Fixed, 95% CI) | 0.78 [0.48, 1.26] |
| 6.2 Hydrocortisone | 3 | 285 | Risk Ratio (M‐H, Fixed, 95% CI) | 0.66 [0.40, 1.11] |
| Outcome or subgroup title | No. of studies | No. of participants | Statistical method | Effect size |
| 1 Death or BPD at 28 days of life Show forest plot | 15 | 2546 | Risk Ratio (M‐H, Fixed, 95% CI) | 0.92 [0.88, 0.96] |
| 1.1 Dexamethasone | 14 | 2293 | Risk Ratio (M‐H, Fixed, 95% CI) | 0.91 [0.86, 0.96] |
| 1.2 Hydrocortisone | 1 | 253 | Risk Ratio (M‐H, Fixed, 95% CI) | 1.00 [0.90, 1.12] |
| 2 Death or BPD at 36 weeks' postmenstrual age Show forest plot | 25 | 3960 | Risk Ratio (M‐H, Fixed, 95% CI) | 0.88 [0.83, 0.93] |
| 2.1 Dexamethasone | 16 | 2581 | Risk Ratio (M‐H, Fixed, 95% CI) | 0.87 [0.80, 0.94] |
| 2.2 Hydrocortisone | 9 | 1379 | Risk Ratio (M‐H, Fixed, 95% CI) | 0.90 [0.82, 0.99] |
| Outcome or subgroup title | No. of studies | No. of participants | Statistical method | Effect size |
| 1 Failure to extubate by third day Show forest plot | 4 | 887 | Risk Ratio (M‐H, Fixed, 95% CI) | 0.85 [0.75, 0.95] |
| 1.1 Dexamethasone | 3 | 381 | Risk Ratio (M‐H, Fixed, 95% CI) | 0.73 [0.62, 0.86] |
| 1.2 Hydrocortisone | 1 | 506 | Risk Ratio (M‐H, Fixed, 95% CI) | 0.96 [0.82, 1.14] |
| 2 Failure to extubate by seventh day Show forest plot | 8 | 1448 | Risk Ratio (M‐H, Fixed, 95% CI) | 0.76 [0.68, 0.85] |
| 2.1 Dexamethasone | 6 | 703 | Risk Ratio (M‐H, Fixed, 95% CI) | 0.71 [0.61, 0.84] |
| 2.2 Hydrocortisone | 2 | 745 | Risk Ratio (M‐H, Fixed, 95% CI) | 0.80 [0.69, 0.94] |
| 3 Failure to extubate by 14th day Show forest plot | 4 | 443 | Risk Ratio (M‐H, Fixed, 95% CI) | 0.77 [0.62, 0.97] |
| 4 Failure to extubate by 28th day Show forest plot | 7 | 902 | Risk Ratio (M‐H, Fixed, 95% CI) | 0.84 [0.72, 0.98] |
| Outcome or subgroup title | No. of studies | No. of participants | Statistical method | Effect size |
| 1 Infection Show forest plot | 25 | 4101 | Risk Ratio (M‐H, Fixed, 95% CI) | 1.05 [0.96, 1.15] |
| 1.1 Dexamethasone | 18 | 2821 | Risk Ratio (M‐H, Fixed, 95% CI) | 1.02 [0.91, 1.15] |
| 1.2 Hydrocortisone | 7 | 1280 | Risk Ratio (M‐H, Fixed, 95% CI) | 1.08 [0.94, 1.25] |
| 2 Hyperglycaemia Show forest plot | 13 | 2167 | Risk Ratio (M‐H, Fixed, 95% CI) | 1.33 [1.20, 1.47] |
| 2.1 Dexamethasone | 12 | 2117 | Risk Ratio (M‐H, Fixed, 95% CI) | 1.35 [1.21, 1.49] |
| 2.2 Hydrocortisone | 1 | 50 | Risk Ratio (M‐H, Fixed, 95% CI) | 0.92 [0.50, 1.67] |
| 3 Hypertension Show forest plot | 11 | 1993 | Risk Ratio (M‐H, Fixed, 95% CI) | 1.85 [1.54, 2.22] |
| 3.1 Dexamethasone | 10 | 1943 | Risk Ratio (M‐H, Fixed, 95% CI) | 1.84 [1.53, 2.21] |
| 3.2 Hydrocortisone | 1 | 50 | Risk Ratio (M‐H, Fixed, 95% CI) | 3.0 [0.33, 26.92] |
| 4 Hypertrophic cardiomyopathy Show forest plot | 1 | 50 | Risk Ratio (M‐H, Fixed, 95% CI) | 4.33 [1.40, 13.37] |
| 5 Growth failure Show forest plot | 1 | 50 | Risk Ratio (M‐H, Fixed, 95% CI) | 6.67 [2.27, 19.62] |
| 6 Pulmonary air leak Show forest plot | 16 | 3225 | Risk Ratio (M‐H, Fixed, 95% CI) | 0.91 [0.74, 1.13] |
| 6.1 Dexamethasone | 12 | 2041 | Risk Ratio (M‐H, Fixed, 95% CI) | 0.85 [0.66, 1.08] |
| 6.2 Hydrocortisone | 4 | 1184 | Risk Ratio (M‐H, Fixed, 95% CI) | 1.11 [0.75, 1.65] |
| 7 Patent ductus arteriosus (PDA) Show forest plot | 24 | 4013 | Risk Ratio (M‐H, Fixed, 95% CI) | 0.78 [0.72, 0.85] |
| 7.1 Dexamethasone | 17 | 2706 | Risk Ratio (M‐H, Fixed, 95% CI) | 0.76 [0.69, 0.84] |
| 7.2 Hydrocortisone | 7 | 1307 | Risk Ratio (M‐H, Fixed, 95% CI) | 0.82 [0.71, 0.95] |
| 8 Severe IVH Show forest plot | 26 | 4103 | Risk Ratio (M‐H, Fixed, 95% CI) | 0.96 [0.83, 1.11] |
| 8.1 Dexamethasone | 17 | 2736 | Risk Ratio (M‐H, Fixed, 95% CI) | 0.96 [0.81, 1.14] |
| 8.2 Hydrocortisone | 9 | 1367 | Risk Ratio (M‐H, Fixed, 95% CI) | 0.95 [0.74, 1.23] |
| 9 Severe intraventricular haemorrhage (IVH) in infants examined Show forest plot | 7 | 1909 | Risk Ratio (M‐H, Fixed, 95% CI) | 0.90 [0.74, 1.11] |
| 10 Periventricular leukomalacia (PVL) Show forest plot | 15 | 2807 | Risk Ratio (M‐H, Fixed, 95% CI) | 1.07 [0.78, 1.46] |
| 10.1 Dexamethasone | 8 | 1514 | Risk Ratio (M‐H, Fixed, 95% CI) | 1.23 [0.84, 1.81] |
| 10.2 Hydrocortisone | 7 | 1293 | Risk Ratio (M‐H, Fixed, 95% CI) | 0.81 [0.46, 1.40] |
| 11 PVL in infants with cranial ultrasound scans Show forest plot | 7 | 1841 | Risk Ratio (M‐H, Fixed, 95% CI) | 1.13 [0.79, 1.60] |
| 12 PVL in survivors seen at follow‐up Show forest plot | 2 | 183 | Risk Ratio (M‐H, Fixed, 95% CI) | 1.22 [0.60, 2.48] |
| 13 Necrotising enterocolitis (NEC) Show forest plot | 25 | 4050 | Risk Ratio (M‐H, Fixed, 95% CI) | 0.90 [0.74, 1.11] |
| 13.1 Dexamethasone | 15 | 2661 | Risk Ratio (M‐H, Fixed, 95% CI) | 0.88 [0.69, 1.13] |
| 13.2 Hydrocortisone | 10 | 1389 | Risk Ratio (M‐H, Fixed, 95% CI) | 0.95 [0.66, 1.37] |
| 14 Gastrointestinal bleeding Show forest plot | 12 | 1816 | Risk Ratio (M‐H, Fixed, 95% CI) | 1.86 [1.35, 2.55] |
| 14.1 Dexamethasone | 10 | 1725 | Risk Ratio (M‐H, Fixed, 95% CI) | 1.87 [1.35, 2.58] |
| 14.2 Hydrocortisone | 2 | 91 | Risk Ratio (M‐H, Fixed, 95% CI) | 1.53 [0.27, 8.74] |
| 15 Gastrointestinal perforation Show forest plot | 16 | 3040 | Risk Difference (M‐H, Fixed, 95% CI) | 0.03 [0.02, 0.05] |
| 15.1 Dexamethasone | 9 | 1936 | Risk Difference (M‐H, Fixed, 95% CI) | 0.03 [0.01, 0.05] |
| 15.2 Hydrocortisone | 7 | 1104 | Risk Difference (M‐H, Fixed, 95% CI) | 0.03 [0.00, 0.06] |
| 16 Pulmonary haemorrhage Show forest plot | 10 | 1820 | Risk Ratio (M‐H, Fixed, 95% CI) | 1.16 [0.87, 1.54] |
| 16.1 Dexamethasone | 7 | 686 | Risk Ratio (M‐H, Fixed, 95% CI) | 0.97 [0.65, 1.45] |
| 16.2 Hydrocortisone | 3 | 1134 | Risk Ratio (M‐H, Fixed, 95% CI) | 1.36 [0.92, 2.03] |
| 17 Any retinopathy of prematurity (ROP) Show forest plot | 9 | 1345 | Risk Ratio (M‐H, Fixed, 95% CI) | 0.88 [0.80, 0.97] |
| 17.1 Dexamethasone | 8 | 1042 | Risk Ratio (M‐H, Fixed, 95% CI) | 0.84 [0.72, 0.99] |
| 17.2 Hydrocortisone | 1 | 303 | Risk Ratio (M‐H, Fixed, 95% CI) | 0.93 [0.84, 1.04] |
| 18 Severe ROP Show forest plot | 14 | 2577 | Risk Ratio (M‐H, Fixed, 95% CI) | 0.81 [0.66, 0.98] |
| 18.1 Dexamethasone | 8 | 1507 | Risk Ratio (M‐H, Fixed, 95% CI) | 0.77 [0.60, 0.99] |
| 18.2 Hydrocortisone | 6 | 1070 | Risk Ratio (M‐H, Fixed, 95% CI) | 0.87 [0.63, 1.21] |
| 19 Severe ROP in survivors Show forest plot | 12 | 1575 | Risk Ratio (M‐H, Fixed, 95% CI) | 0.77 [0.64, 0.94] |
| 19.1 Dexamethasone | 10 | 1238 | Risk Ratio (M‐H, Fixed, 95% CI) | 0.75 [0.59, 0.95] |
| 19.2 Hydrocortisone | 2 | 337 | Risk Ratio (M‐H, Fixed, 95% CI) | 0.83 [0.60, 1.17] |
| Outcome or subgroup title | No. of studies | No. of participants | Statistical method | Effect size |
| 1 Bayley Mental Developmental Index (MDI) <‐2 SD Show forest plot | 3 | 842 | Risk Ratio (M‐H, Fixed, 95% CI) | 1.00 [0.78, 1.29] |
| 2 Bayley MDI <‐2 SD in tested survivors Show forest plot | 3 | 528 | Risk Ratio (M‐H, Fixed, 95% CI) | 1.00 [0.79, 1.25] |
| 3 Bayley Psychomotor Developmental Index (PDI) <‐2 SD Show forest plot | 3 | 842 | Risk Ratio (M‐H, Fixed, 95% CI) | 1.17 [0.85, 1.60] |
| 4 Bayley PDI <‐2 SD in tested survivors Show forest plot | 3 | 528 | Risk Ratio (M‐H, Fixed, 95% CI) | 1.17 [0.87, 1.57] |
| 5 Developmental delay (criteria not specified) Show forest plot | 1 | 248 | Risk Ratio (M‐H, Fixed, 95% CI) | 1.68 [1.08, 2.61] |
| 6 Developmental delay (criteria not specified) in tested survivors Show forest plot | 1 | 159 | Risk Ratio (M‐H, Fixed, 95% CI) | 1.94 [1.30, 2.88] |
| 7 Blindness Show forest plot | 8 | 939 | Risk Ratio (M‐H, Fixed, 95% CI) | 2.01 [0.74, 5.50] |
| 8 Blindness in survivors assessed Show forest plot | 8 | 585 | Risk Ratio (M‐H, Fixed, 95% CI) | 2.16 [0.80, 5.86] |
| 9 Deafness Show forest plot | 8 | 721 | Risk Ratio (M‐H, Fixed, 95% CI) | 1.14 [0.39, 3.37] |
| 10 Deafness in survivors assessed Show forest plot | 8 | 476 | Risk Ratio (M‐H, Fixed, 95% CI) | 1.14 [0.40, 3.29] |
| 11 Cerebral palsy Show forest plot | 13 | 1973 | Risk Ratio (IV, Fixed, 95% CI) | 1.42 [1.06, 1.91] |
| 11.1 Dexamethasone | 7 | 921 | Risk Ratio (IV, Fixed, 95% CI) | 1.75 [1.20, 2.55] |
| 11.2 Hydrocortisone | 6 | 1052 | Risk Ratio (IV, Fixed, 95% CI) | 1.05 [0.66, 1.66] |
| 12 Death before follow‐up in trials assessing cerebral palsy Show forest plot | 13 | 1973 | Risk Ratio (M‐H, Fixed, 95% CI) | 0.90 [0.78, 1.05] |
| 12.1 Dexamethasone | 7 | 921 | Risk Ratio (M‐H, Fixed, 95% CI) | 0.99 [0.81, 1.21] |
| 12.2 Hydrocortisone | 6 | 1052 | Risk Ratio (M‐H, Fixed, 95% CI) | 0.81 [0.64, 1.02] |
| 13 Death or cerebral palsy Show forest plot | 13 | 1973 | Risk Ratio (M‐H, Fixed, 95% CI) | 1.03 [0.91, 1.16] |
| 13.1 Dexamethasone | 7 | 921 | Risk Ratio (M‐H, Fixed, 95% CI) | 1.17 [1.00, 1.37] |
| 13.2 Hydrocortisone | 6 | 1052 | Risk Ratio (M‐H, Fixed, 95% CI) | 0.86 [0.71, 1.05] |
| 14 Cerebral palsy in survivors assessed Show forest plot | 13 | 1328 | Risk Ratio (M‐H, Fixed, 95% CI) | 1.45 [1.11, 1.90] |
| 14.1 Dexamethasone | 7 | 586 | Risk Ratio (M‐H, Fixed, 95% CI) | 1.82 [1.29, 2.57] |
| 14.2 Hydrocortisone | 6 | 742 | Risk Ratio (M‐H, Fixed, 95% CI) | 1.01 [0.65, 1.58] |
| 15 Major neurosensory disability (variable criteria ‐ see individual studies) Show forest plot | 7 | 1703 | Risk Ratio (M‐H, Fixed, 95% CI) | 1.08 [0.89, 1.33] |
| 15.1 Dexamethasone | 4 | 772 | Risk Ratio (M‐H, Fixed, 95% CI) | 1.37 [1.03, 1.83] |
| 15.2 Hydrocortisone | 3 | 931 | Risk Ratio (M‐H, Fixed, 95% CI) | 0.86 [0.64, 1.14] |
| 16 Death before follow‐up in trials assessing major neurosensory disability (variable criteria) Show forest plot | 6 | 1182 | Risk Ratio (M‐H, Fixed, 95% CI) | 0.97 [0.81, 1.17] |
| 16.1 Dexamethasone | 4 | 772 | Risk Ratio (M‐H, Fixed, 95% CI) | 1.02 [0.82, 1.25] |
| 16.2 Hydrocortisone | 2 | 410 | Risk Ratio (M‐H, Fixed, 95% CI) | 0.86 [0.58, 1.28] |
| 17 Death or major neurosensory disability (variable criteria) Show forest plot | 7 | 1703 | Risk Ratio (M‐H, Fixed, 95% CI) | 0.97 [0.87, 1.08] |
| 17.1 Dexamethasone | 4 | 772 | Risk Ratio (M‐H, Fixed, 95% CI) | 1.13 [0.99, 1.30] |
| 17.2 Hydrocortisone | 3 | 931 | Risk Ratio (M‐H, Fixed, 95% CI) | 0.82 [0.69, 0.97] |
| 18 Major neurosensory disability in survivors examined (variable criteria) Show forest plot | 8 | 1178 | Risk Ratio (M‐H, Fixed, 95% CI) | 1.07 [0.89, 1.28] |
| 18.1 Dexamethasone | 4 | 469 | Risk Ratio (M‐H, Fixed, 95% CI) | 1.36 [1.05, 1.77] |
| 18.2 Hydrocortisone | 4 | 709 | Risk Ratio (M‐H, Fixed, 95% CI) | 0.84 [0.65, 1.10] |
| 19 Abnormal neurological exam (variable criteria ‐ see individual studies) Show forest plot | 5 | 829 | Risk Ratio (M‐H, Fixed, 95% CI) | 1.81 [1.33, 2.47] |
| 20 Death before follow‐up in trials assessing abnormal neurological exam (variable criteria) Show forest plot | 6 | 1350 | Risk Ratio (M‐H, Fixed, 95% CI) | 0.89 [0.75, 1.07] |
| 20.1 Dexamethasone | 5 | 829 | Risk Ratio (M‐H, Fixed, 95% CI) | 0.97 [0.79, 1.21] |
| 20.2 Hydrocortisone | 1 | 521 | Risk Ratio (M‐H, Fixed, 95% CI) | 0.75 [0.54, 1.04] |
| 21 Death or abnormal neurological exam (variable criteria) Show forest plot | 5 | 829 | Risk Ratio (M‐H, Fixed, 95% CI) | 1.23 [1.06, 1.42] |
| 22 Abnormal neurological exam in tested survivors (variable criteria) Show forest plot | 5 | 508 | Risk Ratio (M‐H, Fixed, 95% CI) | 1.89 [1.41, 2.52] |
| 23 Intellectual impairment (IQ < 70) Show forest plot | 2 | 90 | Risk Ratio (M‐H, Fixed, 95% CI) | 1.37 [0.57, 3.31] |
| 24 Intellectual impairment (IQ < 70) in survivors assessed Show forest plot | 2 | 76 | Risk Ratio (M‐H, Fixed, 95% CI) | 1.12 [0.47, 2.65] |
| 25 "Major neurosensory impairment" ‐ blindness or deafness Show forest plot | 1 | 50 | Risk Ratio (M‐H, Fixed, 95% CI) | 0.6 [0.16, 2.25] |
| 26 "Major neurosensory impairment" ‐ blindness or deafness ‐ in survivors assessed Show forest plot | 1 | 45 | Risk Ratio (M‐H, Fixed, 95% CI) | 0.57 [0.16, 2.12] |
| 27 Behaviour abnormalities Show forest plot | 1 | 50 | Risk Ratio (M‐H, Fixed, 95% CI) | 0.6 [0.16, 2.25] |
| 28 Behaviour abnormalities in 3‐year‐old survivors assessed Show forest plot | 1 | 46 | Risk Ratio (M‐H, Fixed, 95% CI) | 0.6 [0.16, 2.22] |
| 29 Abnormal EEG Show forest plot | 2 | 306 | Risk Ratio (M‐H, Fixed, 95% CI) | 1.24 [0.66, 2.33] |
| 30 Abnormal EEG in tested survivors Show forest plot | 2 | 146 | Risk Ratio (M‐H, Fixed, 95% CI) | 1.13 [0.61, 2.08] |
| 31 Rehospitalisation in infancy Show forest plot | 3 | 672 | Risk Ratio (M‐H, Fixed, 95% CI) | 0.86 [0.68, 1.08] |
| 32 Rehospitalisation in infancy in survivors Show forest plot | 3 | 430 | Risk Ratio (M‐H, Fixed, 95% CI) | 0.87 [0.71, 1.07] |